Impact
Evaluation
Report 113
Alex Armand
Britta Augsburg
Antonella Bancalari
Bhartendu Trivedi
Water, sanitation and waste management
Community toilet use in Indian slums
Willingness-to-pay and the role of
informational and supply side constraints
March 2020
About 3ie
The International Initiative for Impact Evaluation (3ie) promotes evidence-informed, equitable, inclusive and sustainable development. We support the generation and effective use of high-quality evidence to inform decision-making and improve the lives of people living in poverty in low- and middle-income countries. We provide guidance and support to produce, synthesise and quality assure evidence of what works, for whom, how, why and at what cost.
3ie impact evaluations
3ie-supported impact evaluations assess the difference a development intervention has made to social and economic outcomes. 3ie is committed to funding rigorous evaluations that include a theory-based design and that use the most appropriate mix of methods to capture outcomes and are useful in complex development contexts.
About this report
3ie accepted the final version of the report, Community toilet use in Indian slums: willingness-to-pay and the role of informational and supply side constraints, as partial fulfilment of requirements under grant DPW1.1105 awarded through Development Priorities Window 1. The report is technically sound and 3ie is making it available to the public in this final report version as it was received. No further work has been done. The 3ie technical quality assurance team for this report comprises Francis Rathinam, Neeta Goel, Deeksha Ahuja, an anonymous external impact evaluation design expert reviewer and an anonymous external sector expert reviewer, with overall technical supervision by Marie Gaarder. The 3ie editorial production team for this report comprises Anushruti Ganguly and Akarsh Gupta.
All of the content is the sole responsibility of the authors and does not represent the opinions of 3ie, its donors or its board of commissioners. Any errors and omissions are also the sole responsibility of the authors. All affiliations of the authors listed in the title page are those that were in effect at the time the report was accepted. Please direct any comments or queries to the corresponding author, Alex Armand at:
Funding for this impact evaluation was provided by UK aid through the Department for International Development. A complete listing of all of 3ie’s donors is available on the 3ie website.
Suggested citation: Armand, A, Augsburg, B, Bancalari A and Trivedi B, 2020. Community toilet use in Indian slums: willingness-to-pay and the role of informational and supply side constraints, 3ie Impact Evaluation Report 113. New Delhi: International Initiative for Impact Evaluation (3ie). Available at: https://doi.org/10.23846/DPW1IE113 Cover photo: Juggadery / Flickr
Community toilet use in Indian slums: willingness-to-pay and the
role of informational and supply side constraints
Alex Armand
NOVA School of Business and Economics, Navarra Center for International Development and Institute for Fiscal Studies
Britta Augsburg
Institute for Fiscal Studies Antonella Bancalari
London School of Economics and Institute for Fiscal Studies Bhartendu Trivedi
Morsel India
Impact Evaluation Report 113
March 2020
Acknowledgements
Many have contributed to the success of this report. We would like to acknowledge in particular the inspiring support of:
• All enumerators and supervisors that have spent countless hours working in the field;
• All collaborators of FINISH for their precious and highly-motivated assistance during the study design and during the implementation of the interventions. Without the contribution of all of the above the success of this report would not have been possible.
Summary
While urbanization can bring benefits for economic, cultural and societal development, cities in low and middle-income countries are struggling to keep up with necessary infrastructure investment. In particular, in urban slums, the water, sanitation, and hygiene infrastructure is stressed beyond current capacity. Since inadequate sanitation is threatening to the general population, and in particular to early-life health, when coupled with high population density (Hathi et al. 2017), efforts to improve sanitary conditions in slums are of direct policy relevance. In the setting of urban slums, it is generally accepted that public and community toilets (CTs) will, for the foreseeable future, continue to be an important solution to improve sanitary conditions, given numerous constraints to increasing access to safely-managed private toilets. However, even where CTs are available, open defecation remains common behaviour among slum-dwellers (Indian Ministry of Home Affairs 2011).
This study implements a randomized-controlled trial (RCT) in the context of Indian slums in the cities of Lucknow and Kanpur (Uttar Pradesh, India). Slums in these districts are similar to other slums in India along a number of margins, including the demographic, literacy and caste composition. We select a total of 110 catchment areas of CTs in both cities and randomly allocated them to one of three experimental arms: Treatment 1 group, Treatment 2 group, and a control group. In the Treatment 1 (Supply-side intervention) group, we promote cleanliness and maintenance of CTs by introducing a grant scheme that offers standardized (i.e. same monetary value) packages to improve the quality of the CT, and by afterwards providing financial rewards aimed at
incentivizing caretakers to keep the CT clean. In the Treatment 2 (Supply-side plus Information intervention) group, in addition to the intervention provided for Treatment 1, a household-level information campaign is provided. In the control group, participants do not receive supply-side nor information interventions. This design, combined with several rounds of data collection over a period of 18 months, both at the household and the CT level, allows us to address our three research objectives, which are (1) to document slum dwellers’ willingness to pay (WTP) for CTs and its link with CT usage; (2) to identify the impact of releasing supply-side or both supply-side and informational constraints on WTP and usage; and (3) to determine the time horizon of such impacts (short-term, longer-term, or both).
The baseline report provided already an overview with respect to the first objective. Two key findings are worth reiterating. For one, we found that slum dwellers’ WTP (using incentivized elicitation methods) was substantially below the market rate for CT usage, both for male and female dwellers. Second, we found that WTP for a hypothetical high-quality CT is substantially higher than for current standard CTs. acknowledging the drawbacks of un-incentivized elicitation (as it is the case of the hypothetical WTP), these results suggests potential for our treatments to increase WTP for CT usage. We discuss our findings with respect to impacts in this report, addressing objectives 2 and 3.
We conduct additional analysis with respect to measured WTP. A few findings stand out in particular with respect to gender differences: Men’s and women’s WTP for using CTs are determined differently. We find that men are willing to pay less for a hypothetical high-quality CT when local CTs are currently of bad quality, but this does not seem to affect women. When eliciting the WTP for using the current CT, we find that men have a higher WTP for CTs if a higher proportion of people in a 100m radius believe that
practicing OD is shameful. Yet, this social norm is not important for women, who instead attach a much higher importance to whether or not they have a toilet at home. We further find that both men and women are less willing to contribute to the CT’s cleaning when it is already cleaned adequately. We also find evidence of screening effects: the share of households using CTs per catchment area is a function of the mean WTP of study households. The relationship is sharper when looking at the WTP of men than women, suggesting that men’s WTP is a stronger determinant of household CT usage. Other strong determinants of CT usage - in line with existing literature - is distance from the household to the local CT and people’s attitudes towards CTs. Moreover, expectations of health benefits from using CTs instead of practicing OD are negatively associated with OD practice. Notably, we observe that CTs which were adequately cleaned are paid for more often. When looking at the predictors of CT quality, we find that how adequately a CT is cleaned is a key predictor of the number of bacteria and observed cleanliness. Randomization and interventions were implemented in line with the research protocol. Treatment groups are balanced on a vast array of characteristics, supporting the ex-ante comparability of CTs allocated to different groups. In addition, intervention uptake was very high. In terms of the supply intervention, 95% of CTs chose a grant scheme (of these, 41% repairs, 41% deep cleaning, and remaining 12% training and provision of cleaning agents and tools) and about 95% participated in the financial reward scheme (97% received the announcement and were available for the first payment, and 94% for the second and third payment). Similarly, the uptake of the information campaign was high: door-to-door information sessions and provision of leaflets was conducted in almost all households targeted across the three rounds, and households listened to an average of 7 voice messages (sent to mobiles) about health risks from open defecation. Further, all CTs allocated to the information treatment arm had informative posters on their walls, which users were hence exposed to. We demonstrate in this report that exposure to the information campaign resulted in significant effects on households reporting that they listened to voice messages about water, sanitation and hygiene (WASH) through communication technologies; that they saw posters in the community toilet; that they were visited by an agent talking about WASH; and, that they heard of, and for some attended, events organized in the community about WASH.
Despite the significant exposure, the treatments do not translate into an increase in the willingness to pay (WTP) for community toilet use during the whole duration of the study. If any, while the supply-side treatment leads to small (insignificant) increases in WTP, we do observe short-run negative effects on WTP driven by supplementing the supply-side intervention with the information campaign. The information campaign could have affected the extent to which households internalize the negative externalities from inadequate sanitation behaviour. At the same time, we find that the treatments increase the share of users that pay the fee to use the CT. This effect is driven by both male and female users, though the effect for males is more precisely estimated. We bring forward two possible explanations for this finding: On the one hand, the financial reward
component of the supply intervention, which promised cash to the caretaker conditional on keeping the CT clean and having soap available, may have incentivized caretakers to collect resources (i.e. make (more) users pay) to achieve these goals. On the other hand, the information campaign may have reinforced the need to pay fees for households that were already regular users of the CT.
Looking at secondary outcomes, we find a short- and medium-run effect of the supply side treatment on hand-washing with soap– a potential result of the grant and incentive scheme. Impacts on other secondary outcomes, as well as remaining primary ones (in particular self-reported CT usage) are negligible.
Even though we observe small changes in individual behaviour, we document that the treatments increase the salience of CT cleanliness when reporting issues to
policymakers. When given the opportunity to fill-in “voice-to-the-people” style of cards, in which they are given the possibility to report the most important concerns from a set of different topics to local public officers, more treated households report the dirtiness of the CT as their primary concern. This result highlights the role of policymakers in
guaranteeing cleanliness of CTs by solving the potential coordination problem in slums. Looking at CT-level outcomes, we find nil effects of the treatments on caretakers’ behaviour, such as the percentage of time they report allocating to clean or supervising the cleaner and collecting fees; whether the caretaker reports the CT is cleaned at least twice per day; and, whether the caretaker reports adequate cleaning of the CT.
Contents
Acknowledgements ... i
Summary ... ii
List of figures and tables ... vi
Acronyms ... vii 1. Introduction ... 1 2. Intervention ... 3 2.1 Description ... 3 2.2 Theory of change ... 8 2.3 Monitoring plan... 12 3. Evaluation... 13
3.1 Primary and secondary questions ... 13
3.2 Design and methods ... 14
3.3 Ethics ... 15
3.4 Sampling and data collection... 16
4. Findings ... 28
4.1 Intervention implementation fidelity ... 28
4.2 Impact analysis ... 31
5. Cost analysis ... 53
6. Discussion ... 54
6.1 Policy and programme relevance: evidence uptake and use ... 54
6.2 Challenges and lessons ... 55
7. Conclusions and recommendations ... 56
Appendix A: Field notes from formative work ... 57
Appendix B: Pre-analysis Plan ... 62
List of figures and tables
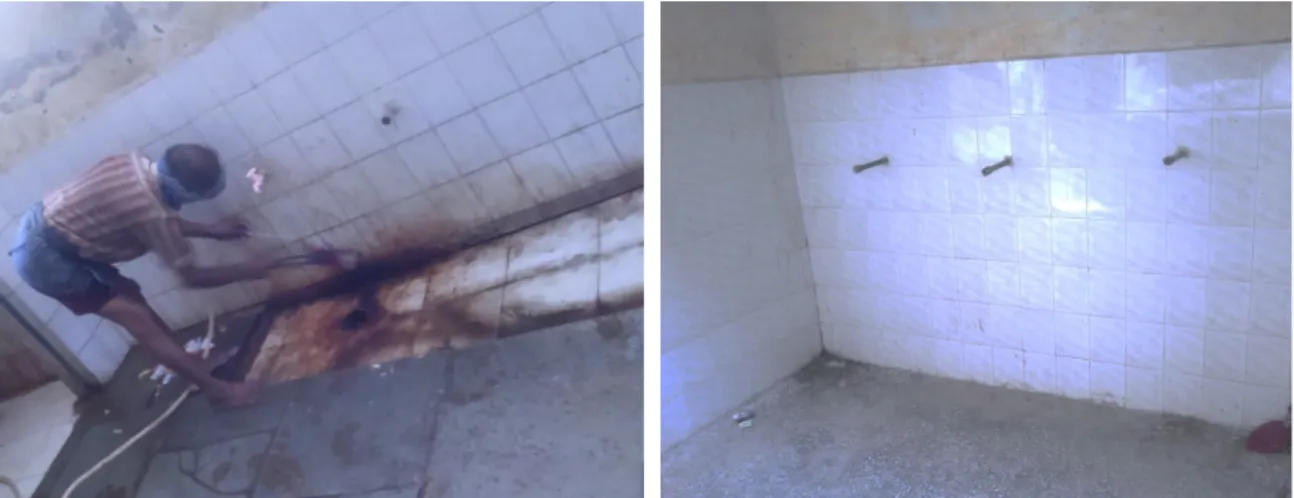
Figure 1: Example of before and after a deep cleaning of a CT in Lucknow ... 5
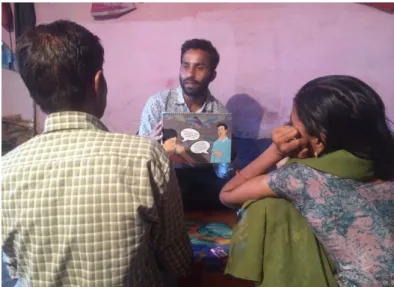
Figure 2: Example of Information campaign provided to a family in Lucknow ... 7
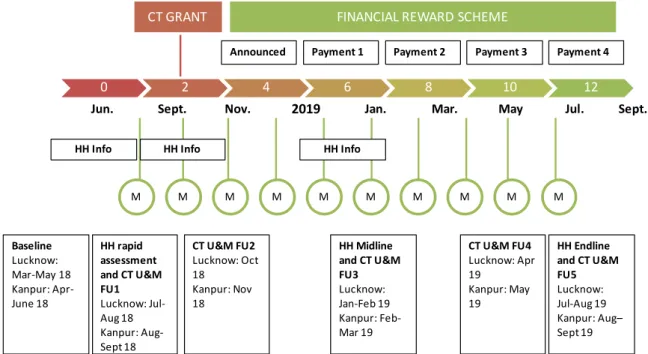
Figure 3:Timeline of intervention and survey rounds ... 8
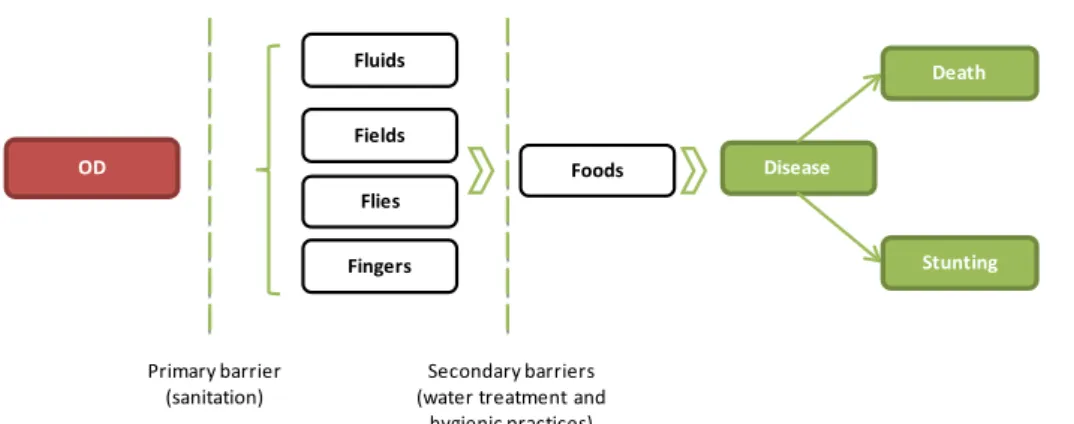
Figure 4: How open defecation affects health ... 9
Figure 5: Theory of Change ... 10
Figure 6: Study location ... 14
Figure 7: CT Sampling Frame ... 16
Figure 8: Flowchart for the sampling procedure ... 18
Figure 9: Consort Flow Chart for household surveys ... 26
Figure 10: Consort Flow Chart for CT surveys ... 27
Figure 11: Descriptive statistics about voice messages ... 31
Figure 12: Impact on WTP by data collection round ... 41
Figure 13: Impact on hand-washing by data collection round ... 44
Figure 14: Impact on % users that pay by data collection round ... 46
Figure 15: Open-ended interview in Lucknow ... 60
Table 1: Number of CT catchment areas per treatment arm and city ... 17
Table 2: Distribution of study households, by treatment arm and city ... 19
Table 3: Comparison of demographics by attrition status ... 21
Table 4: Selection of grant choice and uptake ... 28
Table 5: Caretaker’s recall of grant scheme at Endline ... 28
Table 6: Financial Reward Scheme uptake ... 29
Table 7: Exposure to information campaign ... 30
Table 8: Descriptive statistics of CT sample population, by city and study participation . 32 Table 9: Descriptive statistics of HH sample population, by city and eligibility ... 34
Table 10: Balance test: primary outcomes at household level ... 35
Table 11: Balance test: secondary outcomes at household level ... 36
Table 12: Balance test: primary and secondary outcomes at CT level ... 37
Table 13: Impact on primary outcomes... 41
Table 14: Impact on primary outcomes, pooled treatment ... 42
Table 15: Impact on HH secondary outcomes ... 43
Table 16: Impact on secondary outcomes, pooled treatment ... 44
Table 17: Impact on political salience, pooled treatment arms ... 45
Table 18: Impact on CT primary outcomes ... 46
Table 19: Impact on CT secondary outcomes ... 47
Table 20: Impact on secondary outcomes, pooled treatment ... 48
Table 21: Heterogenous impact by gender of respondent ... 49
Table 22: Heterogenous impact by WTP ... 49
Table 23: Heterogenous impact by OD... 50
Table 24: Heterogenous impact by knowledge of OD health risks ... 50
Table 25: Heterogenous impact by wealth ... 51
Table 26: Heterogenous impact by community trust ... 51
Table 27: Heterogenous impact by CT cleanliness ... 52
Table 28: Heterogenous impact by CT quality ... 52
Table 29: Cost analysis ... 53
Acronyms
BL Baseline
CT Community Toilets
EL Endline
FDGs Focus Group Discussions FU1 Follow-up 1
HH Households
IFS Institute for Fiscal Studies
ML Midline
OD Open defecation pps Percentage points PGG Public Good Game
SCA Structured Community Activity
SS Supply-side
SS+I Supply-side + Information ToC Theory of Change
VCM Voluntary Contribution Mechanism WASH Water, Sanitation and Hygiene WTP Willingness to pay
1. Introduction
While urbanization can bring benefits for economic, cultural and societal development, a rapid pace of urbanization can create enormous challenges. Cities in low and middle-income countries in particular are struggling to keep up with necessary infrastructure investment. Urban slums are a result of the unprecedented rate of urbanization that is leading 40 per cent of the world’s urban population expansion to happen in areas with depressed private and public investment (Marx, Stoker, and Suri 2013). The water, sanitation, and hygiene infrastructure in particular is stressed beyond current capacity. Given that recent evidence suggests that inadequate sanitation is particularly threatening to early-life health when coupled with high population density (Hathi et al. 2017), efforts to improve sanitary conditions in slums are therefore of direct policy relevance.
It is generally accepted that public and community toilets (CTs) will, for the foreseeable future, continue to be an important solution to improve sanitary conditions in slums, given numerous constraints to increasing access to safely-managed private toilets.1 The Joint
Monitoring Program WHO-UNICEF has recently classified CTs in a higher step of the sanitation ladder than private on-site unimproved sanitation solutions (JMP WHO-UNICEF 2017). However, even where CTs are available, open defecation remains common behaviour among slum-dwellers. In India, CTs have been widely introduced in slums, but they are only used by 15% of slum-dwellers. Open defecation remains a common behaviour, practiced by more than half of Indian slum-dwellers without in-house sanitation facilities (Indian Ministry of Home Affairs 2011).
A likely explanation is that CTs are pay-to-use, which might exclude those with low ability to pay, including the poorest of the poor. Advocates of the “public health” approach argue that charging people for basic healthcare is unfair and only reaches the most affluent population (McNeil Jr. 2005; Benn 2006). Studies have shown that charging a small price for other preventative healthcare technologies such as insecticide-treated bed-nets dramatically decreases adoption (Cohen & Dupas, 2010). This is particularly concerning in cases such as toilet use, where negative externalities from non-adoption are severe.
However, charging a price for usage can affect usage through different channels, both positively and negatively. On the one hand, price is a potential carrier of information insofar as it is taken to signal quality or efficacy. For a newly-introduced product on the market, higher prices might signal higher quality and hence, higher prices could increase (or change) use through a higher perception of quality (Ashraf, Berry, and Shapiro 2010). In line with this, Dupas et al. (2016) found that, relative to free distribution of water
disinfectant, a small non-monetary charge increases adoption. In addition, advocates of the “social marketing” approach argue that free goods are not valued and that pricing is a also a powerful tool to promote social beneficial causes and behaviour (Hastings 2007).
1 A community toilet is typically located in or near a specific community area and used by a defined group of users or residents of that community area. Public toilets on the other hand are normally provided for the general public in places such as markets, train stations or other public areas, hence used by mostly undefined users. Shared toilets considered in this setting often combine these two aspects.
On the other hand, a potential effect of fees is to skew the composition of users towards individuals with a greater willingness to pay (WTP) for using the CTs (Roy 1951; Oster 1995). This is known as the “screening effect”. Empirical evidence on water and
sanitation provides mix results. Two field experiments, one promoting latrine construction in rural Cambodia (BenYishay et al. 2016) and another promoting water filters in North Ghana (Berry, Fischer, and Guiteras 2012), found that adoption is not a function of WTP. Ashraf, Berry, and Shapiro (2010), however, found that adoption of water disinfectant increases with household’s WTP. Yet, screening may not be desirable in the case of a public good such as CTs, unless congestion is severe.2
To our knowledge, there is no study identifying the WTP for CTs and analysing its effect on usage (Evans et al. 2014). Overall, empirical evidence has shown that low usage rates have been accompanied by strikingly low willingness to pay (WTP) for in-house on-site sanitation solutions in areas where open defecation is prevalent (Van Minh et al. 2013; BenYishay et al. 2016) and for clean water in areas where water sources are faecally contaminated (Kremer et al. 2009; Ahuja, Kremer, and Peterson Zwane 2010; Jalan and Somanathan 2008; Null et al. 2012). In order to fully understand CTs’ use, it is important to investigate the drivers behind both low WTP and usage.
In this study, we focus on supply-side failures including poor quality of CTs, as well as potential lack of information on the health benefits compared to open defecation. Evidence suggests that poor sanitation infrastructure and quality of the facilities may alter valuation and propensity to use. A study in slums in Bhopal, India, found that 64% of CT users report dirt and smell as the most disliked infrastructure feature. This study further found a positive correlation between facility cleanliness and upkeep and facility usage (Biran et al. 2011). Similarly, a study in slums in Kumasi, Ghana, found that cleanliness is a key determinant for the use of CTs (Mazeau et al. 2014). In line with these observations, a systematic review of 24 studies that examined the association between structural and design characteristics of sanitation facilities and facility use reported that better maintenance, cleanliness, newer latrines and better hygiene access were all frequently associated with higher use, whereas poorer sanitation conditions were all associated with lower usage (Garn et al. 2016). For instance, a number of studies on the use of sanitation facilities in schools found that dirtiness, bad smell, the presence of faeces, absence of door and lack of lock significantly reduce usage (Garn et al. 2014; Caruso et al. 2014; Ness 2015).
It is widely accepted that information provision, for example on the health risks of faecal contamination, may improve perception and behaviour regarding sanitation, water and hygiene. Several studies found a positive impact of the provision of information on sanitation, water and hygiene outcomes. Particularly relevant for this paper is Gertler et al.’s (2015) randomized experiment, which found a positive impact of health promotion campaigns aimed to eliminate open defecation –popularly known as Community-Led Total Sanitation Campaigns (CLTS)— on the use of shared sanitation facilities in rural Indonesia and Tanzania. Likewise, there is evidence that CLTS increases WTP, construction and
2 In an alternative mechanism, low WTP and low use can be both reflecting the underlying preferences associated with the use of CTs. In our setting, if a CT is present, it is assumed (and supported by the data) that individuals gain utility from its use. For this reason, we select for the study only households in high proximity to a CT.
adoption of private latrines and hygienic behaviours (Pickering et al. 2015; Van Minh et al. 2013; Jalan and Somanathan 2008; Luoto, Levine, and Albert 2011; Spears 2014;
Cameron, Shah, and Olivia 2013), even sustainable over time (Cairncross et al. 2005; Wilson and Chandler 1993). Notably, Guiteras, Levinsohn, and Mobarak (2015) found evidence that when poverty and supply failures are binding constraints, information has an impact when coupled with subsidies and supply-side interventions.
The report is organized as follows. Section 2 presents the intervention in detail, while section 3 discusses the evaluation methods and design. Section 4 presents the main findings of the study, while section 5 discusses the cost of interventions. Section 6 presents a discussion of the findings and the lessons learned from the study, while section 7 concludes and provides policy recommendations.
2. Intervention
2.1 Description
The interventions have been implemented in the cities of Lucknow and Kanpur, in the state of Uttar Pradesh, in northern India. Lucknow is the capital city of state, the
eleventh-most populous city and the twelfth-most populous urban agglomeration of India, with a total population of 2,817,105 inhabitants (Census of India, 2011). Similarly,
Kanpur is the 12th most populous city in India, with a total population of 2,767,348 inhabitants (Census of India, 2011).
These two cities are comparable to other growing cities in India and Southeast Asia. In terms of share of population living in slums, Lucknow reaches 13% of its population, while in Kanpur 15% of the population lives in slums (Census of India, 2011). This is relatively lower to other larger cities in India, such as Mumbai (41%), Kolkata (30%) and Chennai (29%), and to other major cities in Asia, such as Dhaka (40%), Colombo (40-50%) or Hyderabad in Pakistan (33%).
India shares many key characteristics with other countries that faces similar challenges of urbanization and low sanitation access. In 2014 for example, GDP per capita in India (1595 USD) is close to that of Sub-Saharan Africa (1773 USD) and Southeast Asia (1515 USD). More specifically, Uttar Pradesh has a comparable poverty rate to the rest of India (28% versus 22%). In terms of population growth there are similarities: in 2014, population grew by 1.2% in India, compared to 1.4% in Southeast Asia, and 2.7% in Sub-Saharan Africa. Life expectancy presents also many similarities among the selected areas and broader regions. Life expectancy in India (66.5 years) is in line with Southeast Asia (66.9), while Ghana (61.1) and Kenya (61.7) are slightly better off than the average in Sub-Saharan Africa (56.8).
We summarize in the next section the main components of the intervention.3
3 During the interventions implemented by the research team, activities of the Swachh Bharat Mission (SBM) were simultaneously implemented. This is a nation-wide campaign in India with the objective to eliminate open defecation through the construction of household-owned and community-owned toilets and establishing an accountable mechanism of monitoring toilet use. The research interventions are randomized, while SBM activities were not randomized, which guarantee homogeneous coverage of these activities by treatment arm. We are not aware of any other WASH interventions ongoing at the time of the intervention.
2.1.1 Supply-side intervention
The aim of the supply-side intervention is to improve the quality of community toilets by releasing resource constraints and incentivising the performance of the CT management. In order to understand how the supply-side intervention was implemented, it is important to explain how the CT management works. There are two main types of management modalities. In one management modality, the CT is managed by the municipality, who hires private contractors to operate a set of community toilets. Caretakers are hired by these private contractors to collect the fees and clean the CT in exchange of a fixed salary and accommodation (they live inside the CT compound). In the other
management modality, the municipality concedes the operation and maintenance of a set of CTs to a social service organization through a public-private partnership lasting multiple decades. These social service organizations have a city manager and several mid-line managers that supervise the performance of CTs in a specific fraction of the city. CTs are operated by caretakers, who are in charge of collecting the fee from users and supervise the cleanliness of the community toilet. The management hires cleaners and provides the necessary tools and products to clean each CT. Notably, the greater the revenue generated by a CT, the greater the resources allocated to it. Caretakers have a monthly fee goal and keep the remaining collected amount as part of their salary. On average, caretakers in both modalities earn Rs. 6,000 per month.
We implemented the supply-side intervention at the caretaker level because of three main reasons. First, caretakers are able to improve the cleanliness of CTs by exerting more effort when cleaning or supervising the cleaner. Second, caretakers can stop users if they refuse to pay for the fee to use the CT. Third, caretakers work only in one CT, contrary to mid-level managers that supervise more than one CT in the study. For sample size and contamination concerns, we do not treat mid-line managers, though we engage the management at the highest level in order to make the implementations of the supply-side intervention feasible. To prevent control caretakers from learning about the intervention, we provide a list to the city managers of all CTs in the study without revealing which CT is allocated to which treatment arm. City managers are informed about the intervention, but are encouraged to not discuss with contractors, mid-line managers and caretakers the different interventions in order to prevent complaints. We executed different components of the supply-side intervention in a phased-in design in order to disentangle differential effects. We started by implementing a Grant Scheme, followed by the announcement and payment of a Financial Reward Scheme.
CT Grant Scheme
The supply-side intervention started with the Grant Scheme aimed at improving the quality of the CTs. We hypothesize that resource constraints prevent caretakers from improving cleanliness and maintenance of CTs, and hence, an initial push could allow them to take the CT quality to a higher level. The idea is to break a vicious cycle in which low quality of CTs generates low WTP and usage and this in turn generates low revenue and resources to operate and maintain the CT.
We conducted two visits right after the baseline survey. In the first visit, the CT caretaker(s) had the opportunity to choose a type of aid according to their needs and expectations of increasing user traffic (hence more resources for the CT). The grant scheme offered three standardized (i.e. same monetary value) packages from which the
caretaker could select one: (i) deep cleaning (i.e. septic tank sewage removal,
unclogging latrines and sewerage pipes and cleaning walls, floors and inside toilets), (ii) sanitation/water connection repairs and/or infrastructure refurbishment or (iii) cleaning tools and agents and cleaning training. For CTs that selected repairs or deep cleaning, pictures of the CT area to be improved were taken before the work was done. Also, in this visit, a date for the works to be conducted was set. Based on this information, our partner FINISH arranged the work with an external contractor. To keep consistency in the works, we used the same contractor in all CTs.
During the second visit, the contractor developed the work under the supervision of FINISH. Pictures of the improved areas were taken after the work is done. Figure 1 shows an example before and after a deep cleaning of a CT in Lucknow. For CTs that selected training and cleaning tools, the second visit consisted of two sessions: theory and practice. In the theory session, FINISH explained why the CT should be frequently cleaned, which frequency, at which hours, using which tools and products and how the cleaning should be done. For this, FINISH used flipcharts with cartoons and relevant messages. In the practical session, the caretakers and cleaners had to accomplish cleaning tasks under the supervision of a trainer that provided feedback. In addition, FINISH endowed the CTs with several tools and cleaning products, including: 4 hand-gloves, 5 floor cleaners, 4 toilet disinfectants, 5 liquid soap, 4 toilet cleaning brush, 2 wipes, 4 nose masks, 2 brooms, 2 buckets and mug set, 3 surf-ghadi, 2 hand-washing dispensers, 2 dustpans and 2 dustbins.
Figure 1: Example of before and after a deep cleaning of a CT in Lucknow
Source: Picture taken by the team as part of the tracking application.
CT Financial Reward Scheme
We introduced a Financial Reward Scheme in order to promote a sustained maintenance and cleanliness of CTs. Two months after baseline and after the completion of the Grant Scheme works, we announced the Financial Reward Scheme aimed at incentivizing caretakers to maintain the CT clean. Caretakers could receive a financial reward conditional on achieving the following:
- availability of soap in hand-washing facilities for both genders; - cubicles free of visible faeces (inside and outside the latrines);
- bacteria count in defecation cubicles kept to a minimum standard (computed as below the median of the demeaned baseline distribution by city).
Achieving (i) and (ii) paid Rs. 500 and achieving (iii) paid Rs. 1000, so the maximum amount a caretaker could receive was Rs. 2000, representing a third of a monthly salary. We provided a greater pay-off for reducing bacteria because this is a harder task to comply. Caretakers were informed that an external agent was going to return to measure each condition on a random day and time within the following two months. We informed caretakers that we would pay the financial reward depending on what the external agent measured. In CTs with more than one caretaker, the financial reward was split among them.
At this point, we also informed CT caretakers of their baseline cleanliness performance to help them estimate the additional effort they had to exert in order to achieve the conditions. The literature highlights the fact that individuals may go through a variety of seemingly irrational behaviours when informed about their past performance in order to cope with failure –from handicapping their own future performance to practicing self-deception through selective memory or awareness (Benabou and Tirole 2002). Yet, this is more prevalent when external rewards are based on rankings (Ashraf, Bandiera, and Lee 2014). Furthermore, if financial rewards are based on improvements from past performance, individuals may behave strategically (Muralidharan and Sundararaman 2011), performing badly in initial rounds in order to achieve greater pay-offs in the future. Therefore, our financial reward scheme is linked to individual performance, not relative to others’ performance, and works for each round independently.
After two months and every two months from then on, we measured each of the
conditions and paid accordingly. In each round, we announced that a new round will take place and we reminded the caretaker(s) of the conditions of the Financial Reward
Scheme. In total, we paid four rounds of financial rewards.
The incentive scheme may create some multi-tasking problems4 (Neal 2011) and may
crowd out intrinsic motivation (Besley and Ghatak 2005; Benabou and Tirole 2003). To measure the extent of a multi-tasking problem, we collect detailed data on time allocation and cleaning practices. In addition, we measure CT cleanliness relying on observations as well as a precise measure of bacteria counts in randomly selected areas of the toilet compound and cubicles. To measure the extent of a crowding-out in intrinsic motivation, we measured pro-social preferences through several rounds of a dictator game in which caretakers can donate to a sanitation project.
2.1.2 Information campaign
For selected CTs, the supply side intervention is complemented by an information campaign. We hypothesize that information and supply-side nudges can interact in a positive way to increase the WTP and use of CTs and the demand for CT cleanliness. The primary aim of our information campaign is to create awareness of health risks of open defecation to their family (private) and the neighbours of their community (public). We provided information on the pathways (i.e. 4 Fs –fingers, flies, fluids and fields)
4 Assuming that agents engage in two types of tasks, one that follows best practices and another aimed to increase the imperfect performance observed by the principal, the introduction of incentives may create distortions in the allocation of effort. Caretakers may, for example, clean the same number of hours, but throw water everywhere to make the CT look clean, instead of using disinfectant.
through which open defecation can cause infectious diseases, stunting and even death in family members and neighbours. Furthermore, we provided information on the
relevance of ensuring females’ safety and the importance of male household members to accompany females when using CTs, particularly at night.5 Moreover, we provided
information on the benefits of using CTs and the importance of guaranteeing that everybody pays the CT fee to achieve a sustainable operation and maintenance. In addition, we emphasized the rights of users when paying fees and encourage users to demand the CT management clean and well-maintained toilets.
We targeted all household members, especially household heads and spouse. We paid particular attention in providing information that can be processed by participants with low levels of literacy. We provided information through four means:
(i) Door-to-door information campaign using a flipchart with cartoons and messages targeted to all household members, especially household heads and spouse. This information session covered the following sections: how open defecation affects your community; how open defecation affects your family; benefits of using community toilets; what can you and your family do to make the CT better; your rights when you pay the fee for using the CT. Figure 2 captured the moment in which one of our enumerators provided the door-to-door information campaign to a family in Lucknow;
(ii) Circulation of leaflets with a summary of the flipchart;
(iii) 5 posters (3 medium size and 2 large) placed in each CT using catchy phrases and Bollywood memorable scenes, highlighting messages provided during the door-to-door campaign;
(iv) Monthly reminders in the form of voice messages sent to mobile phones. Figure 2: Example of Information campaign provided to a family in Lucknow
Source: picture taken by the team as part of the supervision of pilot activities.
5 Qualitative evidence conducted by the research team before the baseline highlighted the constraints faced by household members in relation to sanitation practices. There were very gender specific. In-house/dwelling (makeshift) toilets are used by female members, thereby reducing their need to leave the house when it is dark. Clearly, women might still decide to move for other reasons.
Figure 3 shows the timeline of our intervention. In the upper side, we present the time-line of the supply-side intervention.
Figure 3:Timeline of intervention and survey rounds
The CT Grant Scheme took place during the first two months of the study – between June and August 2018. Two months after, we announced the Financial Reward Scheme. From month 6 and every two months until the end of the study, we paid the financial reward to those CTs that achieve the conditionality. The last payment of the financial reward (payment 4) was done after the end-line survey, at the end of the study – August and September 2019. The lower side of the figure shows the timeline of the information campaign. In months 0, 2 and 6 we conducted the door-to-door campaign, using
flipcharts and leaving summary leaflets to household members. Between month 1 and 11 of the study, we sent monthly voice messages –a total of 10 rounds of voice message. Figure 3 also shows the timeline of our data collection (please refer to the boxes at the bottom). Section 3.4.2 explains in detail the timeline of the collection of primary data.
2.2 Theory of change
This study is based on the following three status quo considerations, which represents the assumptions behind the presented theory of change:
(i) Open defecation has significant health implications. Health benefits from improved sanitation and the eradication of OD are estimated to be substantial (Prüss et al., 2002). Epidemiological research has found that chronic
environmental exposure to faecal germs is one of the main causes of the prevalence of infectious diseases in low- and middle-income countries (LMICs). The pathogens that cause these diseases are transmitted through several pathways summarized in Wagner and Lanoix’s F-diagram (1958) presented in Figure 4. Pathogens are transmitted from faeces to the host via fluids (drinking water), fields (soil), flies (anthropods) and fingers (hands), who enter orally directly or through the ingestion of food. Primary barriers, such as safe disposal of faeces through adequate sanitation facilities, and secondary barriers, such as
Announced Payment 1
0 2 4 6 8 10 12
CT GRANT FINANCIAL REWARD SCHEME
Payment 2 Payment 3 Payment 4
HH Info HH Info HH Info
M M M M M M M M M M
Jun. Sept. Nov. 2019 Jan. Mar. May Jul. Sept.
Baseline Lucknow: Mar-May 18 Kanpur: Apr-June 18 HH rapid assessment and CT U&M FU1 Lucknow: Jul-Aug 18 Kanpur: Aug-Sept 18 CT U&M FU2 Lucknow: Oct 18 Kanpur: Nov 18 HH Midline and CT U&M FU3 Lucknow: Jan-Feb 19 Kanpur: Feb-Mar 19 CT U&M FU4 Lucknow: Apr 19 Kanpur: May 19 HH Endline and CT U&M FU5 Lucknow: Jul-Aug 19 Kanpur: Aug– Sept 19
drinking water and adequate hygienic practices, allows the isolation of feaces so that infectious agents cannot possibly get to a new host. The F-diagram predicts that if the feacal pathogens do not infect new hosts, child death and stunting in survivor children can be prevented.
Drinking water is one of the main pathways though which open defecation affects the health of slum dwellers in India. Two main facts support this argument. Firstly, water contamination at point-of-use is significantly higher than at source, implying that a large degree of contamination happens after water is taken from the tap. In fact, while about 70% of Indian slum dwellers have access to tap water (Census 2011), only 46% have access to tap water within the premises they live in. 28% have to walk 100 meters or more to collect water from a tapped source.
Secondly, as a result of the poorly maintained water infrastructure and supply shortfalls, water pipes with cracks suck in faecal matter when resuming water supply. In fact, no Indian city has continuous piped water. A Service Level Benchmarking Program, initiated by the Ministry of Urban Development (MoUD) in 2006, found that the average duration of water supply in 28 Indian cities was 3.3 hours per day.
(ii) The slum-dwellers’ WTP for CT use and demand for cleanliness is low, and this explains low rates of CT use among potential users, leading to open defecation as the only alternative for many slum dwellers. The government of India, along with NGO’s and the private sector, has expanded the coverage of CTs during the last decade. However, even where CTs are available at a relatively close
distance, open defecation remains common behaviour among slum-dwellers. This phenomenon is likely explained by a low willingness-to-pay for CTs that are pay-to-use. The fee –standardized at 5 rupees per usage— may be screening out those with low willingness to pay and those with low ability to pay, including the poorest of the poor. This is known as the “screening effect” (Ashraf, Berry, and Shapiro 2010).
(iii) Public, non-profit and private organizations working on sanitation access are essential actors in creating and implementing solutions that pursue SDG #6: Ensure availability and sustainable management of water and sanitation for all. Therein, we assume that appropriate guidance on what constraints are important to address sanitation challenges and which different intervention approaches are effective, can increase short and long-term wellbeing of their beneficiaries. Figure 4: How open defecation affects health
Source: adaptation from Wagner & Lanoix (1958). OD Fluids Fields Flies Foods Disease Fingers Primary barrier
(sanitation) (water treatment and Secondary barriers hygienic practices)
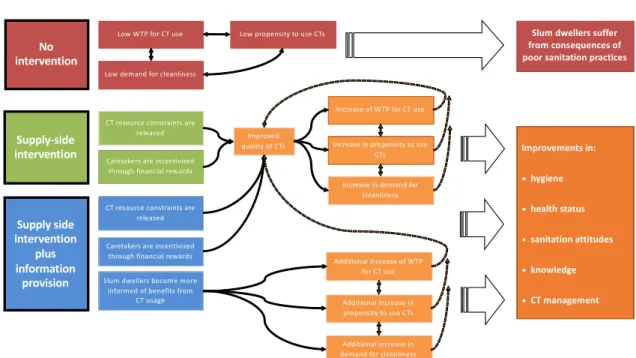
Death
The theory of change is summarized in Figure 5. We have identified interventions that seek to improve sanitation behaviour in urban slum settlements, by improving the supply side – more specifically by improving the quality of existing CTs – accompanied by providing information about the risks associated with open defecation and the benefits and rights when paying for using CTs.
Figure 5: Theory of Change
The assumption that we can affect usage behaviour and related WTP through (i) the improvement of the quality of community toilets, and (ii) the provision of information, is based on the following rationale:
(i) The improvement of the quality of community toilets. A study by the Water and Sanitation Program of the World Bank (2016) identifies the lack of
cleanliness and poor up-keep and lack of proper disposal facilities as the main constraints to use. Although an observed deficiency may not be a key deterrent for use, other studies identify cleanliness as an important determinant of usage. Biran et al. (2011) and a related project report by Mahon (2010) for example analyse patterns and determinants of communal latrine usage in urban poverty pockets in Bhopal, India. They find that by far most disliked feature of CTs was dirt and smell, as mentioned by 64% of users. The second most staged reason was queuing (19%), followed by lack of water (11%). In line, they find a positive association of the proxy variable for CT cleanliness/upkeep and usage. This generates the following three hypotheses:
a. Releasing resource constraints improve the quality of CTs.In general, the quality of CTs is precarious and this is due to a vicious cycle. Most CTs face resource constraints to generate substantial improvements because usage and related revenue are not high enough. In addition, the centrally managed system that redistributes all resources suffers from inefficiencies. Caretakers are not endowed on time with the necessary tools and agents or aid for repairs, even after repeated requests to the management. Releasing
resources constraints to improve cleanliness and maintenance should result in a visible improvement in quality.
Supply side intervention plus information provision Supply-side intervention
CT resource constraints are released Improvements in: • hygiene • health status • sanitation attitudes • knowledge • CT management No intervention
Caretakers are incentivized through financial rewards
Improved quality of CTs
Increase of WTP for CT use
Increase in propensity to use CTs
Increase in demand for cleanliness Additional increase of WTP for CT use Additional increase in propensity to use CTs Additional increase in demand for cleanliness Slum dwellers become more
informed of benefits from CT usage CT resource constraints are
released
Caretakers are incentivized through financial rewards
Low WTP for CT use Low propensity to use CTs
Low demand for cleanliness
Slum dwellers suffer from consequences of poor sanitation practices
b. Providing financial rewards to caretakers improve the quality of CTs. Sustaining
the improvement obtained by releasing resource constraints depends on the effort exerted by caretakers to operate and maintain the CT clean. Therefore, we further postulate that extrinsic incentives can play an important role in
determining the investment in the quality of the CT by caretakers. There is evidence that extrinsic rewards may affect positively performance on pro-socially motivated tasks, as soon as they are announced and specifically when incentive schemes are linked to own performance (Ashraf, Bandiera, and Jack 2014; Ashraf, Bandiera, and Lee 2014). We thus expect financial rewards to increase effort and this to be translated into noticeable improvements in cleanliness. c. Supply-side improvements increase WTP for CT use, the propensity to use CTs
and the demand for cleanliness in the short term.Improvements in the quality of the CT can increase the slum-dwellers’ value of the CT and the demand for such standard. Yet, beyond the conscious channel, quality improvements can serve as nudges that positively affect sanitation practices. There is evidence that people make biased assessments of values, which are affected by the context in which they make decisions. Changes to sanitation habits such as usage of community toilets can be automatically triggered by context cues and small nudges,
including changes in physical setting (Wood, Tam, and Witt 2005). Therefore, we expect supply-side improvements such as cleanliness and better infrastructure maintenance to increase the WTP for and usage of CTs and the demand for CT cleanliness. Nevertheless, evidence also suggests that supply-side
improvements could also lead to unexpected results, especially in presence of behavioural responses in their target population. In fact, public investments can discourage (or crowds-out) private investments, therefore leading to negative impacts of public investments (see, for instance, Peltzman, 1973, and Cutler and Gruber, 1996). For developing countries, evidence of this mechanism has been observed for investments in education (Das et al., 2011), in sanitary behaviour (Bennett, 2012), and anti-malaria behaviour (Armand et al., 2017).
(ii) The provision of information. The assumption that WTP and usage can be moved through the provision of information is based on several studies related to water, hygiene and sanitation. For one, there is robust evidence that information provision about the quality of water significantly impacts behaviour in terms of purifying water (Jalan and Somanathan, 2008; Madajewicz et al., 2007; Luoto; 2009). Second, an experiment in rural India shows that deliberation about the usefulness and price of soap increases price sensitivity significantly (Spears, 2014). And third, more specific to sanitation, are studies that demonstrate that knowledge about the link between poor sanitation and disease is a significant predictor of willingness-to-pay for household-level toilet facilities (Minh et al, 2013). We bring forward the following hypothesis. Combining supply-side improvements with the provision of information increases WTP for CT use, the propensity to use CTs and the demand for cleanliness in the short term by more than supply side improvements on their own. Based on evidence that information provision can shift WTP for health investments such as soap and water (Jalan and Somanathan, 2008; Madajewicz et al., 2007; Luoto; 2009; Spears, 2014) and adoption of shared sanitation facilities (Gertler et al. 2015), we postulate that information and supply-side nudges can interact in a positive way to increase the WTP and use of CTs and the demand for CT cleanliness.
Our metric for defining these interventions as successful considers short and long-run impacts separately. In the short-run, we classify the interventions as effective is we observe increases/improvements in our primary and secondary outcomes. In particular, we define the following primary outcomes: WTP for CT usage; CT usage (i.e. improved sanitation behaviour, accompanied by a decrease in open defecation); demand for cleanliness; and CT quality. Our secondary outcomes are: hygiene; health status; sanitation attitudes, expectations and knowledge; and CT management. Detailed information on the primary and secondary outcomes is provided in the Results section within 4.2.2. Research analysis.
Supply-side improvements alone and with the provision of information can result in long-run effects on WTP for CT use, the propensity to use CTs and the demand for
cleanliness. In order to reach long-run effects, we assume that short-run effects can be
sustained, i.e. that participants will not revert to the status quo WTP and valuation of improved sanitation in the short-term, and second, we assume that intervention participants will modify not only their own behaviour, but will also encourage their household, neighbours and kin to adapt. This latter point is particularly important when considering the role of parents in determining their children’s exposure to risk.
A possible negative externality of such a success would be congestion, and possible difficulties in keeping improved standards due to higher usage. This aspect was
monitored throughout the study, so that implementing partners have relevant information to act upon. A potential unsuccessful outcome would include a decrease in investment or protective practices as a result of information that ambiguously portrays risk and
potential health costs, or perhaps decreases expected returns from current investments.
2.3 Monitoring plan
We conducted efforts on the field to monitor two components of the project: (i) the implementation of the intervention; and (ii) the data collection.
In order to monitor the implementation of the intervention, a series of mobile phone apps were designed purposely for the implementation and supervision of the intervention. The apps were designed in conjunction with the research team, Morsel and FINISH. These tracking apps allow us to identify treatment fidelity.
The CT tracking app is used by FINISH and captures whether the intervention was provided, the date, details of the participants that were exposed to the intervention and the contact details of the respondent signing the consent form. Furthermore, we captured extra details from the caretaker (e.g. choice, availability, satisfaction) and pictures from the community toilet to visualize outputs of the intervention. For example, we cross-checked with pictures collected in the tracking app if the deep cleaning was actually conducted. Before and after pictures of the same area cleaned allowed us to monitor the work. Furthermore, we include a confirmation form that needs to be signed by the
caretaker indicating if the CT received the intervention. In addition, we took pictures of the invoice signed by contractors and a representative of FINISH for each work done at a CT. Finally, the app captures if the CT has each of the 5 posters, in which condition they are and if replacement is needed.
The implementation of the information campaign is captured in a separate app used by Morsel. The app is pre-populated to indicate if a household should receive the
information campaign and records whether the flip-chart was explained and the attitude of the participants while the information was provided. Furthermore, it captures whether the leaflet was provided to the household.
Finally, the implementation of the voice message was recorded in an especially designed tracking app. This tracking app is pre-populated with all mobile phones and message categories to be sent in each round. The tracking app records whether the voice call was answered and the minutes it was answered before the call finished.
For the monitoring of the data collection on the field, we had 4 layers of supervision: (i) 3 field supervisors of enumerators; (ii) 1 main supervisor of the field supervisors; (iii) 1 project manager; and (iv) the London base team. After training was conducted, the data quality was checked regularly from the piloting until the final collection By the project manager based in Lucknow and the research team based in London. Identified errors were rectified on the spot in the data collection application. If necessary, enumerators went back to re-collect data or collect data missing by mistake.
3. Evaluation
3.1 Primary and secondary questions
The primary research questions are:
• What is slum-dwellers’ WTP for CT usage? And does WTP affect CT usage (evidence of a screening effect)?
• Can the releasing of resource constraints and provision of financial incentives to caretakers improve CT quality?
• Can improvements in CT quality increase slum-dwellers’ WTP, usage and demand for cleanliness?
• Is the effect of CT quality improvements on WTP, usage and demand for cleanliness greater when also providing slum-dwellers with information about health risks of open defecation, as well as benefits of CTs and users’ duties and rights when paying the CT fee?
• Do the interventions have longer-run effects on WTP, usage and demand for cleanliness?
The secondary research questions are:
• Can the release of resource constraints and provision of financial incentives to caretakers improve the management of CTs?
• Can improvements in CT quality improve attitudes towards adequate sanitation practices as well as knowledge and expectations of health benefits? Are these effects greater when providing information about health risks of open defecation, as well as benefits of CTs and users’ duties and rights when paying the CT fee? • Can improvements in CT quality improve the hygiene practices and health status
of slum dwellers? Are these effects greater when providing information about health risks of open defecation, as well as benefits of CTs and users’ duties and rights when paying the CT fee?
3.2 Design and methods
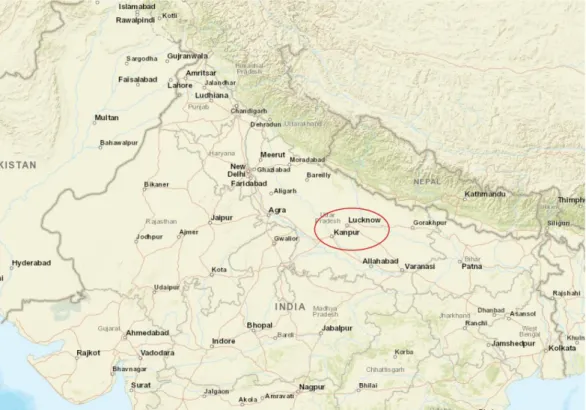
We address primary and secondary research questions in the context of Indian slums in the cities of Lucknow and Kanpur (Uttar Pradesh, India) using a randomized-controlled trial (RCT) design.6 Figure 6 shows the study area.
Figure 6: Study location
Note. Lucknow and Kanpur are the two selected cities for the experiment; both are based in the Indian State of Uttar Pradesh. Base-map source: ESRI.
We randomly selected 110 catchment areas of CTs in both cities and we allocated them to one of three experimental arms. As discussed in Section 3.4.1, we have explicitly removed CTs that could also be interpreted as public toilets, which led to a total of 110 CTs in the population used for randomization. Randomization into the treatment arms was carried out at the cluster level, specifically the CT catchment area level. We provide more detail on the definition in the next section. Randomizing at the cluster level has the advantage to limit contamination of the control group, especially considering the possible spread of information. To allocate clusters to treatment arms, we stratified the sampled clusters by the main organization managing CTs in our study area (versus other
organizations) and by city of study (Lucknow and Kanpur). We then build blocks of 3 CTs using m-distance (Mahalanobis) relative proximity. To construct m-distances, we used the rich census information we collected, including CT and slum-dweller characteristics. After forming blocks of similar clusters (CTs), we randomly allocated each CT in a block to either treatment 1, treatment 2 or the control group. Each one of the three possibilities has the same probability. The statistical software Stata, and specifically the random number generator, is used to apply this procedure.
Catchment areas were allocated to one of these three groups:
A. Control. Participants in this group did not receive supply-side nor information interventions.
B. Treatment 1 (Supply-side intervention). In this treatment group, cleanliness and maintenance of CTs was promoted by introducing a Grant Scheme offering standardized (i.e. same monetary value) packages including either (i) deep cleaning (i.e. septic tank sewage removal, unclogging latrines and sewerage pipes and cleaning walls, floors and inside toilets), (ii) sanitation/water connection repairs and/or infrastructure refurbishment or (iii) cleaning tools and agents and cleaning training, from which CT caretakers can choose according to their needs and their expectations to increase usage. In addition, two months after baseline, we announced a Financial Reward Scheme aimed at incentivizing caretakers to keep the CT clean. At this point, CT caretakers were informed of their baseline cleanliness performance. After two months (and every two months from then on), caretakers received a financial reward conditional on achieving the following: (i) availability of soap in hand-washing facilities; (ii) latrines free of visible faeces; and (iii) bacteria count in defecation cubicles kept to a minimum standard (to be computed from the baseline distribution).
C. Treatment 2 (Supply side intervention plus information provision). In this treatment arm, the supply side intervention (as described under point B) was complemented with a household-level information provision component. Participants in this group received information about private (family) and public (community) health risks of open defecation. Furthermore, we provided
information on the relevance of ensuring females’ safety and encouraged male household members to accompany females when using CTs, particularly at night. In addition, we provided information on the benefits of using CTs and the importance of ensuring that everybody pays the CT fee. We put emphasis on providing information on the rights of users when paying fees, including clean and well-maintained toilets, as well as promoting users to demand maintenance and cleanliness of CTs. This component targeted all household members,
especially household heads and spouse, and was designed such that information could be processed by participants with low literacy. We provided information in four forms. Firstly, a door-to-door information campaign using a flipchart with cartoons and messages. Secondly, by leaving a leaflet with a summary of the flipchart to households visited during the surveys. Thirdly, by placing posters in the CT, highlighting messages provided during the door-to-door campaign. Fourthly, by sending monthly reminders in the form of voice messages to all mobile phones collected in the household. To disentangle the effects of receiving voice messages, all treatment arms received voice messages without new information (specifically stating that the community toilet is open from early morning until late evening). Households allocated to the supply-side treatment additionally received voice messages informing that the community toilet has been granted aid to improve its service.
3.3 Ethics
The study has obtained ethics approval from the University College London Research Ethics Committee (REC) on March 23rd 2017 until December 31st 2020 (ethics
application code is 2168/012). Changes to the design and data collection were approved in May 2018. The trial and the pre-analysis plan have also been registered with the AEA RCT Registry. The registry number is AEARCTR-0003087.
3.4 Sampling and data collection
3.4.1 Sampling
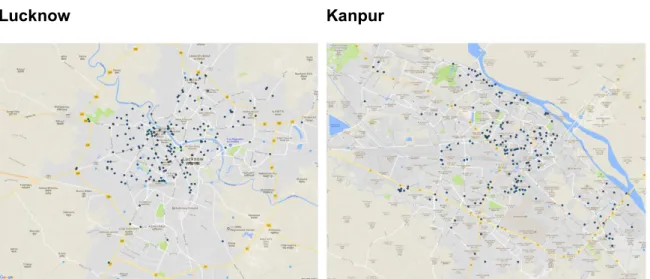
This study performs a two-level randomization design and therefore, we are interested in two different level of the sampling frame. The first level of the sampling frame is defined by all community toilets (CTs) in the cities of Lucknow and Kanpur. In order to obtain this sampling frame, we performed a CT census in both study cities. This census collected GPS coordinates and information on ownership, management, location, problems (i.e. dirty, stinky, observed faeces and flies, unsafe, non-functional), service (i.e. opening times and lightning availability), infrastructure characteristics (i.e. year of construction, number of toilets by gender, doors and locks functionality, hand-washing and showering facilities, quality of walls and floors, type of sanitation facility) maintenance activities (number of staff, cleaning frequency, cleaning tools), users (type and main users), catchment area (distance users come from) and fees (methods and fees). We identified at total of 409 CT. Figure 7 presents the distribution of CTs in Lucknow (left map) and Kanpur (right map).
Figure 7: CT Sampling Frame
Lucknow Kanpur
Note: The dots denote the geo-location of all community toilets identified in Lucknow and Kanpur through our Community Toilet Census. Base-map source: ESRI.
The second-level sampling frame is characterized by all households in the catchment areas of selected community toilets (which represents a cluster). Out of the 409 CTs identified in the first stage, we chose a subset of CTs to become part of the study, based on the following criteria: the CT has to be pay-to-use; the CT has to be located close to a residential area (slum) and used by residents. We drop CTs for which the distance to another CT is below a certain threshold. In particular, there should be sufficient distance between two CTs to avoid users switching between CTs (possibly driven by their
treatment status). We drop CTs that are closer than 300 meters to each other, and CTs that have two other CTs closer than 350 meters. In addition, we drop CTs in whose catchment areas fewer than eight eligible households are living. A household is considered eligible if the following conditions are respected: the household lives in the
catchment area of a selected CT, which is broadly defined as slum area within 250 meters from the CT building. Households are linked to CTs based on geo-coordinates collected during the census;7 at least one household member uses a CT or shared toilets
(i.e. neighbours, makeshift, work, school), or practices open defecation; the household must have reported during the census interview not to intend to migrate during the following 18 months (i.e. until the planned study endline survey). This selection criteria result in 110 CTs selected for the study. Table 1 shows the distribution of CT catchment areas by treatment arm and city.
Table 1: Number of CT catchment areas per treatment arm and city
Control Supply-side (SS) SS + Information Total
Lucknow 19 (36.5%) 17 (32.7%) 16 (30.8%) 52 (100%)
Kanpur 21 (36.2%) 18 (31.0%) 19 (32.8%) 58 (100%)
Total 40 (36.4%) 35 (31.8%) 35 (31.8%) 110 (100%)
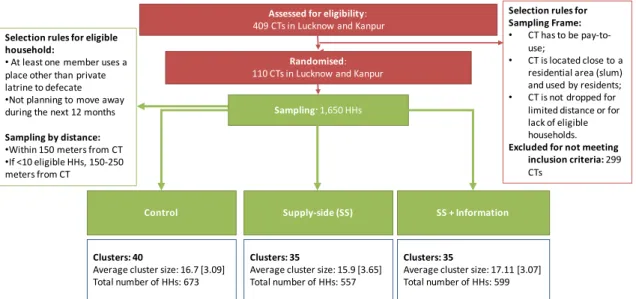
Figure 8 shows the flowchart for the CT and household sampling procedure. Within each of the 110 CTs and their catchment areas, we sampled up to 17 eligible households. Given that distance is a major determinant of CT usage, we focused on eligible households living closer to the CT (within 150 meters). Since some CTs have more dispersed populations, we conducted a two-step sampling procedure. First, in large-population catchment areas (where 10 or more eligible households are available within 150 meters), we sampled only from eligible households that are located within this bound. Second, in small-population CTs (where less than 10 eligible households are available within 150 meters), we first sampled all eligible households within 150 meters and then randomly selected the remaining households from those that are located between 150 and 250 meters from the CT. In total, we sampled for interview 1,650 households in 110 randomization units (catchment areas of CTs) and one CT caretaker per randomization unit.
7 A small percentage of households with inaccurate geo-coordinates (missing geocodes or distance to closest community toilet greater than the 400 meters buffer area set for household census) were linked to the community toilet located in the slum (0.7 percent in Lucknow and 1.6 percent in Kanpur). In these cases, we imputed the distance to the community toilet using the median of eligible households in the slum.
Figure 8: Flowchart for the sampling procedure
Note: The flowchart presents the procedure followed for the sampling of community toilets and its catchment area.
3.4.2 Data collection
We distinguish between quantitative instruments, behavioural measurements and laboratory tests. shows the timeline of the study, including the data rounds. Quantitative instruments
The quantitative data sources used in the study are the following:
1. CT census. The purpose is to obtain a mapping of CTs in Lucknow and Kanpur, together with the distribution of slums close to these CTs; understand how many there are, and how they are distributed, who uses the CTs (from the community, passers-by, workers, etc.), their characteristics, management structure, payment, among others. The scope is of 409 CTs identified in Lucknow (201) and Kanpur (208). The instrument was administered to CT caretakers and/or supervisors. The census includes collection of GPS coordinates. Timing was March-July 2017. 2. Household census. The main purpose is to identify our sample of eligible
household respondents. The household census covered households located within slum borders and 400 meters from each of the 144 pre-selected CTs (i.e. pay-to-use, used by residents and not close to another CT within 200 meters). The questionnaire collects household demographics (number of members and gender primarily) and dwelling characteristics as well as sanitation practices (focusing on toilet ownership, CT usage and open defecation practice). The household census also collects GPS coordinates. Timing was August 2017-March 2018.
3. Baseline (BL) survey. This is a standard baseline survey, collecting information on socio-demographics as well as dwelling characteristics, assets, income and expenditure. In addition, we collected baseline information on health status and sanitation and hygienic behaviour and priors, attitudes and health expectations linked to open defecation and CTs. Sanitation behaviour was measured by
Assessed for eligibility:
409 CTs in Lucknow and Kanpur
Randomised:
110 CTs in Lucknow and Kanpur
Sampling: 1,650 HHs
Control Supply-side (SS) SS + Information
Selection rules for Sampling Frame:
• CT has to be pay-to-use;
• CT is located close to a residential area (slum) and used by residents; • CT is not dropped for
limited distance or for lack of eligible households.
Excluded for not meeting inclusion criteria: 299
CTs
Clusters: 40
Average cluster size: 16.7 [3.09] Total number of HHs: 673
Clusters: 35
Average cluster size: 15.9 [3.65] Total number of HHs: 557
Clusters: 35
Average cluster size: 17.11 [3.07] Total number of HHs: 599
Selection rules for eligible household:
• At least one member uses a place other than private latrine to defecate •Not planning to move away during the next 12 months
Sampling by distance:
•Within 150 meters from CT •If <10 eligible HHs, 150-250 meters from CT