MASTER IN FINANCE
THIS REPORT WAS PREPARED EXCLUSIVELY FOR ACADEMIC PURPOSES BY PEDRO SANTOS, A MASTER IN FINANCE STUDENT OF THE NOVA SCHOOL OF BUSINESS AND ECONOMICS.THE REPORT WAS SUPERVISED BY A NOVA SBE FACULTY MEMBER, ACTING IN A MERE ▪ We initiate our Iberdrola’s coverage with a BUY rating.
Currently trading at € 7.01, we believe the market is not satisfactorily valuing Iberdrola’s strategic plan (2018-2022) developments and the reduction of regulatory uncertainty in Spain. ▪ Reduction of regulatory uncertainty in the domestic market. Deriving from an expected change in the way regulated returns are calculated and recent developments regarding the price cap to be applied to hydro and nuclear energy production. ▪ Ambitious strategic plan being delivered on time. Recent updates indicate Iberdrola’s strategic plan for the upcoming 4 years (2018-2022) is going as planned, with several projects ahead of schedule.
▪ Multiple risks to be considered. Risks surrounding the valuation include exchange rates uncertainty, effects from political instability in the UK and possible regulatory adjustments.
▪ The valuation weighs a bull and a bear scenario. Our price target of € 7.31 considers a possible improvement of Brazil’s economic situation, as an upside, and the implementation of hydro and nuclear price caps, by the Spanish government, as a downside.
Company description
Iberdrola, based in Spain, is the second largest utility company in Europe. It operates in all stages of the energy sector. From generation, to transmission and distribution, to supplying the final consumer. It has a significant international exposure to the European, North American and Latin American markets.
I
BERDROLA
C
OMPANY
R
EPORT
U
TILITIES
04
J
ANUARY2018
S
TUDENT
:
P
EDRO
S
ANTOS
[email protected]
Building the future
Strong pipeline and reduced regulatory uncertainty
Recommendation: BUY
Price Target FY19: 7.31 €
Upside Potential 10%
Price (as of 3-Jan-19) 7.01 € Reuters: IBE.MC, Bloomberg: IBE SM
52-week range (€) 5.71-7.17 Market Cap (€m) 44,899 Outstanding Shares (m) 6,398 30-Day Average Volume (m) 22.64 Source: Bloomberg
Source: Bloomberg
(Values in € millions) 2017 2018E 2019F Revenues 31,263 31,044 32,818 EBITDA 7,319 9,693 9,882 Net Profit 2,804 3,417 3,282 EPS 0.44 0.54 0.53 P/E 14.7 13.0 13.8 Dividend Yield 4.5% 4.8% 5.1% Payout Ratio 73% 64% 71% Source: Company data and Analyst’s estimates
IBERDROLA COMPANY REPORT
Table of Contents
Executive Summary……….3
Company Description……….……4
Shareholder Structure……….…...5
Leverage Analysis………..….5
Strategic Outlook………...……..6
Macroeconomic Profile………...8
Economic Profile………...8
Political Situation………..9
Energy Sector………...10
Electricity Demand………...10
Power Prices in Iberia………..…….11
Business Forecast………...……12
Networks………..12
Generation & Supply………..15
Renewables……….18
Valuation……….21
Cost of Capital……….21
Sum-of-the-parts……….22
Multiples Comparison………....23
Alternative Scenarios………...24
Sensitivity Analysis………....25
Appendix………26
IBERDROLA COMPANY REPORT
Executive summary
Iberdrola, based in Spain, is the second largest utility company in Europe by market capitalization, with a significant presence in Spain, USA, United Kingdom, Brazil and Mexico. Most of the value comes from the highly regulated Network business, although the Renewables segment has been growing in importance. In our valuation, one factor we believe the market is not fully considering is the recent reduction of the regulatory uncertainty affecting the domestic market. Contributing to this, is the recent push from the Spanish Networks regulator (CNMC) to move the regulatory return from the existing bond-linked model to a WACC-based model. Although still pending approval from the Ecological Transition Ministry, we believe this to be very probable because Spanish 10Y bond yields have been decreasing over time, the new remuneration scheme is connected to the real cost of capital, and the new model is being followed successfully in other European countries. Coupled with this, we expect the price cap planned by the Spanish government on hydro and nuclear to be highly unlikely to move forward, as the PSOE party is a minority and the move would put at risk the system’s ability to satisfy electricity demand.
Additionally, we believe that Iberdrola will be able to fully deliver its strategic plan for 2018 to 2022. The recent updates were very satisfactory, several projects are ahead of the initial schedule and the planned growth in RAV is being observed. Although we acknowledge there are various risks to be considered. Namely, the acceptance of the WACC-based model, although with a lower allowed return than the figure proposed by CNMC. Also, the occurrence of a No-Deal Brexit that could cause a slowdown of the economy and the pound to depreciate. And, at last, an adverse movement of some other key currencies against the €, that would have a negative impact on cash flows.
Based on our view that the market is not statisfactorily considering the above information, we attribute a BUY recommendation to Iberdrola’s stock with a target price of €7.31. To substantiate this, is the fact Iberdrola is trading with similar multiples to peers (P/E 14.0 vs 13.3 and EV/EBITDA 9.0 vs 7.8) despite providing much stronger earnings and EBITDA growth and still maintaining a 4,8% dividend yield.
Second largest European utility company
Reduced regulatory uncertainty in the Spanish market
Strong project pipeline being delivered on time
There are risks in our assumptions that should be considered
We cover Iberdrola’s stock with a BUY recommendation
IBERDROLA COMPANY REPORT
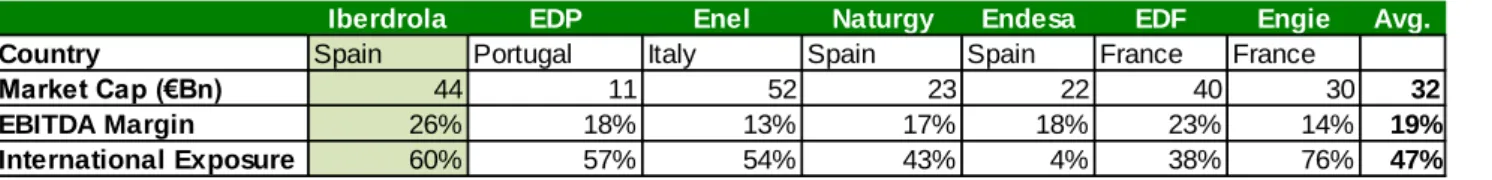
Iberdrola EDP Enel Naturgy Endesa EDF Engie Avg.
Country Spain Portugal Italy Spain Spain France France
Market Cap (€Bn) 44 11 52 23 22 40 30 32
EBITDA Margin 26% 18% 13% 17% 18% 23% 14% 19%
International Exposure 60% 57% 54% 43% 4% 38% 76% 47%
Source: Companies data, 9M18
Figure 1 - Iberdrola Peers Comparison
Company description
Founded in 1992, Iberdrola is a Spanish multinational utilities company. It was created as a result of the merger between Hidroeléctrica Española and Iberduero that led Iberdrola to become Spain’s largest electricity company. Currently, with more than 33,000 employees, it is present in 4 continents, with a significant presence in Spain, USA, United Kingdom, Brazil and Mexico. As a result, it is the second largest utility company in Europe, by market capitalization.
Additionally, when comparing to its peers, Iberdrola possesses a better EBITDA margin which reveals a more efficient cost structure and it has a stronger international presence, which coupled with the regulated nature of the business allows for diversified and stable returns.
Iberdrola is divided in three different business segments. The Generation and Supply (G&S) business comprises the activities of producing energy through non-renewable resources (Gas, Coal and Nuclear), purchasing and sale of power on wholesale market, and responsible for supplying the end user with power and additional services and products. As of 9M18, this business unit generated an EBITDA of 1,326 million euros, representing 20% of the total EBITDA. Most of Iberdrola’s installed generation capacity is in Spain, Mexico and Brazil.
The Networks business unit includes the transportation of electricity from the generation plants to the end user. It is divided in two parts, transmission and distribution. Transmission deals with the initial of transportation of high-voltage energy which, afterwards, is transformed into medium/low-voltage energy that is handled by the distribution network. As of 9M18, this business unit generated an EBITDA of 3,642 million euros, representing 54% of the total EBITDA. The countries with the most relevance in this business unit are Spain, USA, Brazil and United Kingdom.
The Renewables business unit comprises the activities of producing energy through renewable resources (Wind Onshore, Wind Offshore, Hydro, Solar and Spanish largest energy
company
Strong international presence and great EBITDA margin
Figure 2 - EBITDA per business
IBERDROLA COMPANY REPORT
Mini-Hydro), in which Iberdrola is among the top players. As of 9M18, this business unit generated an EBITDA 1,757 million euros, representing 26% of the total EBITDA. Most of Iberdrola’s facilities are in Spain, USA, United Kingdom and LATAM.
At last, the Others business unit, representing less than 1% of the total EBITDA, is mainly comprised of real estate activities.
Overall, the country with the largest EBITDA share is Spain. However, we expected its dominance to decrease given the company’s investment plan to increase production capacity and network presence in foreign markets, especially in the American continent.
Shareholder structure
According to CNMV, Iberdrola capital stock is divided into 6,397,629,000 shares outstanding. With 83.27% free float, it has currently one of the most diversified shareholder structures when compared with its peers, EDP (43.4%), ENEL (70%), EDF (4%) and Engie (68%). Its main shareholdings are composed of Qatar Investment Authority, which bought its position in 2011 and has 8.57% of the total shareholder voting rights, BLACKROCK Group which increased its stake from 3% in February this year to 5.13% and Norges Bank with a participation of 3.03%. In total, these 3 entities own 16.73% of Iberdrola, which indicates a diluted ownership of the company. Furthermore, a large takeover is unlikely to happen as, according to the US law, where Iberdrola operates through its subsidiary Avangrid, any acquisition that gives rise to ownership higher than 10% must be approved by the Federal Energy Regulatory Commission and the regulatory authorities of the states. Therefore, it’s unlikely the current structure will suffer significant changes in the near-term.
Leverage Analysis
Until 2015, Iberdrola’s leverage1 decreased mainly due to a reduction of long-term debt caused by the Spanish tariff deficit write-off. Afterwards, in 2015, a further reduction happened due to the formation of Avangrid (by acquiring UIL 79% financed by Avangrid shares) which led to a growth of non-controlling interests, coupled with a very reduced growth of debt. From that point onwards, Iberdrola’s leverage has been increasing mainly due to the integration of Neoenergia, in 2017, and the investments undertaken in that same year. Regarding the debt value per currency, its distribution enables Iberdrola to hedge some of the currency risk because when the foreign currency depreciates
1 Leverage = Net Debt / (Net Debt + Equity)
Figure 3 - EBITDA per geography
Source: Company data, 9M18
Figure 4 - Shareholder structure
Source: Company data, 2018
Figure 5 - Historical leverage
IBERDROLA COMPANY REPORT
although the company’s local EBITDA decreases, the value of foreign debt decreases as well.
Another useful indicator is the Net Debt to EBITDA ratio which measures the company ability to pay back debt. In 2017, the ratio increased sharply leading Net Debt to become 4.59x the year’s EBITDA because of Neoenergia’s consolidation. In the future, after the consolidation is completed and recent investments start generating cash flows, we expect this ratio to decrease steadly to 3.4x in 2022. In relation to the credit metrics, the 3 major rating agencies gave a rating of Baa1, BBB+ and BBB+ to Iberdrola’s debt which indicates it has an adequate capacity to meet its financial commitments. Recently, Iberdrola credit rating has deteriorated due to weaker profitability and increased leverage in 2017. Nonetheless, Iberdrola’s rating is attractive, when compared to the peers, given that better or similar rated peers are partially backed by governments.
Strategic Outlook
On february this year, Iberdrola held a Capital Markets day where it announced the goals for the upcoming 5 years period (2018-2022). Overall, an investment of €32 Bn is planned, of which roughly 74% (€23.5 Bn) is allocated to growth and, the remaining 26%, is assigned to maintenance. Compared to the previous plan (2016-2020) of investing €24 Bn (€16.8 Bn growth), this represents a €8 Bn (€6.7 Bn growth) investment increase.
This investment plan of Iberdrola focuses on regulated activities and long-term contracted activities2 (91% vs 88% in 2016-2020). Of the €32 Bn, 50% (vs 46% in 2016-2020) will be allocated to the networks business, 37% (vs 33%) will be allocated to the Renewables business and 13% (vs 21%) will be allocated to the G&S business. This demonstrates a clear bet on the network and renewable business and a slowdown of the G&S activity.
In terms of geographical allocation of investment. Iberdrola is highly committed to expand in Brazil by allocating 18% (vs 2% in 2016-2020) of the investment amount, reflecting a bet on the Brazilian network and renewables segment. Similarly, in Europe, an investment increase is planned (25% vs 20%). In contrast, investment in US & Mexico (38% vs 43%) and UK (19% vs 35%) is expected to decelerate.
2 Excludes liberalized Generation & Supply, meaning all European G&S.
Figure 6 - Debt per currency
Source: Company data
Figure 7 - Credit rating comparison
Source: S&P Ratings
New investment plan launched with 33% more commitment
Focus on Networks and Renewables
Increased presence in Brazil and reduced UK exposure
IBERDROLA COMPANY REPORT
Network
Iberdrola announced an investment of €15.5 Bn, from which €10.2 Bn is allocated to growth. This growth comprises network expansion plus an investment of €3.9 Bn in network digitalization, for smart meters implementation and other digitalizion projects. This commitment is due to a stable long term regulatory framework and reasonable rates of return across countries.
Iberdrola’s strategy for next 5 years is to increase the Regulatory Asset Value (RAV) in most countries. Namely, there is a strong focus in Brazil and US. In Brazil this is due to opportunities arising from a growing market (from 2000 to 2015, electricity consumption grew on average 3.2%3) that Neoenergia is positioned to take advantage of. In the US, it is due to the network development efforts mentioned before (€1.7 Bn). Thus, based on our model, Brazil’s RAV weight is expected to increase from 16% (2017) to 17% (2022) and US is expected to increase from 29% to 36%. Conversely, Spain’s weight is expected to decrease from 32% to 26% and UK’s is expected to decrease from 23% to 21%.
Renewables
Iberdrola announced an investment of €11.5 Bn, from which €10.2 Bn is allocated to growth. In 2017, the installed capacity was 29 GW consisting of 54% onshore wind, 43% hydro, 2% offshore wind and 1% of solar (PV) and mini-hydro.
Additional installed capacity is planned in Mexico (1.2 GW), in Brazil (1.2 GW), in Portugal (1.16 GW), in USA (0.86 GW), in UK (0.71 GW), in Spain (0.47 GW) and others (1.5 GW). The main projects are the Alto Tâmega hydro in Portugal (1.16 GW), the East Anglia ONE offshore windfarm (0.71 GW) and the Santiago Solar PV plant in Mexico (0.23 GW).
3 Statista, “Electricity consumption in Brazil from 2000 to 2015”
Figure 8 - Investment breakdown per business and geography
Source: Company data
Figure 9 - RAV evolution
Source: Company data and analyst estimates Growing markets and stable long-term regulatory framework
Renewable capacity is expected to increase by 23% RAV (€Mn) 2017 2022 CAGR % Spain 9,500 9,341 -0.3% UK 6,746 7,401 1.9% Brazil 4,768 6,242 5.5% US 8,779 12,968 8.1% Total 29,793 35,952 3.8%
IBERDROLA COMPANY REPORT
Taking into account the multiple projects, in 2022, the planned installed capacity is expected to increase to 34.6 GW. The incremental capacity is expected to be 42% from onshore wind, 27% from offshore wind, 17% from Solar (PV) and 14% from hydro. Such bet on renewables is explained by its cost reduction in the last years, coupled with a beneficial policy framework in place.
G&S
Iberdrola announced an investment of €4.2 Bn, from which €3.1 Bn is allocated to growth in Mexican production capacity and supply activities in the UK and Spain, mainly related with smart meters. Iberdrola doesn’t plan to increase production capacity in any other country. In 2017, the total installed capacity was comprised of 77% of Gas (CCGT), 18% Nuclear and 5% Coal.
In the next 5 years, Iberdrola is expected to commission 4.8 GW of CCGT in Mexico, consequently becoming the country with the most conventional capacity installed and to abandon Coal production by 2020. Furthermore, in October 2018, Iberdrola sold all its generation assets in the UK, becoming the first 100% clean energy vertically integrated player in the country.
Overall, all business units combined, Iberdrola informed investors that 69% of the investment was guaranteed. As of the 3rd quarter of 2018, Iberdrola is on track to deliver the full investment plan, having started almost 90% of the projects’ construction4. Regarding the 2016-2020 plan, according to the 2017 update, no significant delays occurred.
Under the current investment plan, Iberdrola is aiming to reach an EBITDA of €11.75 Bn by 2022. Although, this exceeds our estimates by 9% which we consider to be due different assumptions regarding currency, load factors, macro conditions, among others. This plan establishes even further Ibedrola’s position among the cleanest utility companies. Its share of regulated business, by 2022, is estimated to represent 84% of total EBITDA5.
Macroeconomic Environment
Economic Profile
According to IMF, the world economy is expected to grow (Real GDP) at roughly 3.6% per year until 2023. Furthermore, in this period, advanced economies are expected to grow at roughly 1.9% and emerging economies at roughly 4.8%.
4 José Ignacio Sánchez Galán (CEO), Q3 2018 Earnings Call 5 Based on analyst estimates
All developments are on track Source: Company data and analyst's estimates Figure 10 - Installed capacity evolution
MW 2017 2022
Onshore 15,533 17,934
Offshore 544 2,058
Hydro 12,512 13,294
Solar & Other 396 1,362 Total 28,985 34,648
Figure 11 - Installed capacity evolution
Source: Company data and analyst's estimates
Source: Company data and analyst’s estimates *Total includes adjustments
IBERDROLA COMPANY REPORT
2015 2016 2017 2018F 2019F 2020F
EUR/USD 1.11 1.11 1.13 1.19 1.19 1.19
EUR/GBP 0.73 0.82 0.88 0.88 0.88 0.88
EUR/BRL 3.70 3.86 3.61 4.31 4.31 4.31
Thus, in this period, the positive outlook of the economy combined with Iberdrola’s international profile fosters a favourable environment for the company’s growth. Particularly, Mexico and Brazil are expected to grow on average 2.7% and 2.1% per year until 2023, respectively. This is one of the reasons justifying Iberdrola’s increasing commitment in these two regions, as seen before. On the other hand, Spain, USA and UK, the company’s more mature markets, are expected to have a more cautious growth (average of 2%, 2% and 1.5%).
In the upcoming years, Iberdrola is expected to face high levels of inflation in Mexico and Brazil. The effect of this is the investors requiring a higher remuneration in these countries which has a negative impact on profits. However, in Mexico, Iberdrola operates under long-term contracts which are annually updated by the inflation rate and the activity in Mexico is entirely denominated in USD. Furthermore, in Brazil, the contracts are updated monthly according with the IPCA index. Nonetheless, the forex risk still exists, and, as a matter of fact, the forex impact on 9M18 EBITDA was -€ 312M. On the more developed markets, according to OECD data, and has part of the central banks’ monetary policy the inflation rate is expected to be around 2%.
Political Situation
The most relevant political situation impacting Iberdrola is the Brexit. The uncertainty that arises from the situation, that has been dragging since 2016, has caused Iberdrola to be more cautious with the investments in the UK. According to the IMF, a No-Deal Brexit could cause the GDP to fall by as much as 5%, affecting negatively the demand for electricity, and the Pound to depreciate roughly 8% against the USD6. As a result, as mentioned before, the planned investment for the next 5 years was reduced by €6 Bn, when compared to the previous investment plan. Furthermore, Iberdrola decreased its UK’s EBITDA exposure, namely through selling its conventional generation assets there. By 2022, we expect it to remain at 19% due to the commissioning of the East Anglia ONE offshore wind farm in 2019/2020, with 714 MW.
6 “What to expect from a no-deal Brexit”, The Economist, November 24th, 2018
Figure 13 - Real GDP growth forecast
Source: International Monetary Fund (IMF)
Source: Company data, analyst’s estimates Figure 16 - UK's EBITDA share Figure 14 - Inflation rate forecast
Source: International Monetary Fund (IMF)
Figure 15 - Exchange rate projections
IBERDROLA COMPANY REPORT
Energy Sector
Electricity Demand
Electricity demand in the world has been increasing at 2.5%7 p.a., on average, since 2007. A contributing factor is the growing economic activity, as real GDP grew on average 3.6%8 in this period. In Iberdrola’s most developed countries (USA, Spain and UK), the average annual electricity demand growth, since 2007, was -0.3%, -0.6% and -1.3%, respectively. Contributing to this was the 2008 financial crisis given that the stagnation of economic growth affected total electricity demand. In more recent years, concerns regarding the environment have led developed countries to establish energy efficiency policies, such as the EU’s Energy Efficiency Directive, with binding measures to help countries reach the established energy efficiency goals. This trend has mitigated the impact of growing economic activity in developed countries, in more recent years. More specifically, in the UK, waning industrial activity has also been a contributing factor9.
On the other hand, emerging countries such as Brazil and Mexico have been experiencing an average electricity demand growth of 2.6%, since 2007. In both countries this has been mostly due to increasing population coupled with increasing economic activity that contributes to an expansion of the electricity system. Additionally, in these countries, efficiency improvements have not been so meaningful.
For the foreseeable future, we expect electricity demand to keep on growing at a lower rate than the expected GDP growth rate, in the more developed countries, and remaining flat in case of UK. In Mexico and Brazil, the electricity demand should keep on growing at the GDP growth rate, whilst following the development of the economy and electrification systems.
7 Global Energy Statistical Yearbook 2018, Enerdata 8 International Monetary Fund (IMF)
9 “UK electricity use falls – as rest of EU rises”, The Guardian, January 30th 2018
Figure 17 - Cumulative electricity demand growth (2007-2017)
Source: Global Energy Statistical Yearbook 2018, Enerdata
Figure 18 - Electricity demand and GDP growth comparison (Spain, Brazil & UK)
IBERDROLA COMPANY REPORT
Power Prices in Iberia
In Iberia, electricity is sold on MIBEL (Iberian Market of Electricity). It is traded under two regimes: Ordinary, under which conventional electricity (hydro, gas, nuclear, oil and coal) is sold to clients, using bilateral contracts, or directly to the organized market. Ordinary regime producers may also supply ancillary services, to ensure the system’s operability. Electricity is also sold through a special regime, for wind and solar energy, which was established to encourage the production of renewable electricity. Iberdrola operates under both regimes and supplies the system with ancillary services.
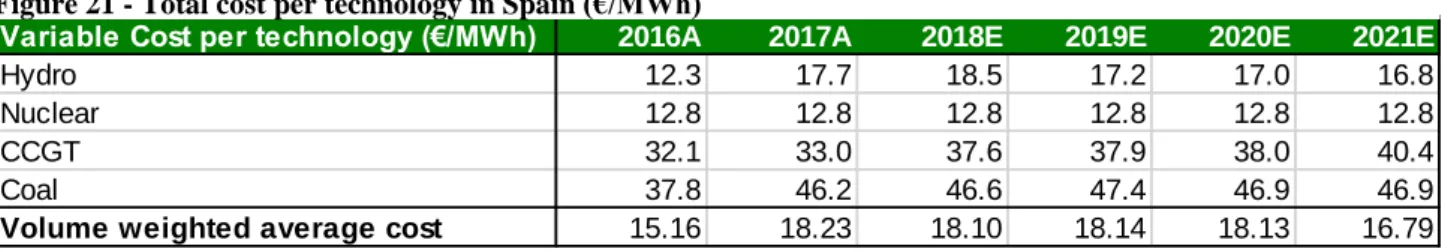
Under the Ordinary Regime, producers supply electricity to the market, according to the corresponding marginal cost of the technology and the price received is the marginal cost of the last technology closing the demand (Appendix 1). As expected, Renewables are the cheapest technologies as they are not dependent on a commodity, followed by nuclear which also has low dependence of commodities. Whereas, in 2016, Coal has become the most expensive source10, following a contraction of supply and increasing demand from the Asian Markets. The marginal cost of the technologies is also affected by levies and CO2 permits. On July 2013, the Spanish Government decided to introduce measures to eliminate the tariff deficit11 owed by energy firms that had been raised since 2001. These measures involved securitization of the debt, renewables’ subsidies cuts and imposed levies on generation. The levies were a generation tax of 7% for both Ordinary and Special production regimes, a nuclear tax equivalent to €2,190/kg of nuclear waste, a 22% tax rate on Hydro production (which was increased to 25.5% in 2017), and a tax called “Green Cent” on gas (€0.03/m3, equivalent to €4.93/MWh) and coal (€14.97/ton, equivalent to €5.38/MWh). Additionally, nuclear producers must pay €7/MWh to finance the future decommissioning of nuclear plants.
Another important factor affecting the price is the CO2 permits pollutant technologies must pay. The European Union’s Emissions Trading Systems (ETS) charges power plants and factories for every tonne of CO2 emitted, with the objective of reducing greenhouse gas emissions by 43% in 2030, compared to 1990. CO2 permits price remained cheap in the years after the financial crisis because the lower economic activity caused an oversupply of them, hence the systems was not functioning properly. To patch the system’s malfunction, the EU
10Excluding levies and CO2 permits.
11 The Spanish Tariff Deficit is the accumulated difference between the cost of generating, distributing and supplying electricity for regulated markets and the final consumer price fixed by the government, since 2001. The deficit covers unprofitable business areas such as supplying islands with electricity and Spain’s renewable energy development. In Spain, electricity is sold
under two different regimes: Ordinary and Special
Energy is sold according to the Merit Order Curve. The technology closing the demand sets the price
The cheapest technologies are Renewables and Nuclear Levies were imposed by the Spanish Government to
eliminate the tariff deficit owed by the energy firms
Source: Analyst’s research
Figure 19 - Wholesale price components
Figure 20 - CO2 prices 2017/2018
IBERDROLA COMPANY REPORT
agreed on reforms, in 2017, to reduce the number of permits available. Consequently, the price of CO2 had a 274% increase in 2018, this rise translated into an increase from €2.9/MWh to €7.3/MWh on CCGT production and from €6.1/MWh to €15.6/MWh on Coal Production.
Despite the efforts to fix the CO2 markets, we believe CO2 permits price will peak in 2021, at 30€, but will be lower onwards, to a level of 10€12. This is because increased renewable capacity installation, increased energy efficiency and the UK leaving the EU ETS should contribute to a lower demand of CO2 permits11.
Business Forecast
Network Business
As seen before, the network business deals with the transportation of electricity from the source to the end user. It is the most relevant business unit of the company, responsible for driving 58% of the EBITDA as of 2017. Its main markets were in Spain (36%), USA (32%), UK (21%) and Brazil (11%), as a percentage of EBITDA, in the same year.
Subdivided in transmission and distribution, this business currently distributes around 290,000 GWh of energy per year, through 31.3 million supply points (90% of which are residential users). This is done by using roughly 50,000 km of transmission lines and 1,106,000 km of distribution lines (overhead and underground).
In Spain, regulatory oversight is handled by CNE (Comisión Nacional de Energía) which establishes how operators should be remunerated. The remuneration is determined by six-year regulatory periods (most recently in 2013) that, previously, defined a remuneration rate based on a ten-year government bonds plus an appropriate spread for a low risk activity. Additionally, operators are compensated for their operational and depreciation costs, and rewarded based on their performance over multiple metrics such as quality and losses reduction.
12 According to IHS Markit study – “EU ETS: Carbon Price Increase: Will it Last?” CO2 permits price is estimated
to peak in 2021 and decrease afterwards
Figure 22 - Networks EBITDA per country
Source: Company data
Figure 23 - Remuneration approach in Spain
Source: Analyst's research
Variable Cost per technology (€/MWh) 2016A 2017A 2018E 2019E 2020E 2021E
Hydro 12.3 17.7 18.5 17.2 17.0 16.8
Nuclear 12.8 12.8 12.8 12.8 12.8 12.8
CCGT 32.1 33.0 37.6 37.9 38.0 40.4
Coal 37.8 46.2 46.6 47.4 46.9 46.9
Volume weighted average cost 15.16 18.23 18.10 18.14 18.13 16.79 Figure 21 - Total cost per technology in Spain (€/MWh)
IBERDROLA COMPANY REPORT
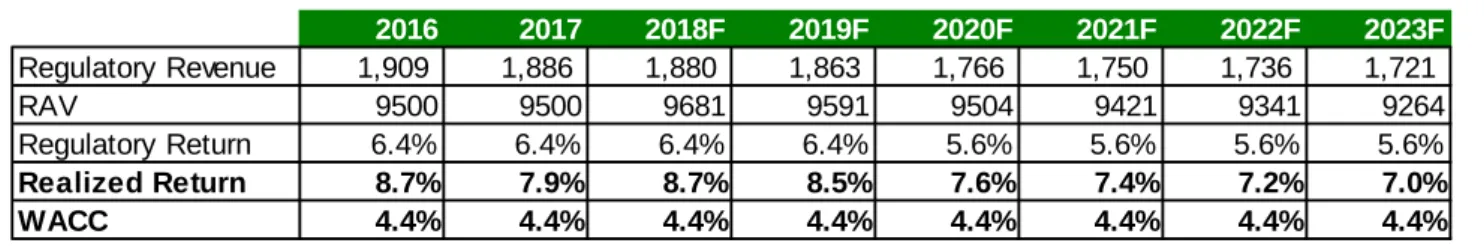
From these factors, the regulatory return and the RAV are the most impactful components on valuation. Regulatory return will be fixed until 2019 on 6.4% (10-year bond yield of 4.4%13 plus a 2% spread) although, due to recent regulatory events, will start following a WACC-based model which puts it fixed at 5.6% from 2020 to 20251415. Since that yields on the government debt have fallen significantly over the period, and the remuneration scheme is not connected to the real cost of capital, the system may become unsustainable. On the other hand, taking into consideration Iberdrola’s investment plan (2018-2022) and Spain’s electricity demand trend the RAV will decrease slightly in that period and, from 2022 forward, was estimated to decrease at -0.7%/year. Overall, returns above the cost of capital are being achieved, although the gap is decreasing over the years.
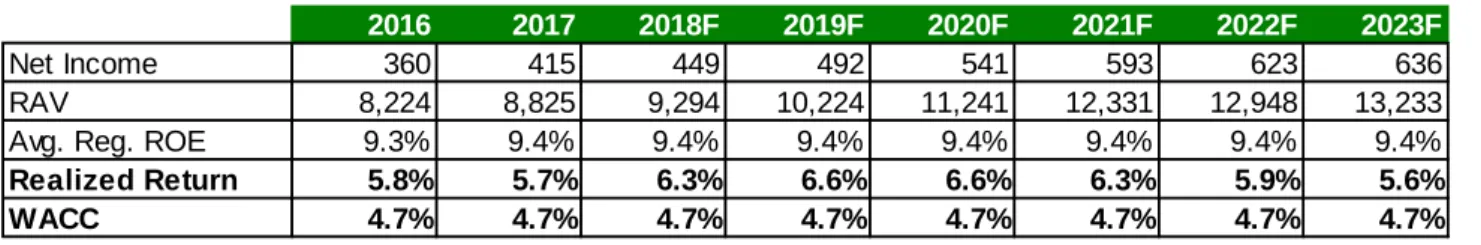
In the USA, Iberdrola is present through Avangrid Networks (81.5% ownership), a company with eight distinct subsidiaries. From these, the main companies are New York State Electric & Gas Corporation (NYSEG), Rochester Gas and Electric Corporation (RG&E), Central Maine Power (CMP) and United Illuminating Company (UI). Revenues are regulated by different entities, depending on the jurisdiction of each subsidiary. Nevertheless, a common revenue model is established. Operators, such as Iberdrola, are rewarded based on the RAV value (adjusted by the company's equity ratio) and a stipulated return on equity (ROE).
Currently, the regulatory environment is very stable. The regulatory ROE has been set to around 9/10% in all jurisdictions and is expected to continue at that level in the future. This creates a favourable situation, leading Iberdrola to invest significantly in this country. Hence, the RAV is expected grow at 8.1% per year, on average, from 2017 to 2022. As for the equity ratio limit imposed by regulators, it is predicted to be the same as of now.
Overall, a stable regulatory framework and realized returns above the cost of capital contribute to the growth of Iberdrola’s network presence in the USA.
13 Spanish 10-year bond yield return as of 2013, defined at the start of the regulatory period 14 “Spain's energy regulator pushes for WACC-based model”, S&P Global, November 2nd, 2018
15 Still pending approval of the Ecological Transition Ministry. Extremely likely to be accepted given that yields on the government debt have fallen significantly and a remuneration scheme with no reference to the real cost of capital discourages investments 2016 2017 2018F 2019F 2020F 2021F 2022F 2023F 1,909 1,886 1,880 1,863 1,766 1,750 1,736 1,721 9500 9500 9681 9591 9504 9421 9341 9264 6.4% 6.4% 6.4% 6.4% 5.6% 5.6% 5.6% 5.6% 8.7% 7.9% 8.7% 8.5% 7.6% 7.4% 7.2% 7.0% 4.4% 4.4% 4.4% 4.4% 4.4% 4.4% 4.4% 4.4% WACC Realized Return Regulatory Revenue RAV Regulatory Return
Source: Company data, analyst’s estimates
Figure 24 - Networks Spain remuneration data (in €Mn)
Figure 25 - Remuneration approach in the USA
IBERDROLA COMPANY REPORT
The third most relevant regulated market is the UK, in which Iberdrola operates through Scottish Power Energy Networks (SP). The subsidiaries SP Transmission and SP Distribution handle transmission and distribution in Scotland, respectively, whereas SP Manweb handles distribution in England and Wales. Here, the regulator is OFGEM (Office of Gas and Electricity Markets) which defines the regulation companies are obliged to abide. The current regulation is RIIO-T1 (for transmission) and RIIO-ED1 (for distribution), which will be replaced by RIIO-2 starting in 2021 (transmission) and 2023 (distribution). Under these rules, companies are compensated by OFGEM’s estimate of a “fair” return over the RAV adjusted by CAPEX/OPEX spending, incentives and RPI-based inflation.
Under this framework, Iberdrola plans to invest €2.17 Bn from 2018 to 2022 which still represents a deacceleration when compared to the previous 5 years (€3.35 Bn). This might be caused by the uncertainty related with the Brexit deal that increases the risk of investing in the country.
Although Brazil is the least relevant market now, a significant flow of investment planned by Iberdrola might change this. Currently, the presence is made through a 52.45% stake in Neonergia, which increased from 39% after Iberdrola’s Elektro was acquired by Neoenergia in late 2017. In total, Neonergia comprises seven subsidiaries, four in the distribution business and three in the transmission business. Nowadays, through this expansion, Iberdrola is the company with the most amount of Brazilian distribution customers. Hence, Brazil is becoming a key market as well.
The distribution of electricity is based on 30-year concessions with tariffs (price the end customer pays) updates along the way. Tariffs revisions are done in 4/5-Figure 26- Networks USA remuneration data (in €Mn)
Source: Company data, analyst's research
2016 2017 2018F 2019F 2020F 2021F 2022F 2023F 360 415 449 492 541 593 623 636 8,224 8,825 9,294 10,224 11,241 12,331 12,948 13,233 9.3% 9.4% 9.4% 9.4% 9.4% 9.4% 9.4% 9.4% Realized Return 5.8% 5.7% 6.3% 6.6% 6.6% 6.3% 5.9% 5.6% 4.7% 4.7% 4.7% 4.7% 4.7% 4.7% 4.7% 4.7% Net Income Avg. Reg. ROE WACC
RAV
Figure 27 - Remuneration approach in the UK
Source: Analyst's research
2016 2017 2018F 2019F 2020F 2021F 2022F 2023F 1106 1050 1281 1184 1112 1122 1131 1140 6835 6756 6852 7002 7145 7282 7414 7544 6.4% 6.4% 6.4% 6.4% 6.4% 6.4% 6.4% 6.4% 989 760 692 692 692 692 692 694 Realized Return 8.2% 7.2% 8.4% 7.4% 6.6% 6.5% 6.4% 6.3% 3.9% 3.9% 3.9% 3.9% 3.9% 3.9% 3.9% 3.9% Allowed Revenue RAV
Avg. Reg. WACC CAPEX/OPEX WACC
Figure 28 - Networks UK remuneration data (in €Mn)
Source: Company data and analyst's research
Source: Analyst’s research Figure 29 - Remuneration approach in Brazil
IBERDROLA COMPANY REPORT 2016 2017 2018F 2019F 2020F 2021F 2022F 2023F 1207 4768 4404 4867 5328 5787 6243 7296 8.1% 8.2% 8.4% 8.4% 8.4% 8.4% 8.4% 8.4% Realized Return 6.8% 4.4% 10.5% 10.8% 11.0% 11.2% 11.4% 10.8% 11.0% 11.0% 11.0% 11.0% 11.0% 11.0% 11.0% 11.0% RAV
Avg. Reg. WACC WACC
year periods, independently for each operator, with yearly tariff adjustments also occurring to account for market and inflation variability. The transmission business works in a very similar way with 30-year concessions. Most of the Iberdrola’s companies will the start the 4th tariff revision period soon in which a WACC of 12.5% (nominal, post-tax) is expected to be applied for the investment remuneration calculation.
In this market, operators are compensated by the regulator for operational and maintenance costs, remuneration of investments, regulatory losses & default rate and depreciation of investments. Normally, this represents 30% of the price (tariff) the end customer pays. For valuation, the operational costs and investment remuneration have the most impact. The operational costs, limited by a benchmarking analysis, were set at the lower end and estimated to follow the evolution of RAV. On the other hand, the investment remuneration (WACC * RAV) as calculated based on the current and forecasted regulatory WACC. As a conclusion, Iberdrola’s investments in Brazil will foment a significant short-term RAV growth (roughly 6% year) to take advantage of the growing opportunities of the economy.
Generation and Supply Business
Iberdrola’s Generation and Supply activities represented 22% of the firm’s 2017 total EBITDA. Its main markets were Spain, Mexico, UK and Brazil. At the end of 2017, total installed capacity amounted to 17.7GW. Total production amounted to 88GWh.
In October 2018, Iberdrola sold all its CCGT and Hydro (566 MW) installed capacity in the UK, for €800 Mn, which implies an EV/KW of €313, a c.40% discount when compared to that of Spain’s G&S (including Hydro). With this transaction, Iberdrola disposed older generation assets, reduced its exposure to fully liberalized markets (nowadays, Generation in Spain is the only fully liberalized business segment), protected itself from possible headwinds coming from Brexit and reduced its Net Debt. This justifies, in part, the discount verified in the sale.
In its domestic market, Iberdrola is currently facing strong regulatory risks and environmental concerns are likely to change the energy production sources in the Figure 30 - Networks Brazil remuneration data (in €Mn)
Source: Company data, analyst's research
Reducing exposure to UK Figure 31 - Installed Capacity (MW)
Source: Company data, 9M18
Technology MW Spain 9,746 Nuclear 3,177 CCGT 5,695 Coal 874 UK 2,000 CCGT 2,000 Mexico 5,430 CCGT 5,430 Brazil 533 CCGT 533 Total 17,709
IBERDROLA COMPANY REPORT
foreseeable future. According to 2010/75 directive of industrial emissions, all coal plants within the EU zone, between 2016 and June 2020, had to go through investments to reduce the emission of pollutant gases (NOx, SO2 and dust emissions). Given this, unlike its peers, Iberdrola decided not to continue its activity because these assets are not as strategic as they are to some peers. Apart from coal plants closure, all nuclear production plants are also expected to be closed after the 40-year concessions come to an end, between 2023 and 2028. This has been generating controversy among the main nuclear players in Spain, Iberdrola and Endesa, because Endesa is expecting to extend the useful lives of these plants by 10 years, whereas Iberdrola doesn’t, because, according to the CEO16, the costs associated with the extension outweigh the benefits. At last, the current governing party, PSOE, had agreed in October on a number of decisions with the extreme left party, Podemos, in exchange for support to approve 2019 Spanish Budget. Among the measures was a proposal for a, €2-€3Bn remuneration cap on nuclear and hydro generation, which have been the most benefitted from the current wholesale prices. Last year, Iberdrola was responsible for the production of c.42% of the total system’s hydro and nuclear generation, therefore the impact on its activity would be at least €840Mn. However, we don’t believe the measure will go through as nuclear and hydro, together, represented 31% of the total system’s generation, in 2017, hence we believe the energy supply would be at danger. Additionally, both parties account for 151 out of the 350 Parliament seats.
As a result of these factors, Iberdrola’s only source of conventional generation will be CCGT, after 2027. CCGT’s are crucial to avoid power outages during peak-load hours, as its production output can be managed. Spain has been known for the excess capacity of this technology, therefore the load factors are too low, and the plants rely on capacity payments17 to support fixed costs. From 2022 onwards, as coal and nuclear plants phase out, we expect CCGT’s load factor to increase slightly to 10% (vs 8% now). Furthermore, the wholesale electricity price is expected to increase by €2.5-€3.2/MWh18 due to more expensive technologies having to close the demand more often. All in all, we expect the Spain’s G&S EBITDA to reduce by 43% in the next 6 years.
In Europe, the energy retail activity has been becoming liberalized in the recent years. The reduction of legal entry barriers, coupled with the little capital required
16 On 9M18 results call
17 Capacity payments are a fixed amount per MW given to electricity producers to ensure enough reliable capacity is available. The payments are used to encourage investment in new capacity or for existing capacity to remain open. Current capacity payment is estimated to be €7250 for CCGT, €2250 for Coal and €600 for Hydro.
18 According to Comisión de Expertos de Transición Energética: Análisis y propuestas para la descarbonización Strong regulatory risks in the
domestic market
Figure 34 – Spain installed capacity (MW) 2017 to 2028
Source: Analyst’s estimates
Wholesale market price to increase in the future
Source: Companies data 9M18
Iberdrola
1,80%
EDP
8,90%
Naturgy
12,90%
Endesa
34,0%
Figure 32 – Iberian coal share of total installed capacity
Source: Analyst's estimates
Plants
Year
CN Asco II
2025
CN Vandellos II
2027
CN Almaraz
2022-24
CN Cofrentes
2023
CN Trillo
2027
Figure 33 - Nuclear plants decommissioning dates
IBERDROLA COMPANY REPORT
to start supplying energy19 have brought in many small players with more competitive cost structures, which have deteriorated the margins. Nonetheless, we believe the small players are not the biggest threat, as they are more vulnerable to unexpected electricity wholesale price swings that may cause them to operate with negative margins until the regulator adjusts the retail tariffs. The biggest threat, we believe, comes from Big Oil companies with ambitious objectives in the retail segment. In Spain, Repsol recently acquired Viesgo and plans to reach 2.5m customers, CEPSA has defined the objective to capture 10% market share and GALP has also acquired a stake in an independent supplier. In the UK, Shell has also acquired the biggest retail company after the so-called “big six”. Overall, we believe the retail business will have its margin compressed due to the intensification of competition and the volume sold should decrease, in the UK, also because of the Brexit and the energy efficiency trend.
On the other side of the Atlantic Ocean, in Mexico, Iberdrola is expected to add 4.8 GW of capacity until 2022, as mentioned in the Strategic Outlook. In 2013, the Mexican government created an energy reform with the objective of 1) increasing the economy’s competitiveness, by decreasing electricity rates 2) reduce pollutant gases emissions by 22-36%, until 2026 3) Reduce transmission and distribution losses. In order to solve the first two aspects, the government decided to allow private investment on the generation, specifically for gas production as it 4 times cheaper than oil-fuel and emits 40% less CO2. To avoid shortage of gas, Mexico has been implementing supplementary energy supply measures, such as liquefied natural gas purchases, a gas pipeline expansion plan and liberalization of oil and gas upstream activities. Furthermore, activity is entirely done in USD, and energy is sold directly to the state-owned Comissión Federal de Electricidad (CFE), through 15-year PPA’s, or to Industrial and Commercial firms, through 25-year PPA’s, which eliminates uncertainty inherent to liberalized activities as those carried on in Spain. Given the stable outlook, we expect total production in Mexico, assuming CCGT’s load factors remain high (above 80%), to reach 73GWh by 2023.
Iberdrola’s presence in Brazil’s conventional generation is rather residual, as it only operates 533MW of CCGT. In Brazil, thermal production20 is remunerated under a regulated scheme, established by the ONS (Operador Nacional do Sistema do Brasil). Thermal operators receive a fixed monthly payment, determined the MW’s installed, which is updated by IPCA, independent of whether the plant is producing or not, and a variable payment (when the plant is operating) to cover the costs of raw materials and transportation. Additionally, the
19 Less than €1Mn to entry a country, according to Iberdrola’s Capital Market Day 20 Thermal production includes CCGT, coal and oil.
Stable regulated outlook in Mexico, provides certainty for adding 4.8 GW of CCGT Figure 35 - Energy distributed UK (GWh)
Source: Company data and Analyst’s estimates
Figure 36 - Mexico installed capacity (MW)
Source: Company data, analyst's estimates Figure 37 - Brazil's revenue breakdown
IBERDROLA COMPANY REPORT
regulator sets up a target Load Factor (Garantia Física), which must be achieved, in the case of CCGT it is around 85%, otherwise there is a penalty on the amount of variable remuneration the operator receives. In our analysis, we assumed that the target load factor would be met and hence, no penalty would be incurred. This is because Iberdrola has been experiencing above 85% load factors in the past.
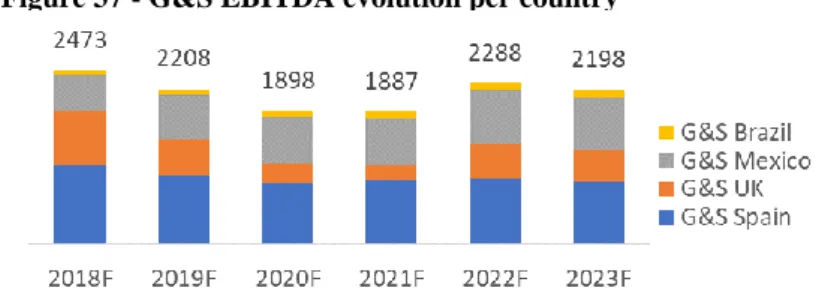
All in all, by 2023, we expect total G&S EBITDA to decrease by 11%, as a consequence of the facilities closure in Spain and the supply headwinds in Europe. These effects will be mitigated by the increase in Mexico’s capacity, which is expected to increase its EBITDA by 50%.
Renewable Business
Renewables (excluding Hydro) has been the generation source experiencing the biggest growth, in terms of installed capacity. As of 2012, it represented 5% of total capacity worldwide and, according to IEA, it is expected to represent 10% by 2020. This trend is expected to continue and reach 17% by 2040, at the expense of Coal phase-out.
Over the last decade, the large deployment of renewable facilities went together with a clear cost reduction21 of these technologies (Appendix 2). Solar PV was the technology to experience the biggest cost cut, since 2010 it fell by 72% and it is now almost at the same level as more mature clean sources. Onshore and Offshore Wind also saw a cost decrease. Onshore Wind is now almost at the same cost as Hydro and consequently, among the most mature and competitive sources. The cost reduction has been driven mainly by technologic improvements, which allow for bigger and more productive generators, augmented competition among generators’ manufacturers, economies of scale and optimized O&M processes. Also, low barriers to entry, which allow for
21 Levelized cost of electricity (LCOE). Measure of the total average cost to build and operate a power-generating asset over its useful lifetime, divided by the total production.
Figure 37 - G&S EBITDA evolution per country
Source: Analyst’s estimates
Technology
MW
Spain
5,833
Nuclear
3,177
CCGT
2,656
Mexico
9,864
CCGT
9,864
Brazil
533
CCGT
533
Total
16,230
Figure 38 - Installed capacity 2023 (MW)Source: Analyst’s estimates
Large deployment of
renewables together with large cost reduction
Renewables are expected to represent 17% of total
IBERDROLA COMPANY REPORT
scale developers competing to develop projects all over the world and low cost of capital, driven by supportive policy frameworks.
In the developed countries, concerns about the climate change has long started to lead politicians to create more environmentally friendly policies. In Europe, the EU’s Renewable Energy Directive aims at having at least 32% of the energy demand supplied by renewable sources by 2030. In order to do so it set guidance on support schemes national governments should use to incentivize renewables production and not undermine the electricity market. The US doesn’t have a directive on renewable energy, however almost all the states have at least some targets and Iberdrola managed to take advantage of it by investing in states with high established targets, such as California or New York which have a target of 50% by 2030. To achieve these targets, countries have developed regulations to incentivize the installation of renewable facilities, hence, Iberdrola sells most of its renewable energy through Feed-in Tariffs or Power Purchase Agreements, with private entities, which buy the electricity for a given time frame, usually 20 to 25 years, for a fixed price per MWh. Furthermore, electricity producers might be subsidized for the construction at a fixed rate per MW. The structure of these subsidies is different in the US. There is a federal incentive called Production Tax Credit (PTC) to support the development of renewable energy, namely energy from wind that reduces the taxable income by $2.3cents-KWh for the first 10 years of the facility’s operations. PTC’s program is expected to end for projects to go under development after 2020. However, we don’t expect the profitability of renewable projects in the US to be jeopardized, given the federal tax reduction, in 2018, from 35% to 21%.
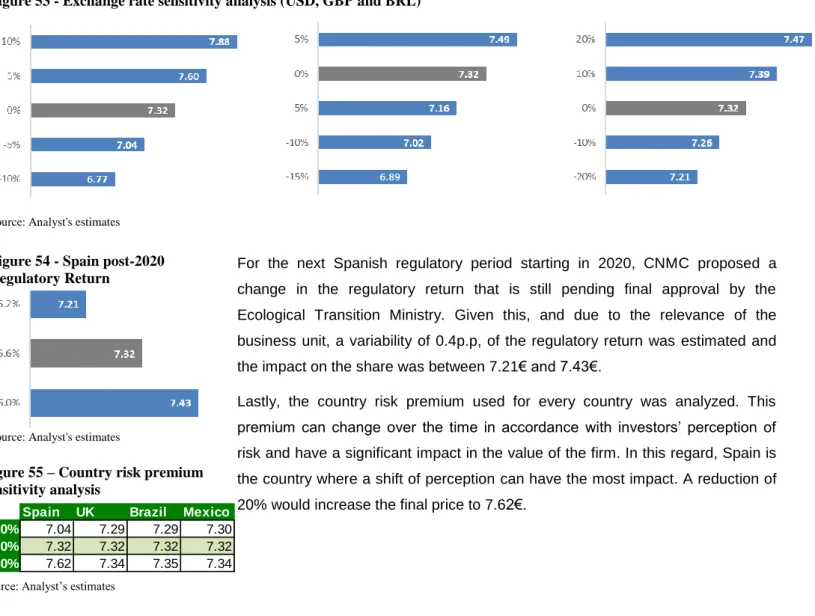
Spain has abandoned these incentives to renewables because such renewable policies were creating a heavy burden on the electricity system, as mentioned before. Instead, its model, established in 2013, was designed to guarantee the renewable operators a return of 7.4% (Spanish 10-year average bond yield (2003-2013) plus 300bps spread). To do so all facilities (established after 2004) are entitled to receive the wholesale market price, under a Caps and Floor system and, in the case the Market Remuneration is not enough to reach the target remuneration, the operator is also entitled to a “specific remuneration” based on a fixed rate per MW. The government projections for the wholesale price is reviewed every 3 years, whereas the whole remuneration is reviewed every 6 years. For the next regulatory period, starting in 2020, CNMC has decided to change the remuneration to 7.1% and to take an approach based on the WACC, similar to the Networks segment. We believe the outlook is rather favorable as if CNMC was to apply the former formula, renewables’ profitability would be jeopardized.
Most of renewable energy is sold using long-term
purchasing contracts
Renewable positive situation driven by environmental concerns
Renewable facilities may receive subsidies to foment its installation
Spanish framework is designed to guarantee a minimum return
Figure 39 - Renewable Installed Capacity per geography (GW)
IBERDROLA COMPANY REPORT
Currently, Iberdrola has 29.2 GW of renewable installed capacity spread through its main markets, Spain, US, UK, Latam and RoW. Its capacity is mainly composed of onshore wind and hydro, but solar and offshore are also expected to increase its share.
Until 2023, Iberdrola’s renewable capacity is expected to grow by 22% and most of the capacity is to be installed away from its domestic market. Iberdrola is exploring opportunities in the American Continent, where there is a better cashflow stability, as there is less exposure to merchant prices and the Load Factors tend to be higher than those in Spain. In Mexico, renewable energy is sold to CFE, under 25-year PPA’s, there Iberdrola is expected to add 444MW of onshore wind energy and 620MW of solar PV. In Brazil, renewable energy is also sold under long-term PPA’s, Iberdrola is expected to deploy 472 MW of wind capacity in the country. In the USA, Iberdrola’s main wind market, Iberdrola will deploy 1.3 GW of onshore wind capacity and 800MW of offshore wind, which will also be sold under long-term contracts. We expect the renewables’ EBITDA in these regions to increase by 47%, until 2024 (€911Mn vs €1335.6Mn).
As mentioned before, solar PV experienced the biggest cost reduction among all sources, as a consequence of the technology improvement, such as new materials used and different designs which allow for better load factors, additionally in 2015, 7 out of the 10 largest solar PV manufacturers were from Asia and in September 2018, EU decided to lift the anti-dumping fees on Solar PV’s from China, hence its cost is expected to decline even further. These factors together with the Iberdrola’s worldwide presence will allow for the installation of 1GW of Solar PV, in areas where the average yearly hours of sunshine are over 260022 (391 MW in Region of Badajoz, Spain and 660 MW in Santiago, Mexico). Consequently, we expect the load factor of solar PV to achieve 20% (vs the average 17% with the current capacity) with the installation of the new facilities.
Iberdrola is expected to add 2.5GW of Offshore wind (spread throughout the USA, the UK and the Baltic Sea), in the next 5 years. Currently it is still the most expensive technology, as the installation and maintenance are very high23. However, load factors can go up to 50% and turbines can have twice as much capacity (Offshore turbines vary between 7-12 MW, whereas Onshore turbines are limited to 4MW). Offshore capacity is awarded under long contracts, attributed through competitive bidding. We believe Iberdrola’s early bet in this market was beneficial because competition is getting fierce and the PPA’s values are not as high as before (Wikinger offshore (350 MW, Germany), PPA under
22 Source: AEMET and weatherspark.com
23 Onshore Installation cost per MW c.€1.4Mn; Offshore Installation cost per MW c. €3.7Mn – €4Mn (Analyst’s Estimates)
Figure 41 - Historical Load Factors (Onshore Wind)
Source: Company data
Figure 40 – 2018 Renewables EBITDA by geography (€Mn)
Source: Analyst’s estimates
2018
2023
UK
194
908
US
0
800
Germany
350
1332
Total
544
3040
Figure 42 - Offshore wind capacity (MW)
Source: Company data and analyst’s estimates
IBERDROLA COMPANY REPORT
compress model includes €190/MWh for the first 8 years, then €150/MWh for the next 5 years and the last 8 years are €35/MWh24, whereas Vineyard Wind (800MW, US) is expected to have a PPA of $65/MWh for 20 years).
Lastly, this year Iberdrola decided to move Hydro generation from G&S to Renewable, a strategic move to better highlight its commitment to renewable generation. Until 2023, Iberdrola is expected to increase its hydro capacity in Portugal by 1.2GW (998MW, in 2021 and 160MW, in 2023). In Iberia, hydro production is exposed to merchant prices and it is among the cheapest technologies to bid, hence it will be directly benefited from the nuclear and coal plants phase-out. Due to the expected wholesale price increase, we estimate its EBITDA to increase by 5.13%, from 2023 onwards, as a consequence of the nuclear and coal closure mentioned in the “Generation and Supply” Chapter.
Valuation
Cost of Capital
As each of the businesses carried on by Iberdrola varies significantly in terms of nature and risk, we estimated a separate cost of capital for each business unit. (Appendix 4)
In order to determine the cost of equity, the CAPM was used with a Market Risk Premium of 6%25, across all the business units. For the risk-free rate, we used the German’s 10-year government bond yield, 0.54%, for the European businesses, the US 10-year government bond yield, 3.20%, for Avangrid and Mexico (as the activity in Mexico is carried on entirely in US Dollars) and 7,36% as a proxy for the risk free in Brazil26.
24 Germany Trade and Invest and Analyst’s estimates
25 According to Prof. Pablo Fernandez’s market survey, the average market risk premium in mature markets used by scholars and analysts varies between 5% to 6%. Source: IESE Business School, 2016.
26 10y USD Yield in BRL = ((1+10y USD Yield in USD)10 × (1+𝐼𝑛𝑓𝑙𝑎𝑡𝑖𝑜𝑛 𝐵𝑅𝐿)10/ (1+𝐼𝑛𝑓𝑙𝑎𝑡𝑖𝑜𝑛 𝑈𝑆𝐷)10 )1/10 −1; inflation in Brazil 2017 (6%), inflation in US 2017 (1.9%)
Market risk premium of 6% assumed
German and US 10-year bond yields for the risk-free rate, except in Brazil
Figure 43 - Hydro installed capacity (MW)
Source: Company data 9M18
Figure 44 - Nuclear closure impact on Hydro Spain EBITDA (2023 onwards)
IBERDROLA COMPANY REPORT
To estimate the betas of each business line we defined comparable companies (i.e companies that have at least 75% of their revenues derived from that activity) and we regressed the returns of those stocks against broadly diversified indexes. We used the EuroStoxx600 for the European companies and the S&P500 for the American companies (Appendix 3). As expected, the regulated segment, Renewable and Networks, are the ones with the lowest Unlevered Beta, whereas the liberalized activities are more exposed to market cycles. We assumed the Neoenergia and Mexico to have the same unlevered beta as the networks segment because they are also fully regulated. Additionally, due to the lack of reliable information on public firms fully exposed to the retail of energy we assumed the Supply UK to have a beta of 0.827 and for Other Businesses we set the beta as the average. Furthermore, we have considered the risks of carrying businesses in different geographical locations by adding a country risk premium (CRP)28. According to Prof. Damodaran, Brazil yields the biggest CRP, 4.24%, followed by Spain, 2.26%, Mexico, 1.7% and the UK, 0.70%.
The cost of debt was determined by adding a credit spread, according to Prof. Damodaran, over the risk-free rate. According to Fitch, Moody’s and S&P, Iberdrola’s credit rating is BBB+, which yields a spread of 1.27% over the risk-free. On the other hand, Neoenergia, was rated BB- by S&P, corresponding to a 2.38% spread. To estimate the target D/E we used the Net Debt, in the balance sheet, in the end of 2019 divided by the market cap, as of October 2018, yielding a D/E of 0.87 which we expect to remain stable given the nature of the industry. Regarding the Terminal Value, we assumed the business to be constant after our explicit analysis timeframe because in the most developed countries where Iberdrola operates electrification is already very developed and there are not many growing opportunities. In Brazil, where the national electricity system is still at an early stage of development, when compared with the most developed countries, we have assumed a 2% growth rate, in line with the OECD long-term Brazilian GDP forecast.
Sum-of-the-parts
To estimate Iberdrola’s business units’ value a DCF analysis was performed. Additionally, we valued the Adjustments at the average EV/EBITDA 2019 of the business units. Regarding the Financial Assets, the book value was used for all
27 CMA – Energy Market Investigation: Analysis of cost of capital of energy firms 28 R
e = Rf + βL. * (MRP + CRP)
Source: Analyst’s estimates
Figure 46 - Cost of debt per segment Figure 45 - Cost of Equity per segment
IBERDROLA COMPANY REPORT
elements, as we believe it was correctly priced, including the 8% participation on Siemens Gamesa.
The net debt in our SOTP analysis is the balance sheet value at the end of 2019 plus the value of the hybrid debt, included in the equity, plus the net value of the financial derivatives29 . Additionally, the provisions related with pension obligations and facilities closure were subtracted. On our DCF analysis Iberdrola yields a share value to be 7.32€, although we acknowledge there might be some risks inherent to the valuation methodology, namely FX, commodities prices, load factors and regulatory assumptions.
Multiples Comparison
We believe our investment thesis is supported by looking at the comparables. From this analysis we decided to exclude EDF given that its 2017 was results were polluted by the uncommon amount of times the French utility had to restart its nuclear reactors and delays experienced on the process. Additionally, given the fact that EDF is 83.7% owned by the French government, the stock is not very liquid.
Currently, Iberdrola trades at 14x the P/E ratio, which is very close to the average of the peers (5% premium). However, we have good prospects for Iberdrola’s EPS CAGR 2017-22 is 4.2%. The average EPS CAGR is 3.1%, hence its earnings are growing 35% more than its peers. The EV/EBITDA is trading at a 15% premium when comparing to its peers (9x vs 7.8x), which is supported by Iberdrola’s strong commitment to renewable energy, reducing exposure to older and more conventional forms of energy, however its EBITDA is growing more than two times faster than its peers. Lastly, the dividend yield is still in line with its peers despite the ambitious strategy that takes advantage of multiple growth opportunities.
29 Financial derivates liabilities – Financial derivatives assets
Source: Analyst’s estimates
Figure 47 - Sum-of-the-parts (€)
Iberdrola’s superior EBITDA and EPS growth not correctly priced in
Daily float
Iberdrola
0.30%
EDF
0.09%
Naturgy
0.21%
Enel
0.31%
Endesa
0.20%
engie
0.25%
EDP
0.16%
average
0.22%
Figure 48 – Average daily capital float (2018)
IBERDROLA COMPANY REPORT
EV/EBITDA 2017 EBITDA 2022 EBITDA CAGR P/E 2017 EPS 2022 EPS CAGR DY Iberdrola 9.0 7,319 € 10,674 € 7.8% 14.0 0.44 € 0.54 € 4.2% 4.8% EDP 8.3 3,726 € 3,674 € -0.3% 12.7 0.26 € 0.24 € -1.6% 6.4% Naturgy 8.7 3,909 € 4,744 € 3.9% 15.6 0.98 € 1.54 € 9.5% 5.8% Endesa 7.7 3,513 € 3,759 € 1.4% 14.7 1.36 € 1.34 € -0.3% 6.5% Enel 6.9 15,499 € 19,091 € 4.3% 10.9 0.35 € 0.52 € 8.2% 5.5% engie 6 9,004 € 11,228 € 4.5% 11.7 1.51 € 1.39 € -1.6% 5.8% EDF 5.6 14,141 € 19,216 € 6.3% 17.6 0.53 € 1.63 € 25.2% 2.2% Mean 7.46 4.0% 13.9 6.2% 5.3% Excl. EDF 7.8 3.6% 13.3 3.1% 5.8%
Source: Company data, Analyst estimates and Bloomberg Figure 49 -Relative Valuation Multiples
Alternative Scenarios
To complement our DCF analysis, a set of alternative scenarios was included in order to obtain a more realistic valuation price. For this, each of those scenarios was weighted based on the estimated probability of their occurrence, with the base scenario having the remaining weight.
For the bull scenario, an improvement of the Brazilian economic situation, with a probability of 15%, was assumed. Contributing to this is the recovery from the severe economic crisis that occurred from 2014 to 201630, that led to the impeachment of Dilma Rousseff. The recent change in leadership, with the introduction of Jair Bolsonaro, is also expected to promote economic stability. We assumed the EUR/BRL would recover to the pre-crisis level of 3.12 (2013) and the reduction of Brazil’s WACC by 90 bps, reflecting a renewed assessment of risk. Under this scenario, an upside of 5.1% would occur translating into a target price of € 7.69.
For the bear scenario, we analyzed the impact of a possible windfall taxation, on nuclear and hydro production. This tax of € 2bn, to be imposed by the Spanish government, would have an incremental cost for Iberdrola of € 26.24 per MWh of hydro and nuclear production. This value was obtained by dividing the total tax by the total Spanish hydro and nuclear production, in 2017. The consequence of this would be a final target price of € 6.07, implying a downside of 17% over the base case price.
30 “Brazil's worst-ever recession unexpectedly deepens in late 2016”, Reuters, March 7th, 2017
Scenarios Probability Price Bull Case 15% 7.69 € Base Case 80% 7.32 € Bear Case 5% 6.07 € Total 100% 7.31 € Figure 50 - Scenario Analysis Impact
Source: Analyst's research
(1) Windfall tax €2Bn (2) Nuclear GWh 20,610 (3) Hydro GWh 55,609 (1)/((2)+(3)) Impact MWh 26.24 € Figure 51 - Windfall tax impact