-
Helena Rico Pereira
Licenciada em Ciências de Engenharia Biomédica
Classification of patients with
parkinsonian syndromes using medical
imaging and artificial intelligence
algorithms
Dissertação para obtenção do Grau de Mestre em Engenharia Biomédica
Orientador: Doutor Hugo Alexandre Teixeira Duarte Ferreira, Professor Auxiliar, Faculdade de Ciências da Universidade de Lisboa
Co-Orientador: Doutora Carla Maria Quintão Pereira, Professor Auxiliar, Faculdade de Ciências e Tecnologia da Universidade NOVA de Lisboa [elo de ligação]
Júri:
Presidente: Doutora Carla Maria Quintão Pereira, Vogais: Doutor José Manuel Matos Ribeiro da Fonseca Doutor Hugo Alexandre Teixeira Duarte Ferreira
helena Rico Pereira
Licenciada em Ciências de Engenharia Biomédica
Classification of patients with parkinsonian syndromes
using medical imaging and artificial intelligence
algorithms
Dissertação para obtenção do Grau de Mestre em
Engenharia Biomédica
Orientador: Doutor Hugo Alexandre Teixeira Duarte Ferreira, Professor
Auxiliar, Faculdade de Ciências da Universidade de Lisboa
Co-Orientador: Doutora Carla Maria Quintão Pereira, Professor Auxiliar,
Faculdade de Ciências e Tecnologia da Universidade NOVA de
Lisboa [elo de ligação]
Júri:
Presidente: Doutora Carla Maria Quintão Pereira, Vogais: Doutor José Manuel Matos Ribeiro da Fonseca Doutor Hugo Alexandre Teixeira Duarte Ferreira
janeiro 2019 janeiro 2019
iii
Classification of patients with parkinsonian syndromes using medical imaging and artificial intelligence algorithms
Copyright © Helena Rico Pereira, Faculdade de Ciências e Tecnologia, Universidade NOVA de Lisboa. A Faculdade de Ciências e Tecnologia e a Universidade NOVA de Lisboa têm o direito, perpétuo e sem limites geográficos, de arquivar e publicar esta dissertação através de exemplares impressos reproduzidos em papel ou de forma digital, ou por qualquer outro meio conhecido ou que venha a ser inventado, e de a divulgar através de repositórios científicos e de admitir a sua cópia e distribuição com objetivos educacionais ou de investigação, não comerciais, desde que seja dado crédito ao autor e editor.
v
For those who suffer from Parkinsonian Syndromes, patients and their families.
vi
Acknowledgments
Interestingly, this page is the one that truly makes me think about the study that I had made together with a mix of feelings such as nostalgia and self-achievement. It was, for sure, a long period of learning and limit testing. This work would not be possible without the support of several people.Firstly, I want to thank to IBEB, Instituto de Biofísica e Engenharia Biomédica for the warm reception and for giving me a nice space to work in. To my adviser, Hugo Ferreira, I left a special thank you, for the proposal of such innovative and challenging study and, of course, for the motivation and tips given. Thanks to this piece of work, I really feel that I have learned a lot in these few months. To Professor Carla Quintão which supported me in these five years of Biomedical Engineering increasing in me the interest about the human brain even more.
To all the people that I met at IBEB, especially to Professor Nuno Matela for the help in the installation process and to Professor Alexandre Andrade. To Dona Beatriz for the all cheerful “Bons dias” and for the help in the PC transportation to be fixed. To Daniela Godinho for the explanation about the framework Caffe and MedCNN. To my collegues Tiago, Rita, Magdalena and Sevinç I shared my PC room with, for all our agreeable and cheerful lunches, for the experiences and culture sharing and for the ice-cream moments.
To Sérgio Cláudio of the Computer Services Direction of Faculty of Sciences at University of Lisbon, for the precious and well-disposed help in the installation process.
To all my friends that I made in this last five years at FCT UNL, especially Olivia Pinto, the funniest girl I ever met, Vanessa Ramos for the company at IBEB too, João Borrego for sharing your thesis life with me and Diogo Tecelão, dinofriend, for all the tips. Maria Gonçalves, Cláudia Espalha, Claudia Alves, Sara Lucas a huge thank you too!
To my academic family, Vera Moutinho, Marta Ferreira and Miguel Barbosa for all the support, science videos, true friendship and for understating why I was not so present as I wish to. To Big, my thai friend, for being the first person to ask me if he could read my thesis after I have finished.
To Pedro Cerqueira for all the by chance meetings at every corner in FCUL.
To Rita Gonçalves, my neighbour and oldest friend, for the support and for sending me all the nature photographs which allow to clear my mind.
The following people are those that when I wrote those lines made me feel that there are no words or sentences to describe how thankful I am. Thus, besides those words, I promise you all a sweat hug.
To my mom for all the wise mother advices, for your smile, for having inspiring me, for the support and specially for making me see the positive side of everything. For listening me about my thesis doubts even though it is not your area. Thanks for being my mom with all letters! To my dad, the first genius that I met, for inspiring me and motivating me to learn more and more, to help me to stay focused in my objectives, for all the science talks after dinner or in the car trips, and especially for make me curious since I was a child.
To my little sister. For all your patience, advices, your concerning about me, for your funny jokes and our laughs and for almost force me to watch TV with you to take a rest.
To my uncle Zé, for your cheerful mood and for the clever and shortly speech about maths and informatics and for telling me once: “there are no genius, but hard workers.”
vii
To grandma Lina, for your delicious and stunning food, for your concerning about my eyes in front of PC and to make me realize how lucky I am to have gone so far.
To grandma Antónia, for your care and your concerning about the hours I spent working. To grandad Lino for having been an example of never giving up and grandad Chainho, for telling me indirectly that knowledge is one of the most important things in the world.
Lastly, but not the least, to Duarte. Thanks for your strength, kind support and to make me see that there are no impossible things. For your time, even though you were also writing your PhD thesis. For your company and your smile that were fundamental during this period. For all our boat trips.
To all the mysterious and/or unknown forces of the universe. Obrigada.
This work was financially supported under the grant PAC nº 16428 – MEDPERSYST, funded by national funds FCT / MCTES (PIDDAC) under the “Programa de atividades conjuntas”/ P2020.
ix
Abstract
The distinction of Parkinsonian Syndromes (PS) is challenging due to similarities of symptoms and signs at early stages of disease. Thus, the need of accurate methods for differential diagnosis at those early stages has emerged. To improve the evaluation of medical images, artificial intelligence turns out to be a useful tool. Parkinson’s Disease, the commonest PS, is characterized by the degeneration of dopamine neurons in the substantia nigra which is detected by the dopamine transporter scan (DaTscanTM), a single photon-emission tomography (SPECT) exam that uses of a radiotracer that binds dopamine receptors. In fact, by using such exam it was possible to identify a sub-group of PD patients known as “Scans without evidence of dopaminergic deficit” (SWEDD) that present a normal exam, unlike PD patients. In this study, an approach based on Convolutional Neural Networks (CNNs) was proposed for classifying PD patients, SWEDD patients and healthy subjects using SPECT and Magnetic Resonance Imaging (MRI) images. Then, these images were divided into subsets of slices in the axial view that contains particular regions of interest since 2D images are the norm in clinical practice. The classifier evaluation was performed with Cohen’s Kappa and Receiver Operating Characteristic (ROC) curve. The results obtained allow to conclude that the CNN using imaging information of the Basal Ganglia and the mesencephalon was able to distinguish PD patients from healthy subjects since achieved 97.4% accuracy using MRI and 92.4% accuracy using SPECT, and PD from SWEDD with 97.3% accuracy using MRI and 93.3% accuracy using SPECT. Nonetheless, using the same approach, it was not possible to discriminate SWEDD patients from healthy subjects (60% accuracy) using DaTscanTM and MRI. These results allow to conclude that this approach may be a useful tool to aid in PD diagnosis in the future.
Keywords: Parkinsonian Syndromes Classification - SWEDD - DatScanTM - MRI – Convolutional Neural Networks
xi
Resumo
A distinção de Síndromes Parkinsonianos (SP) tornou-se um desafio dado que os sintomas e os sinais característicos destas doenças são muito semelhantes entre si nas fases iniciais. Assim surge a necessidade da criação de métodos precisos para um diagnóstico que as diferencie. Uma possível solução é o recurso à inteligência artificial que se tem vindo a tornar numa ferramenta útil para a melhoria da interpretação das imagens médicas. A doença de Parkinson (DP), a SP mais comum, é caracterizada pela neurodegeneração dos neurónios dopaminérgicos. Esta neurodegeneração é detetada pelo DaTscanTM, um exame de tomografia computorizada por emissão de fotão único (do inglês Single-Photon Emission Computed Tomography, SPECT). A utilização deste exame permitiu a identificação de um subgrupo de pacientes diagnosticado com DP, denominados de “exames sem evidência de défice dopaminérgico” (do inglês “Scans without evidence of dopaminergic deficit”, SWEDD). Os SWEDD são pacientes que possuem um DatScan normal ao contrário dos pacientes com PD. Nesta dissertação, é proposta uma abordagem com recurso às redes neurais convolucionais (do inglês: Convolutional Neural Networks, CNNs) usando imagens SPECT e Imagens por Ressonância Magnética (IRM) que foram divididas em cortes axiais contendo regiões de interesse específicas, dado que na prática clínica as imagens convencionais são imagens a 2D, para classificação de doentes com PD, SWEDD e pessoas saudáveis. Para a avaliação do classificador calculou-se o Kappa de Coehn e a Característica de Operação do Receptor. Os resultados obtidos sugerem que CNN foi capaz de diferenciar DP do grupo de controlo (exatidão: 97,4% IRM e 92,4% SPECT) e DP de SWEDD (exatidão: 97.4% IRM e 93.3% SPECT) com recurso a informação de imagem dos gânglios da base e mesencéfalo, mas não foi capaz de discernir controlos de SWEDD. Deste modo, conclui-se que esta abordagem poderá ser útil para auxiliar no diagnóstico de DP no futuro.
Palavras-Chave: Classificação de síndromes parkinsonianos – SWEDD - DaTscanTM – IRM – Redes neuronais convolucionais
xiii
Contents
Chapter 1 Introduction ... 1
1.1 Motivation ... 1
1.3 Dissertation Structure ... 3
Chapter 2 Theoretical Background ... 4
2.1 Parkinsonian Syndromes ... 4
2.1.1 The History of Parkinsonian Syndromes... 4
2.1.2 Clinical and pathophysiology of the Parkinsonian Syndromes ... 5
2.2 De novo PD patients ... 11
2.3 Non-Parkinson’s disease tremor: Essential Tremor ... 11
2.4 State-of-art: diagnosis of Parkinsonian Syndromes ... 11
2.5 Medical Imaging in Parkinsonian Syndromes... 15
2.5.1 Magnetic Resonance Imaging ... 15
2.5.2 State-of-the-Art: T1-Weighted and T2-Weighted images in PS ... 18
2.5.4 Dopamine transporter SPECT ... 21
2.5.5 PD patients with Scans Without Evidence of Dopaminergic Deficit, SWEDD ... 21
2.5.6 Diagnosis of Parkinsonian Syndromes with DAT-SPECT ... 22
2.6 Artificial Intelligence ... 23
2.6.1 Deep Learning ... 24
2.6.2 History Behind Convolutional Neural Networks ... 25
2.6.3 State-of-the-Art of CNN ... 26
2.6.4 Convolutional Neural Networks Architecture ... 27
2.6.5 State-of-the-art: CNN applications to Medical field ... 37
2.7 State-of-the-art: Classification methods for PS ... 39
Chapter 3 Methodology ... 43
3.1 Study population ... 43
3.1.1 Exclusion and inclusion criteria ... 44
3.1.2 MRI and SPECT Acquisition ... 47
3.1.3 Statistical data sample analysis ... 47
3.2 MRI and SPECT pre-processing and registration ... 48
3.2.1 Input images ... 49
3.3 Classification with Convolutional Neural Networks ... 50
3.3.1 MedCNN and Caffe ... 50
xiv
3.3.3 Train, Validation and Test Sets ... 53
3.3.4 Test/ Evaluation of the Classifier CNN ... 55
Chapter 4 Results ... 58
4.1 Study Population ... 58
4.2 Classification ... 59
4.1.1 Comparison of Control and Parkinson’s Disease ... 59
4.2.2 Comparison of Control and SWEDD ... 65
4.2.3 Comparison of Parkinson’s Disease and SWEDD ... 70
Chapter 5 Discussion ... 77
5.1 Main results ... 77
5.2 Classification ... 77
Chapter 6 Conclusion and Future Work ... 89
Bibliography ... 91
Appendix A: T1 – Weighted MRI and DaTscan acquisition ... 108
Appendix B: Accuracy Results ... 111
xvi
List of Figures
Figure 2.1 Drawings of the normal and pathologic erect position. ... 4
Figure 2.2 Charcot's drawings at his lesson (June 1888) illustrating Parkinsonian Syndromes ... 5
Figure 2.3 Neuron structure and chemical synaptic. ... 6
Figure 2.4 Substantia nigra... 7
Figure 2.5 Basal ganglia structures. ... 7
Figure 2.6 Comparison of the CBGTC from a heathy person and PD patient. ... 8
Figure 2.7 United Kingdom Parkinson’s Disease Society Brain criteria. ... 14
Figure 2.8 Proton orientation in MRI. ... 15
Figure 2.9 Precession Movement. ... 16
Figure 2.10 Illustration of the T2 decay. ... 16
Figure 2.11 Illustration of T1 recovery. ... 17
Figure 2.12 DaT SPECT images from Control subjects and Parkinson’s Diseases. ... 23
Figure 2.13 - Normal vs Abnormal DaT SPECT. ... 23
Figure 2.14 Schematic of a deep learning model. ... 24
Figure 2.15 Feedforward neural network architecture. ... 26
Figure 2.16 Convolutional Neural Network Architecture.. ... 28
Figure 2.17 Graphic representation of Rectified Linear Unit. ... 30
Figure 2.18 Activation Functions.. ... 31
Figure 2.19 Connection of input layer or one hidden layer with the following layer, in CNN. .. 32
Figure 2.20 Zero-padding. ... 33
Figure 2.21 Example of application of a kernel with and without stride. ... 33
Figure 2.22 Layers at feature extraction vs fully connected layer. ... 33
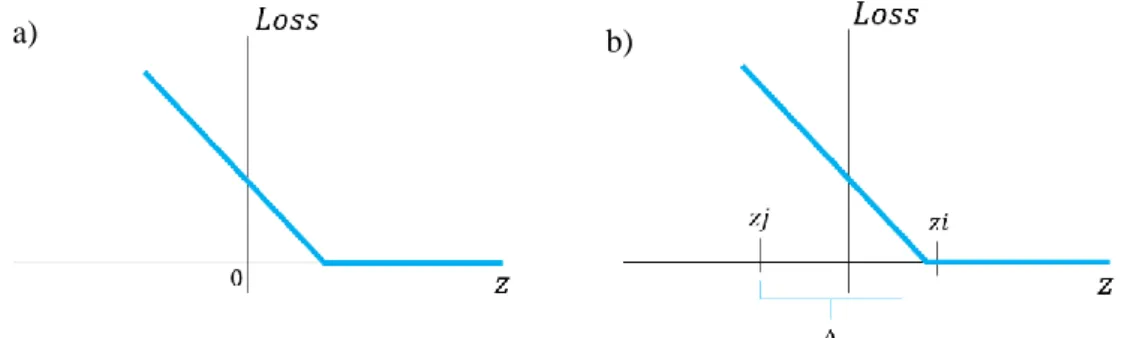
Figure 2.23 Hinge Loss function. ... 35
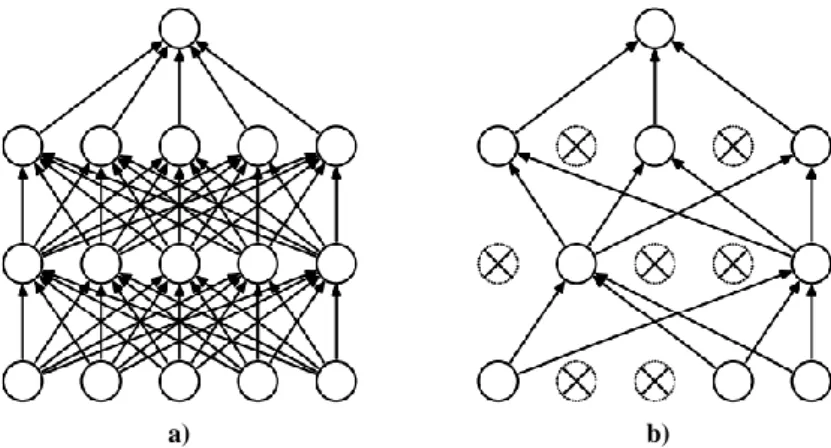
Figure 2.24 Dropout layer. ... 36
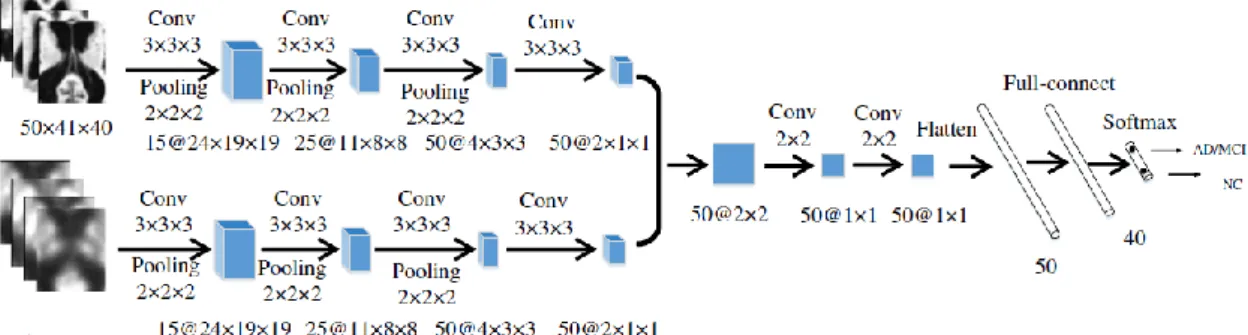
Figure 2.25 Multi-modality cascaded CNN architecture. ... 38
Figure 2.26 Deep convolutional neural network for DaTscan SPECT images classification designed by Choi et al. ... 40
xvii
Figure 3.1 Anatomical planes of the brain. ... 49
Figure 3.2 GPU versus CPU. ... 51
Figure 3.3 Framework Caffe and MedCNN application ... 51
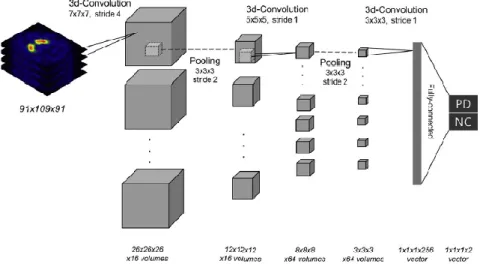
Figure 3.4 CNN designed in the MedCNN application and adapted to this study. ... 52
Figure 3.5 Illustration of the groups of three slices that formed the 3-channel slices. ... 54
Figure 3.6 Example of a ROC curve ... 56
Figure 4.1 Slices that comprises the mesencephalon and the basal ganglia. ... 60
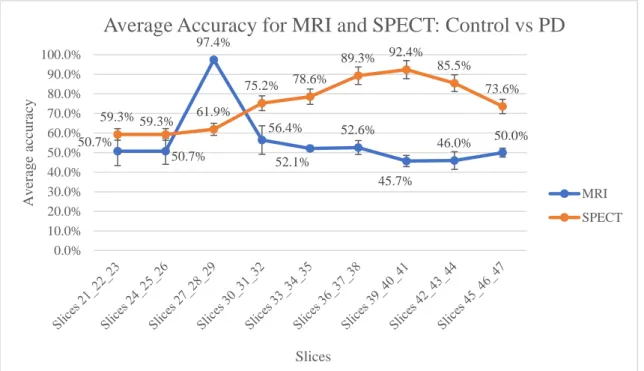
Figure 4.2 Average accuracy using MRI and SPECT slices in Control vs PD ... 61
Figure 4.3 Accuracy results for Mesencephalon MRI vs SPECT in Control vs PD ... 61
Figure 4.4 Accuracy results for Basal Ganglia - MRI vs SPECT in Control vs PD ... 62
Figure 4.5 ROC curve and AUC for PD in mesencephalon classification of Control vs PD. ... 63
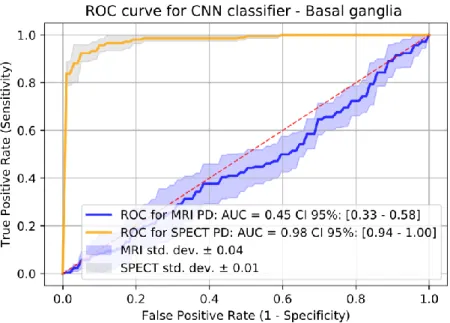
Figure 4.6 ROC curve and AUC for PD in basal ganglia classification of Control vs PD. ... 64
Figure 4.7 Confusion matrix of MRI slices of the batch 5 and SPECT slices of the batch 5. .... 64
Figure 4.8 Confusion matrix of MRI sliced of the batch 2 and SPECT slices of the batch 1 ... 65
Figure 4.9 Average Accuracy for MRI and SPECT Control vs SWEDD ... 65
Figure 4.10 Accuracy results of Mesencephalon classification - MRI vs SPECT in Control vs SWEDD... 66
Figure 4.11 Accuracy results of Mesencephalon classification - MRI vs SPECT in Control vs SWEDD... 66
Figure 4.12 ROC curve and AUC obtained in the classification of mesencephalon slices, in Control vs SWEDD ... 68
Figure 4.13 ROC curve and AUC obtained in the classification of basal ganglia slices, in Control vs SWEDD ... 68
Figure 4.14 Confusion matrix of MRI slices of the batch 2 and SPECT slices of the batch 5. .. 69
Figure 4.15 Confusion matrix of MRI slices of the batch 5 and SPECT slices of the batch 5.. . 69
Figure 4.16 Average Accuracy for MRI and SPECT PD vs SWEDD ... 70
Figure 4.17 Accuracy results of Mesencephalon classification - MRI vs SPECT in PD vs SWEDD... 71
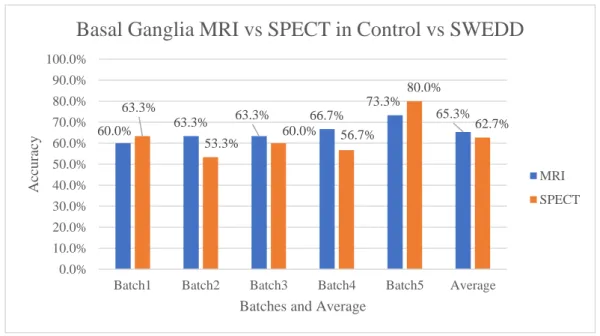
Figure 4.18 Accuracy results of Basal Ganglia classification - MRI vs SPECT in PD vs SWEDD... 71
Figure 4.19 Accuracy results of slices 36_37_38 classification - MRI vs SPECT in PD vs SWEDD... 72
xviii
Figure 4.20 ROC curve and AUC obtained in the classification of mesencephalon slices, in PD vs SWEDD ... 73 Figure 4.21 ROC curve and AUC obtained in the classification of slices 36_37_38, in PD vs SWEDD... 73 Figure 4.22 ROC curve and AUC obtained in the classification of basal ganglia slices, in PD vs SWEDD... 74 Figure 4.23 Confusion matrix of the MRI and SPECT slices of the batch 2. These slices correspond to the mesencephalon (Slices 27_28_29). ... 74 Figure 4.24 Confusion matrix of the MRI and SPECT slices of the batch 5. These slices correspond to basal ganglia (slices 39_40_41)... 75 Figure 4.25 Confusion matrix of the MRI and SPECT slices of the batch 3. These slices correspond to slices 36_37_38. ... 75 Figure C. 1 Example from one control subject of the 79 slices obtained with 3D T1-Weighted MRI images division in Axial plane. ... 118 Figure C. 2 Example from one control subject of the 79 slices obtained with DatTscan SPECT images division in Axial plane. ... 120
xix
List of Tables
Table 2.1 Clinical features of Parkinson’s disease. ... 9
Table 2.2 - Hoehn and Yahr Scale. ... 12
Table 2.3 Findings in structural MRI in PS ... 20
Table 3.1 Exclusion Criteria for Population of the study ... 46
Table 3.2 Characteristics of each classification group ... 54
Table 3.3- Confusion matrix for the calculation of Sensitivity, Specificity and PPV and NPV. 56 Table 3.4 Calculation of Cohen’s Kappa. ... 56
Table 4.1 Subjects demographic information... 58
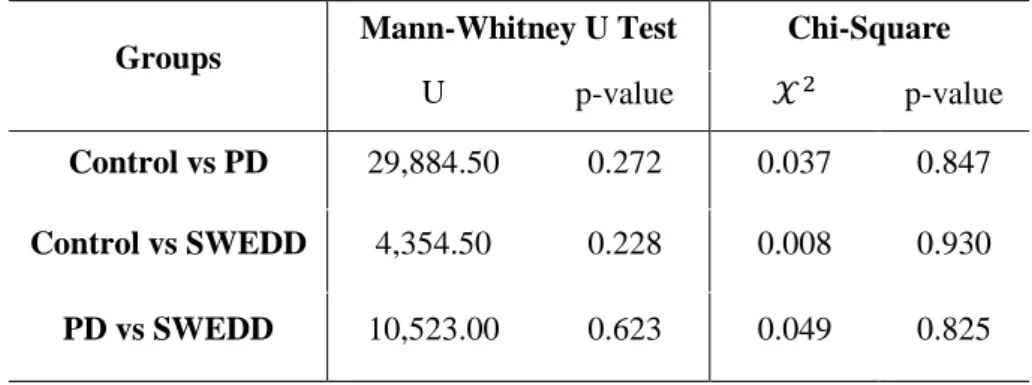
Table 4.2 Test statistics results of Mann-Whitney U Test and Chi-square Test for Control, PD and SWEDD groups ... 58
Table 4.3 Number of slices used for each classification group in Train, Validation and Test .... 59
Table 4.4 Sensitivity, Specificity, PPV, NPV and Cohen's Kappa for Control vs PD using MRI and SPECT images ... 62
Table 4.5 Sensitivity, Specificity, PPV, NPV and Cohen's Kappa for Control vs SWEDD using MRI and SPECT images ... 67
Table 4.6 Sensitivity, Specificity, PPV, NPV and Cohen's Kappa for PD vs SWEDD using MRI and SPECT slices ... 72
Table 5.1 Comparison of studies that performed classification of Control vs PD ... 79
Table 5.2 Comparison of studies that performed classification of Control vs SWEDD ... 84
Table 5.3 Comparison of studies that performed classification of PD vs SWEDD ... 86
Table A.1 T1-weighted MRI and DaTscan images sequence parameters and other critical characteristics. ... 108
Table B. 1 Accuracy results obtained in the classification of Control vs PD with MRI slices . 111 Table B. 2 Accuracy results obtained in the classification of Control vs PD with SPECT slices ... 112
Table B. 3 Accuracy results obtained in the classification of Control vs SWEDD with MRI slices ... 113
Table B. 4 Accuracy results obtained in the classification of Control vs SWEDD with SPECT slices ... 114 Table B. 5Accuracy results obtained in the classification of PD vs SWEDD with MRI slices 115
xx
Table B. 6 Accuracy results obtained in the classification of PD vs SWEDD with SPECT slices ... 116
xxi
Acronyms
AC Anterior Commissure
AD Alzheimer’s Disease
ANN Artificial Neural Networks
AP Atypical Parkinsonism
CBD Corticobasal Degeneration
CBGTC Cortico-Basal Ganglia-Thalamo-Cortical
CNN Convolutional Neural Networks
CPU Central Processing Unit
DaT Dopamine Transporter
DICOM Digital Imaging and Communication in Medicine
ET Essential Tremor
FC Fully Connected
FWHM Full Width at Half Maximum
GE Gradient-Echo
GPe External Globulus Pallidus
GPi Internal Globulus Pallidus
GPU Graphics Processing Unit
HY Hoehn and Yahr
LMDB Lightning Memory-Mapped Database Manager
LSSVM Least Squares Support Vector Machine to classification
MAS Multiple System Atrophy
MDS- UPDRS Movement Disorder Society - Unified Parkinson’s Disease Rating Scale MedCNN Convolutional Neural Networks for Medical Applications
MNI Montreal Neurologic Institute
MNIST Modified National Institute of Standards and Technology
MRI Magnetic Resonance Imaging
NIFTI Neuroimaging Informatics Technology Initiative
OSA Objective Striatal Analysis
PC Posterior Commissure
PD Parkinson’s Disease
MCI Mild Cognitive Impairment
PPMI Parkinson’s Progression Markers Initiative
xxii
PSP Progressive Supranuclear Palsy
ReLU Rectified Linear Unit
RF Radiofrequency
SE Spin-Echo
SGD Stochastic Gradient Descent
SNc Substantia Nigra pars compacta
SNr Substantia Nigra pars reticulata
SOM Self-Organized Map
SPECT Single Photon-Emission Tomography
SPM Statistical Parametric Mapping
STN Substantia Nigra
SVM Support Vector Machine
SWEDD Scans Without Evidence of Dopaminergic Deficit
T1-W T1-Weighted
T2-W T2-Weighted
TE Echo Time
TR Repetition Time
UKPSBB United Kingdom Parkinson’s Disease Society Brain Bank
VBM Voxel-Based Morphometry
1
Chapter 1 Introduction
1.1 Motivation
Parkinsonian Syndromes (PS) are progressive neurodegenerative disorders that mainly affect elderly people [1], [2]. PS, also known as Parkinsonism, are chronic movement disorders that affect the central nervous system and are characterized by motor symptoms such as slow/impairment movement with rigidity and/or tremor [1], [3]. Inside of the group of PS, Parkinson’s Disease (PD) is the second neurodegenerative disorder more frequent in the world and the commonest PS followed by the Atypical Parkinsonism (AP) [1]. AP includes Multiple System Atrophy (MSA), Progressive Supranuclear Palsy (PSP) and Corticobasal Degeneration (CBD) [1], [3]. About of 75% of PS cases are PD, 5% are PSP and 5% are CBD [4].
According to epidemiologic and demographic studies, as world population is increasing as well as aging, it is estimated that PS, specially PD, will drastically increase in the following decades [1]. According to World Health Organization, PD has an incidence rate of 9.7 to 13.8 per 100,000 population per year [5] and approximately a prevalence of 1 million people in United States and in Western Europe [1]. In Portugal, it is estimated that about 18,000 inhabitants are also suffering from this disease [6].
PS are not only characterized by motor symptoms. Patients may also suffer from mood disorders, sleep disturbances, cognitive impairment, urinary incontinence, sexual dysfunction and orthostatic hypotension [1], [5]. However, it is important to notice that these features and the motor symptoms tend only to be manifested at advanced stages of the diseases [1], [7]. At early stages of these diseases, the symptoms are not yet manifested or are very subtle [7]. Besides, when features are manifested even at early-onset, they tend to be very similar between PS and other movement disorders such as Essential Tremor (ET) [8]. Thus, it still is very difficult to differentiate them and have a precise diagnosis [9].
Currently, there are approaches and scales to diagnose PS based on their clinical features, namely the United Kingdom Parkinson’s Disease Society Brain Bank (UKPDSBB) clinical diagnostic criteria [10] and the Hoehn and Yahr Scale [11]. This criteria and scale include motor symptoms and a good response to Levodopa, a PD medicine. PD patients have an excellent response to that medication unlike AP who present poor response [1]. This medication acts in the affected and pathological regions of PS [1].
Pathologically, PS are characterized by a deficit of dopamine that originates motor disorders. The dopamine is produced in the substantia nigra, a structure in the mesencephalon [1] In PS, this structure is degenerated faster than normal when compared with elderly people [1].
2
Despite the fact that PS diagnosis remain clinical, medical imaging have been useful for the study of neurodegenerative diseases [12–14]. For instance, Magnetic Resonance Imaging (MRI) has been used to detect structural changes and distinguish PS and Single-Photon Emission Computed Tomography (SPECT) with Dopamine transporter (DaT) imaging has been used to detect the referred dopamine degeneration and distinguish PS from other motor diseases. Both techniques turn out to be useful in providing neuroimaging biomarkers [1], [12]. In fact, these SPECT images led to the discovered of a sub group of patients early diagnosed with PD that presented Scans Without Evidence for Dopaminergic Deficit (SWEDD) [12], [13], [15], [16]. These subjects are now referred to SWEDD patients. Some studies refer that 10-20% of PD patients are SWEDD patients and point out that this may related with misdiagnosis and instead of PD these patients may suffer from another motor disorder in which there is no substantia nigra degeneration like dystonic tremor [17], [18].
Usually, DaT SPECT images are interpreted visually by experts but the European Association of Nuclear Medicine Neuroimaging Committee recommends that a quantitative analysis should also be performed to improve the interpretation [19], which includes the use of Artificial Intelligence (AI) techniques [16].
AI has recently become an useful tool in the medical field, specially applied in the classification and analysis of neuroimaging data [16], [20]–[22] which includes Convolution Neural Networks (CNN) which are an useful tool for pattern recognition and visual-classification problems and have been used in the study of neurodegenerative disorders [22]–[25].
Therefore, distinguishing early stages PS and other movement disorders with similar symptoms has become a need and a challenge [26]. An early diagnosis not only reduces the economic health care systems costs but also aid in the treatment adjustment since the therapeutics is different for each PS and for the SWEDD patients [5]. Moreover, this will also increase their quality of life of patients [5].
In this study, it is proposed an approach to aid and improve early diagnosis of Parkinson’s Disease and SWEED patients based on a CNN framework using 2D MRI and 2D DaT SPECT images since the conventional medical images, in clinical practice, are 2D images [27] which are faster to acquire than 3D images.
1.2 Goals of the study
The main goal of this dissertation is to classify MRI and SPECT images of PD, SWEDD and healthy subjects using CNN.
3
To achieve this, the following secondary objectives will have to be reached:
1. Extract MRI and DaT (DaTscanTM in this case) SPECT images of the Parkinson’s Progression Markers Initiative (PPMI) database and analyse demographic information about the patients, such as age and sex;
2. Perform MRI and SPECT images pre-processing;
3. Divide MRI and SPECT images into slices of the axial anatomical view; 4. Train, validate and test the CNN model.
With this approach it is intended to aid and to improve the early diagnosis of PD and to understand SWEED and PD imaging differences.
1.3 Dissertation Structure
This dissertation is comprised by this present chapter, the Theoretical Background chapter, the Methodology chapter, the Results chapter, the Discussion chapter and the Conclusions chapter. The present chapter, Introduction, briefly introduce some important concepts used in this dissertation, contextualized the study and enumerate the objectives. In Chapter 2, Theoretical Background, it is explained theorical concepts about PS, MRI and SPECT images and CNN, and it is described the state of the art of MRI and SPECT images in the study of PS and CNN applications in the medical field as well as other algorithms to classify PS. In Chapter 3, the Methodology, the criteria used for the formation of the data set is described as also MRI and SPECT images pre-processing steps, CNN architecture and how these were trained, validated and tested. In Chapter 4, the results obtained are described in the form of tables and representative plots. In Chapter 5, Discussion, the discussion of the results obtained is presented with a brief comparison with other studies. In the last Chapter, the conclusion and future work are presented.
4
Chapter 2 Theoretical Background
In this Chapter, the theoretical concepts related with PS, MRI and SPECT DaTscanTM images acquisition and CNN architectures is described as the state of the art in the PS field including how MRI and SPECT images are used for the study of these diseases and the studies that used CNN as tool for PS classification.
2.1 Parkinsonian Syndromes
2.1.1 The History of Parkinsonian Syndromes
PS has been described since early ages. The first texts found go back to ancient China and India, between 1000 and 500 B.C.[28], [29]. These documents describe symptoms very similar to those in parkinsonism [28], [29].
In 1817, PD was set as a neurological syndrome by the physician James Parkinson who observed and studied six cases of patients with PD, initially know as Shaking Palsy [30], [31] Parkinson described Shaking Palsy patients as having involuntary tremor, decrease of muscular strength and tendency to lean forward [30], [31]. In the middle-to-late of 19th century, Jean-Martin Charcot and his students could describe clinically this disease and discovered that Shaking Palsy patients do not necessarily present tremor as symptom and that these patients were not so weak as previously thought, which made them change the name of the disease for Parkinson' Disease [30]. In 1895, Richer and Miege gave a very important contribution to the understanding of PD progression through the publication of drawings and statues photos that illustrated the disability stages of this disease [30], [32], as illustrated by Figure 2.1.
Figure 2.1 Drawings of the normal and pathologic erect position. a) Normal men have an erect position. Head in the vertical axis, as well as his back b) Parkinsonian patients tend to tilt their heads forward to the foot vertical axis. Adapted from Goetz [30]
2.1 Parkinsonian Syndromes
5
A few years later, Brissaud advanced with the possibility that substantia nigra damage could be the anatomical cause of PD and Greenfield and Bosanquet reported a full pathological analysis of PD as well as Parkinsonism based on brain injuries [30], [33]. Charcot studies also reported that PD patients can also present bradykinesia, that is, slow movements, as the responsible cause for difficulty in performing ordinary daily activities instead of the tremor or rigidity [30], [32], [34]. Moreover, this author discovered that some PD patients differed in their symptoms [32], [34]. Initially, Charcot aimed to distinguish PD from other neurological diseases such as Multiple Sclerosis (MS) [34]. Charcot found that PD patients differ from MS and other diseases by the fact that they present rest tremor, rigidity, very soft speech, bradykinesia and a hunched posture [30], [32], [34]. He and his students were the first to report the atypical features present by some patients. These patients were characterized by an extended posture, a different facial expression and no tremor as shown in Figure 2.2, which are different features from those manifested by PD patients [34]. Because of that, the term Parkinson-plus-syndromes or PS has coined [29].
Figure 2.2 Charcot's drawings at his lesson (June 1888) illustrating Parkinsonian Syndromes. a) Men at left has PD and it is characterized by a curved posture. The men on the right has Parkinsonism with an extended posture. b) These four drawings illustrate an atypical Parkinson’s Disease case of a Charcot’s patient. This patient shows a frightened expression, forehead muscles contracted despite the placid and blank stare of PD patients. Adapted from: [34]
Nowadays, PS include PD, PD with dementia with Lewy Bodies, AP, Secondary Parkinsonism and other neurodegenerative diseases such as Huntington’s disease and Alzheimer’s disease with parkinsonism [1], [3]. As referred previously AP includes MSA, PSP and CBD and, in its turn, Secondary Parkinsonism covers drug-induced, infections and toxins [1].
2.1.2 Clinical and pathophysiology of the Parkinsonian Syndromes
The following lines describes the clinical status and pathology of the PD, MSA, PSP and CBD. Patients with PS usually manifests identical motor symptoms such as bradykinesia, tremor and rigidity [1], [3]. These symptoms are associated with damage in structures responsible for motor control in the brain, namely, basal ganglia., and these injuries depend on the type of PS that the patient has. This damage in the basal ganglia is associated to dopaminergic neurons degeneration and consequently the dopamine deficit in specific brain areas [1], [3], [35].
Since PS are neurodegenerative diseases it is important to briefly explain some concepts related
2.1 Parkinsonian Syndromes
6
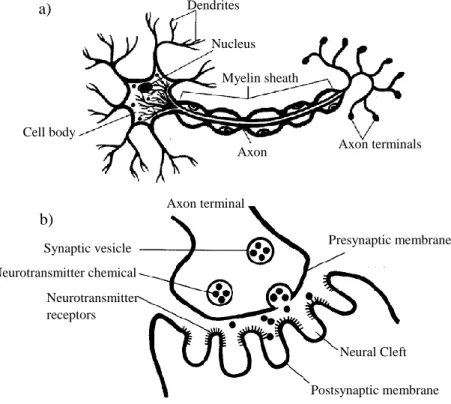
with brain structures before the explanation of PS pathophysiology itself. The brain is comprised by cells called neurons which are small structures that communicate to each other by transmitting stimulus and sensations from the environment and command the body to respond to this stimulus, [36]–[38], as shown on Figure 2.3 a). These cells communicate by sending the stimulus through a contact zone between neurons called synapse [37], [38]. The synapses are divided into two types, electric synapses and chemical synapses. The last ones are the commonest in the brain. In the electric synapses, the neurons terminals are physically connected by protein channels that enable the passage of the electric impulse. In the chemical synapse the impulse electric pass from one neuron to another through chemical substances called neurotransmitters. The axon terminal from the transmitter neuron has a terminal button that contains vesicles with neurotransmitters inside. These vesicles merge with the pre-synaptic membrane and the neurotransmitters are released in the synaptic gap. Then, these neurotransmitters bind to specific receptors located in the postsynaptic membrane in dendrites’ terminations of the receptor neuron. Thus, the electric impulse is propagated through the neuron [37], [38], as illustrated on Figure_2.3 b).
Figure 2.3 Neuron structure and chemical synaptic. a) Normal structure of a neuron b) Chemical synaptic. Neurotransmitters are messengers that send the information from one neuron to other. Adapted from [38]
Regarding PD, this disease is strictly related with neurons degeneration and deficit of dopamine, an important neurotransmitter related with motor control among other functions. [1]
The pathological hallmarks of PD are degeneration of the dopaminergic neurons located at the substantia nigra, as shown in Figure 2.4, reduction of the striatal dopamine, and abnormal
a) b) Dendrites Nucleus Myelin sheath Axon terminals Axon Cell body Axon terminal Presynaptic membrane Neural Cleft Postsynaptic membrane Synaptic vesicle Neurotransmitter chemical Neurotransmitter receptors
2.1 Parkinsonian Syndromes
7
accumulation of protein aggregates, known as Lewy bodies, in injured cells of the substantia nigra, [1], [39]. These pathological features are responsible for the motor symptoms and signs that PD patients present. For instance, the neurodegeneration that occurs in substantia nigra affects all the basal ganglia cycle which, together with thalamus, are responsible for motor control functions. Once the cycle is affected, the information that reaches the motor cortex is not regulated, which leads to changes in movement [1], [40].
Figure 2.4 Substantia nigra a) Substantia nigra of a healthy subject, the presence of the neuromelanin dopaminergic neurons are visible in the image due to its characteristic black color. b) Substantia nigra from a PD patient, wherein the absence of dopaminergic neurons is visible. Adapted from: [12]
In healthy people, the basal ganglia system controls the motor system and avoid involuntary movements. In addition to motor control, basal ganglia are also responsible for cognitive functions and behaviour control [1]. The process of motor control is possible due to connections between basal ganglia structures along with the thalamus and the cortex. This junction responsible for motor control is called the Basal Ganglia model or Cortico-Basal Ganglia-Thalamo-Cortical (CBGTC) loop. The basal ganglia are comprised by two primary inputs, striatum (caudate nucleus and putamen) and subthalamic nucleus (STN), by two primary outputs, internal segment globulus pallidus (GPi) and substantia nigra pars reticulata (SNr) and by two intrinsic structures, external segment globulus pallidus (GPe) and substantia nigra pars compacta (SNc), as shown in Figure 2.5. [1], [41], [42]
Figure 2.5 Basal ganglia structures. a) The color structures indicate the anatomical position in the brain of the basal ganglia, putamen and caudate nucleus b) Names of the structures of the basal ganglia with striatum (putamen and caudate nucleus) and thalamus. Adapted from: [41]
a) b)
2.1 Parkinsonian Syndromes
8
The basal ganglia model is organized into two pathways: the direct pathway and indirect pathway that act together to control the body movements. The direct pathway occurs when the motor cortex is stimulated, for instance, to initiate or perform a movement. In its turn, the indirect pathway stops a movement or prevent the body from doing involuntary movements [1], [42].
In the direct pathway, the motor cortex sends an excitatory stimulus to the striatum and the STN. In its turn, the striatum sends an inhibitory stimulus to GPi and SNr, whereas STN sends an excitatory stimulus to GPi, SNc, and SNr. SNc modulates neuronal firing and equilibrates the basal ganglia cycle by transmitting and increasing dopamine neurotransmitters to the striatum receptors called D1, which will raise the activity in the striatum cells. Thus, the striatum increases the inhibitory stimulus sent to the GPi. In its turn, GPi reduce its activity and does not send any signal to the Ventral Lateral nucleus (VLN) of thalamus which allows it to send excitatory stimulus to the motor cortex and spinal cord to allow motor functions [40], [42].
In the indirect pathway, the striatum and STN also receive the excitatory stimulus from the cortex. Then, the striatum sends an inhibitory stimulus to the GPe and the STN to the SNc. The SNc will increase the dopamine in the striatum in the D2 receptors which lead to a decrease of an inhibitory impulse to the GPi. Consequently, GPi and SNr can send inhibitory signals to VLN. Then, the activity of the motor cortex is decreased, and no movement is executed since VLN cells get the stimulus of inhibition. All this process is illustrated in Figure 2.6 [40], [42].
Figure 2.6 Comparison of the CBGTC from a heathy person and PD patient. The red arrows represent the excitatory stimulus, the blue arrows represent the inhibitory stimulus and the green illustrate dopaminergic neurons. These neurons originate an excitatory stimulus if they are bounded to the D1 receptor or inhibitory if they are bounded to the D2 receptor. In a) there is represented the normal CBGTC. b) illustrates the CBGTC of a subject with PD. In this case, the dashed green lines represent the dopamine deficit which causes an increase of the inhibitory stimulus in the GPe (blue arrow in bold) which lead to motor symptoms. Adapted from:[1]
In PD, the basal ganglia suffer dopaminergic neurons degeneration in the SNc which become pathologically degenerated and leads to the dopamine deficit in the striatum. Consequently, there is an increase of neurons fire in SNr and GPi. These two structures give rises to excessive inhibition of the thalamus and consequently an extreme reduction of the activity in the motor
2.1 Parkinsonian Syndromes
9
cortex that originates the parkinsonian features [1], [40]. These motor symptoms arise when approximately 50% of the substantia nigra has already degenerated [43].
Besides the degeneration of the dopaminergic neurons and the reduction of dopamine in the system, post-mortem studies show an evidence of an abnormal aggregated of specific proteins in the injured neurons, known as Lewy Bodies [1]. These structures have a spherical form and are filamentous inclusions formed by presynaptic protein alpha-synuclein that combines with other components present in the neurons [1], [44], [45]. The reason why this agglomerated forms and why the protein α-synuclein pull out of its binding sites in the presynaptic axon terminal still unknown [44], [45].
To summarize, clinical PD is based on several features that include motor and non-motor symptoms [1]. Non-motor symptoms such as depression and dementia tend to manifest in the last stages of the disease, as shown in Table 2.1[1].
Table 2.1 Clinical features of Parkinson’s disease. This table introduces the clinical features that PD patients manifest through the course of the disease. Anosmia is usually the onset of PD. Motor signals tend to manifest at advanced stages since they are related with degeneration of the SNc. Adapted from [1]
Concerning PD treatment, since the 1960s that this therapy includes a medicine called levodopa [1], [46]. Since artificial dopamine does not cross the blood-brain barrier, a barrier that protects the brain from strange particles and molecules, scientists create levodopa (commonly known as L-DOPA) which is a dopamine precursor. Levodopa is capable of penetrating in the brain and then is converted into dopamine [1], [46]. However, Levodopa has some side effects, namely, nausea, vomiting, and orthostatic hypotension. Moreover, at advanced stages of this illness and with a long-term of taking this medicine, PD patients may manifest excessive involuntary muscle
Clinical features of PD
Principal Motor Features Other Motor Features Non-Motor Features Bradykinesia (2)
Rest tremor (2) Rigidity Gait impairment
Reduced eye blinking Soft voice
Dysphagia
Masked facies (hypomimia)
Anosmia (1)
Sensory disturbances (e.g., pain)
Mood disorders (e.g., depression) (3) Sleep disturbances (1) Autonomic disturbances Cognitive impairment (3) (1) E.g. of symptoms/signals that manifests are early stages of PD
(2) E.g. of symptoms/signals that manifests at middle stages of PD (3) E.g. of Symptoms/signals that manifests at advanced stages of PD
2.1 Parkinsonian Syndromes
10
contractions, which may originate abnormal postures and diphasic dyskinesias [1], [47], [48]. These symptoms appear due to chronic administration of the Levadopa, which causes fluctuations as a decrease of its effect in the organism [1], [49].
Concerning AP and Secondary Parkinsonism, these syndromes are also neurodegenerative diseases but differ from PD since the damage of the neurons can also occur in the striatum and globus pallidus [1]. Besides, these types of parkinsonism do not present Lewy bodies in the neurons of the SNc. [1]. In the beginning, AP and Secondary Parkinsonism patients present a good response to levodopa, but along the disease progression of the disease, the subjects starts to present a poor response [1].
More specifically, MSA can be parkinsonism (MSA-p) or cerebellar (MSA-c) predominant according to their main symptoms [1]. Clinically, MSA-patients can also present autonomic features because the autonomic nervous system is also affected [1], [50], [51]. The autonomic nervous system innervates all the organs of the body and is responsible for maintaining the homeostasis of the body by controlling blood pressure and heart rate [52], [53]. One example of autonomic dysfunctions that these patients manifest is orthostatic hypotension which can cause symptoms such as erectile dysfunction in males or urinary problems [50]. According to Harrison’s Principles of Internal Medicine, “Pathologically, MSA is characterized by degeneration of the SNc, striatum, cerebellum, and inferior olivary nuclei coupled with characteristic glial cytoplasmic inclusions (GCIs) that stain for α-synuclein” [1].
Regarding PSP, also known as Steele–Richardson–Olszewski syndrome, is pathologically characterized by loss of neurons in the striatum, SNc, subthalamic nucleus, midline thalamic nuclei and abnormal inclusions in the tau protein [1], [54]. PSP symptoms are restricted eye movements, gait impairment that leads to falls, and cognitive dysfunctions. These symptoms occur at different stages since it affects different nuclei [54]–[56]. Unfortunately, PSP develops at a very fast pace. The first symptoms usually manifest at the mid-60s with a faster progression that leads to death in 7 years on average [57]. Until now, the advanced age it the only risk factor of this disease [57].
CBD is a rare condition that affects the cerebral cortex and the basal ganglia by loss and atrophy of the neurons [1], [58]. The progression of the disease is slow and occurs during 6 to 8 years [58] and causes dystonic contractions and sensory disturbances. [1]
Overall, there are specific symptoms for each PS. For instance, the absence of tremor, early speech, and gait impairment suggests a possible Atypical Parkinsonism; manifestations of hallucinations and dementia as the first signal as well as Parkinsonian features indicate a Dementia with Lewy bodies; diplopia, impaired down gaze may suggest PSP; predominant orthostatic hypotension may indicate an MSA [1].
2.2 De novo PD patients
11
It is important to notice that the causes of Parkinsonian Syndromes are still unknown. [1], [3], [57] Early onset of PD before the age of 40 may indicate a genetic form of PD caused by genetic factors including gene mutations, especially mutation of the alpha-synuclein gene. However, most of the cases, approximately 85–90%, the factors that induce PD is not known yet. Some studies correlate environmental and lifestyle factors with idiopathic PD, i.e., Parkinson with an unknown cause [1], [59]. For instance, Hwang studied the possibility of the oxidative stress due to neuroinflammation being related to the SNc degeneration [60]. In 2003, H. Braak et al. advanced with the hypothesis that the protein alpha-synuclein arises at the gastrointestinal system and then spreads to the brain through the vagus nerve [39]. However, this lacks more studies and evidence to prove that this process may happen [61].
2.2 De novo PD patients
De novo PD patients is a clinical expression to define a group of PD-patients that either does not receive any Levodopa treatment or were recently diagnosed as having Parkinson’s Disease [62].
2.3 Non-Parkinson’s disease tremor: Essential Tremor
Essential Tremor (ET) is a common movement disorder, monosymptomatic, of unknown cause and sometimes misdiagnosed with neurodegenerative diseases such as PS [1], [63], [64]. ET patients manifest symmetric high-frequency tremor (6–10 Hz) and voice or head tremor but show no evidence of changes in the dopamine in the dopamine system [1], [7], [63].
2.4 State-of-art: diagnosis of Parkinsonian Syndromes
Over the years, several authors have proposed methods for PS diagnosis by elaborating scales that enumerate characteristics and signals for each illness [65]. In this study, only the most common were described.
In 1967, Hohen and Yhar studied the progression and morbidity of patients with parkinsonism and developed a scale of PD progression, the Hoehn and Yhar (HY) Scale, which are nowadays accepted and internationally used [11]. HY Scale enumerates PD stages by describing symptoms that occur at each level. This scale was created to be used in follow-up progression of PD before, during and after treatment and consequently to promote a better evaluation of the therapy [11]. The scale comprises five stages that are based on the symptoms and the clinical degree of disability of the patients. In Table 2.2, the HY Scale is entirely reproduced without alterations. In the 1990s, HY Scale was slightly modified and it was added two intermediary levels: Stage 1.5: “Unilateral and axial involvement ” and Stage 2.5: “Mild bilateral disease with recovery on pull test “ [66]. This modified HY Scale emerged due to HY scale limitations, namely the fact that some patients may manifest the same symptoms at different stages [66]. Despite this, HY scale still be used for medical evaluation worldwide for PD symptom stage evaluation. [66]
2.4 State-of-art: diagnosis of Parkinsonian Syndromes
12
Table 2.2 - Hoehn and Yahr Scale. This scale created in 1967 represents 5 stages of Parkinson´s Disease. Stages I, II and III represent the less levels of disability whereas Stage IV and V represent severe levels of disability. Entirely obtained from [11]
Hoehn and Yahr Scale
Stage I “Unilateral involvement only, usually with minimal or no functional impairment.”[11]
Stage II “Bilateral or midline involvement, without impairment of balance.” [11]
Stage III “First sign of impaired righting reflexes. This is evident by unsteadiness as the patient turns or is demonstrated when he is pushed from standing equilibrium with the feet together and eyes closed. Functionally the patient is somewhat restricted in his activities but may have some work potential depending upon the type of employment. Patients are physically capable of leading independent lives, and their disability is mild to moderate.”[11]
Stage IV “Fully developed, severely disabling disease; the patient is still able to walk and stand unassisted but is markedly incapacitated.”[11]
Stage V “Confinement to bed or wheelchair unless aided.”[11]
In 2003, H. Braak et al. studied 41 cases of subjects clinically diagnoses as PD. Based on the clinical and pathological analysis of the patients, Braak et al. present a study that describes six stages of PD progression and the distinction of the initial, intermediate and final phases of the disease [39]. These stages were formed taking into account the presence of Lewy bodies as well all pathologies and symptoms manifested by patients and related studies. The Braak stages are following described.
• Stages 1 and 2:
In this phase of the illness, PD patients present non-motor symptoms that precede motor symptoms [67]. According to the literature, PD-patients tend to suffer from an impaired sense of smell that arises before the motor symptoms [68], [69]. Thus, one study points out that an early exam of the olfactory performance when this symptom rise could evidence a possible early PD diagnosis [70]. Besides smell impairment, PD patients may also manifest autonomic dysfunctions and Idiopathic Rapid Eye Movement Sleep Behaviour Disorder, during the early stage of the disease [39], [71].
• Stages 3 and 4:
According to Braak et al., the pathology of stage 3 and 4 given by the injuries, i.e., the dopaminergic neurons start to get injured or degenerated which leads to the appearance of motor symptoms[39]. In stage 4, the damage in the olfactory nucleus is getting more severe.
2.4 State-of-art: diagnosis of Parkinsonian Syndromes
13
It also in these two stages, 3 and 4, that Lowy bodies get formed and present in the lesioned neurons [39].
• Stages 5 and 6:
These two stages are the most severe in this disease [39]. In stage five, the pathology reaches areas in the neocortex and prefrontal neocortex. In stage six, the neurodegeneration in the SNc is evident, and the disease develops affecting deeper regions such as the sensory and motor areas [39].
In 2007, Goetz et al. presents a revision of the Unified Parkinson's Disease Rating Scale (UPDRS), one of the most used scales for the clinical study of PD [72]. The UPDRS scale is a questionnaire with several questions divided into four parts concerning disabilities and impairments to classify PD severity [73]. This revision, also known as Movement Disorder Society-sponsored revision of the Unified Parkinson’s Disease Rating Scale (MDS-UPDRS), adds a new section that incorporates nonmotor features of PD [72] and allows the identification of the PD problems that a PD-patient may develop [72], [73]. Part I - Nonmotor Aspects of Experiences of Daily Living includes features of dopamine dysregulation syndrome, urinary problems, and cognitive impairment.; Part II - Motor Experiences of Daily Living contains walking and balance, tremor impact on activities and eating tasks; Part III - Motor Examination includes speech, Hand movements, gait, Postural tremor of hands, rest tremor amplitude and Part IV: Motor Complications covers dyskinesias (involuntary muscle movements) and motor fluctuations [1], [72]-
Nowadays, the most used criteria are the UKPSBC [74]. With 80% of accuracy, UKPSBC were created by the analyses of 100 patients with Idiopathic Parkinson’s Disease [10], [65]. This study found out that some of these patients were misdiagnosed as PD, instead of having this disease, they suffer from some other PS or Alzheimer’s Disease. UKPSBC is formed by three steps. The first step enumerates and characterizes motor symptoms of PS such as bradykinesia or rest tremor, as shown in Figure_2.7. The second step lists pathologies that are not present at PS namely severe dementia at early ages and negative response to PD medication, levodopa. The last step describes signs and characteristics that the patient must have to be diagnosed with PD and includes good response to PD medication Levodopa and rest tremor presence. In this step, the diagnosis is valid when the patient presents at least three attributes [10].
To study mild cognitive impairment in neurologic diseases it is was develop a 10-minute cognitive screening tool called The Montreal Cognitive Assessment (MoCA) [75]. This test analyses cognitive domains such as attention and conceptual thinking [76].
2.4 State-of-art: diagnosis of Parkinsonian Syndromes
14
Figure 2.7 United Kingdom Parkinson’s Disease Society Brain criteria. Elaborated by [77]
For AP such as MSA, PSP and CBD several authors proposed clinical diagnostic criteria based on post-mortem studies and specific features [65]. In 1994, Quinn proposed a diagnostic criteria based on specific features of MSA: Possible diagnostic of MSA includes sporadic adult-onset and poor response to levodopa, and Probable diagnostic of MSA includes Possible diagnostic of MSA and severe autonomic failure [78]. For PSP, Lees describes clinical features that differ PSP from PD, namely the type of response for Levodopa (poor or excellent) and differences between balance, speech and facial appearance in the two illness[56]. Regarding CBD, there are no diagnostic criteria that were validated so far [65], [79].
The first diagnoses of Parkinsonian syndromes were merely based on visual signs and symptoms [1], [30] However, post-mortem studies found a 24% of misdiagnosis [1]. Thus, several clinically criteria such as those mention above have been created. Besides clinical diagnosis, it is also essential to study the pathology of the disease, through methods that may aid in the diagnosis. [80]. Due to this need, medical imaging in Parkinsonian syndromes has emerged to show anatomical and functional changes related to PD pathologies [1].
2.5 Medical Imaging in Parkinsonian Syndromes
15
2.5 Medical Imaging in Parkinsonian Syndromes
Through the years, medical imaging techniques have been aiding physicians and researchers in the study and understanding of PS [1], [25], [26]. Nowadays, the scientific community use several techniques such as MRI including Diffusion Tensor Imaging (DTI) SPECT Positron-emission tomography (PET). This study only focuses on MRI and SPECT [81].
2.5.1 Magnetic Resonance Imaging
In the following lines, the physics behind MRI will be briefly explained. MRI is an anatomical image that represents the structure and the tissues, in this case, of the brain.
MRI is an imaging modality based on physical principles of the atomic nuclei [82]. These nuclei have magnetic properties that can be translated into in a signal that is captured by coils. This signal allows a formation of an image [83]. Usually, hydrogen is the most nuclei used in MRI because it is the most abundant element in the human body, being present in water and lipids [82], [83] The physics behind the formation of this signal relies on the magnetic moment and angular momentum of the nuclei, the hydrogen proton [82]. The magnetic moment gives the magnetic strength and the orientation of the moving electric charge when this charge is interacting with an external magnetic field. When no external influences are applied such as magnetic and electric fields, the proton spins about itself, i.e., rotate around itself [82]. The hydrogen proton is positively charged and has that spinning movement which allow the production of an electric current that creates magnetic movement. The angular moment is then created due to the mass of the rotating proton multiplied by its angular velocity. [82]
In MRI a constant magnetic field is applied to the body, in this case, the head, to gives a precession movement and a specific orientation to protons that were previous randomly orientated as illustrated in Figure 2.8 [82], [83]. These protons can be orientated parallel or antiparallel to the constant magnetic field applied. The parallel protons have lower energy while antiparallel protons have higher energy level.
Figure 2.8 Proton orientation in MRI. a) Protons randomly oriented in free space b) Protons oriented according to the magnetic field. The protons which are aligned with the magnetic field are represent in blue.
The process movement is the same as the gyroscopic motion but in this case the proton process due to the constant magnetic field and its orientation, as shown in Figure 2.9.
a) b) Ma g net ic Fi el d
2.5 Medical Imaging in Parkinsonian Syndromes
16
Figure 2.9 Precession Movement. The proton rotates around the direction of constant magnetic field.
The MRI techniques measure the magnetization of all spins in the free space. The magnetization can be represented by one vector with two components, the longitudinal and the transverse [82]. The longitudinal component has the same direction as the constant magnetic field while the transverse component is perpendicular and has the zero value. When all the protons are aligned with the magnetic field, parallel or antiparallel, one pulse sequence perpendicular to the magnetic field is applied to the system. The pulse sequence is characterized by radiofrequency (RF) pulses and gradient pulses, which control timings and other parameters that allow the acquisition of the image [82], [83]. This pulse changes the amplitude of the longitudinal and transversal magnetization, by changing the magnetization of the longitudinal axis to the transverse plane. During the pulse, all protons are in the transverse plane, rotating with the same phase [82]. After pulse application, the magnetization tends to return to the equilibrium position and occurs transverse relaxation and longitudinal relaxation. The transverse relaxation also known as spin-lattice relaxation is the decrease of net magnetization because of the loss of spins coherence of the protons [82]. In its turn, the longitudinal relaxation or spin-spin relaxation is the recuperation of the net magnetization along the horizontal axis because the protons tend to return to the equilibrium state, parallel to the magnetic field [82]. In MRI signal, these events are traduced by two relaxation times T2 and T1. In MRI signal, these events are traduced by two relaxation times T2 and T1. T2 is a time constant that represents the exponential decay of the net magnetization in the transverse wherein protons spin at different phases, as shown in Figure 2.10 [82].
Figure 2.10 Illustration of the T2 decay. During the pulse sequence the spins are perfect aligned. Once the pulse sequence is turn off, protons lose their phase coherence and gain different orientations. Adapted from [85]
The recovery phase of the longitudinal magnetization is given by the time constant T1 which indicates the time that protons took to return to the equilibrium state before the excitation caused by the radiofrequency pulse, as illustrated in Figure 2.11 [82].
Ma g net ic Fi el d T2
2.5 Medical Imaging in Parkinsonian Syndromes
17
Figure 2.11 Illustration of T1 recovery. The spins, initially in the transverse plan, return to the initial position and orientation in the longitudinal axis, represented as z in the image. Adapted from [82]
During the image acquisition, the constant magnetic field is always turn on and may have slight differences in its intensity, which originate spatial inhomogeneities since the spins will be processing at different speeds. [82]. This event is translated by the time constant T2*. T2* reflects the quickly lost of coherence between the spins due to the spatial inhomogeneities [82].
T1 and T2 values depend on the proton density of the tissues. T1 is always bigger than T2. Tissues with a high number of hydrogen protons have long t1, e.g., fluids have longer T1 than T2 [83]. The contrast of the MRI images is related to T1 and T2 parameters and Proton density [82], [83]. Each constant time gives different structure contrast to each image. Thus, the images can be T1-Weighted (T1-W), T2-T1-Weighted (T2-W) and Proton Density weighted. These images are produced using Spin-Echo (SE) or Gradient-Echo (GE) which are pulse sequences. These pulse sequences are related with two concepts, Repetition Time (TR) and Echo Time (TE), respectively. The contrast in MRI is possible due to variations in TR and TE [83]. The SE sequence comprises an echo with two RF pulses. In its turn, the GE is formed by one RF pulse followed by one gradient that creates the echo. In both sequences, the echo measures the intensity of the signal. The function of the gradient is used to accelerates spins dephasing [82].
T1-W images give information about the RT of each tissue and are characterized by an intermediate TR and a short TE. These images are brighter in voxels containing tissues with short T1 because the spins in these tissues are the first to recovery to longitudinal magnetization and darker in voxels comprising tissues with long T1. For instance, the white matter is very bright, the water-based tissues such as grey matter are mid-grey and the fluids are dark. Thus, T1-W images shows the boundaries between the tissues and fat-based tissues [83].
T2-W have long T1 and intermediate TE. In this cases, the grey matter and fluids get bright and the fat-based tissues get dark since the spins had totally recovered [82]. PD Weighted images allows to distinguish fluid from cartilage [83].
2.5 Medical Imaging in Parkinsonian Syndromes
18
2.5.2 State-of-the-Art: T1-Weighted and T2-Weighted images in PS
MRI is usually used as routine to differentiate symptomatic parkinsonism from controls and to detect if there are any cerebrovascular damage causing the PS features [14].
On the one hand, according to the literature, anatomical changes in early-PD are very subtle in structural MRI [81], [84]. For instance, T1-W images present poor contrast in regions of interest areas such as STN and GP which difficult the detection of pathological anatomic findings [81], [84], [85].
On the other hand, the literature also describes MRI findings in structural alterations in PD brains. Due to the high quantity of iron present in these structures, the T1 value is short and consequently T2-W and T2*-Weighted images allow the detection of changes in structures like STN and GP[85]. Moreover, a study with 27 individuals with PD that filled Unified Parkinson's Disease Rating Scale and HY scale, pointed out for a reduction of 11% putamen in volume and 8% in caudate volume in PD when used a high-resolution 3T structural T1-W images when compared with control group. Nevertheless, this study also indicated that it is still unclear the relationship between the volume reduction and the dopamine deficit. [86]
Concerning SNc degeneration in PD, some studies report no evidence of volumetric changes in SNc of patients [87], [88]. Minate and colleagues found alterations in the SN of PD patients and in T1 value in comparison with the control group. However, the authors conclude that these differences in SN of PD patients were also influenced by the midbrain size variability for each subject [89].
According to the literature, increasing the magnetic field in MRI image acquisition may improve structural image quality. Kwon et al. use a 7T magnetic field to acquire T2*-weighted MRI images of the SN from 10 PD-patients and 10 control subjects. The authors report that the shape of the substantia nigra of PD patients differs from Control individuals. Moreover, they also identified an increase of the hypointensity of the MRI signal due to a rise in the volume of the SN in Patients. The increase of the SN shape is related to high concentrations of iron in PD-patients, unlike Control subjects which are translated in variations in T2*-weighted MRI signal [90].
To aid in the detection of structural changes in MRI some techniques have been used, such as Voxel-Based Morphometry (VBM). VBM is an MRI technique that allows the analysis of focal brain anatomic differences between healthy and patients subjects. VBM uses image processing methods such as spatial normalization and segmentation into grey matter, white matter, and Cerebrospinal fluid[84], [91]. Using VBM, Burton et al. analyzed T1-W MRI scans from 26 PD-patients and 26 PD-PD-patients with dementia with the aim to investigate brain volume loss. The
2.5 Medical Imaging in Parkinsonian Syndromes
19
study reported that PD-patients presented a reduction of grey matter volume in the frontal lobe comparatively to the control group. Regarding PD-patients with dementia, a loss of volume in the grey matter of the temporal lobe was found [92]. Other studies with PD patients identified reduced grey matter in the right side of the hippocampus and in the left superior temporal gyri, loss of volume in the olfactory bulb and volume reduction in grey matter in brain areas related with the olfactory system such as inner olfactory cortex and amygdala [93], [94]. The authors conclude the volume changes in the olfactory system agrees with the stages hypothesis of Braak. [39], [93]. Moreover, one study that used volumetric analysis and segmentation applied to T1-W images of PD patients reported volume reduction of the bilateral putamen in comparison with the control group [95] and Tinaz et all. applied an automated reconstruction method to T1-W images of PD-patients and found a reduction volume of the striatum [96]. These findings are related with PD pathology and motor symptoms.[1] However, one study that also used T1-W images as well, reported mean striatal, cerebellar and brainstem volumes remain normal in comparison with control [97].
Even with these findings, MRI is mostly used to distinguishing atypical syndromes from Parkinson's disease due to limited and subtle changes in early-PD brain structures. Nevertheless, new approaches to MRI pointed that this medical imaging technique may help in the discrimination of nigral degeneration and its progression. [98]
In Atypical Parkinsonism, MRI has been used to detect changes in PSP, MSA and CBD [99]. According to the literature, the most affected areas in these syndromes are basal ganglia, brainstem, cortex and cerebellum. The atrophy and changes in these regions originate alterations in MRI signal relatively to healthy subjects and PD-patients. [100], [101] The Table 2.3 summarize the some of the findings achieved so far and present the in literature. [13], [99] To sum up, Meijer et al. analysed several studies and proposed that MRI should be a tool to aid in PS diagnosis [14]. According to them, T1-Weighted may be used to detect brain atrophy and tissue loss but have some limitations, namely, poor contrast in some areas due to low sensitivity to signal intensities changes. Regarding T2-Weighted images, those are useful to detect changes in the basal ganglia which are detected by signal intensity changes in MRI [14].