www.atmos-meas-tech.net/4/2359/2011/ doi:10.5194/amt-4-2359-2011
© Author(s) 2011. CC Attribution 3.0 License.
Measurement
Techniques
Retrieval of stratospheric aerosol density profiles from
SCIAMACHY limb radiance measurements in the O
2
A-band
B. Ovigneur, J. Landgraf, R. Snel, and I. Aben
Netherlands Institute for Space Research (SRON), Utrecht, The Netherlands
Received: 15 February 2011 – Published in Atmos. Meas. Tech. Discuss.: 15 March 2011 Revised: 3 October 2011 – Accepted: 14 October 2011 – Published: 2 November 2011
Abstract. In this paper we present an approach to retrieve stratospheric aerosol number densities in the altitude range 10–40 km from SCIAMACHY limb radiance measurements in the spectral range of the O2A absorption band, near 760 nm. Here, the characteristic light paths differ for the measured light in the O2A-band and in the spectral contin-uum next to the absorption band. This difference is used to distinguish the effect of stratospheric aerosol scattering and ground reflection on the limb measurement. The capability to disentangle both effects is illustrated for SCIAMACHY limb observations over the Libyan desert, where the measure-ments are not affected by tropospheric clouds. Comparison of the SCIAMACHY retrieval and the SAGE II aerosol ex-tinction product between 75◦southern and northern latitude shows the clear need for prior knowledge of the mean size of the stratospheric aerosol for the SCIAMACHY retrieval. We found best agreement between SCIAMACHY and SAGE II aerosol extinction for the period 2003–2005 for a prior choice of the mean aerosol size radius of 0.2 µm. The over-all agreement between both data sets is in the range<50 % root mean square difference at 14–30 km with a minimum of 30 % at 22 km.
1 Introduction
Fifty years ago, Junge and Manson (1961) reported balloon-borne measurements of the abundance of stratospheric aerosol. Junge and Manson observed a general decrease of the aerosol particle concentration with altitude, but just above the tropopause a layer of larger particles was detected with a
Correspondence to:J. Landgraf ([email protected])
vertical extension of several kilometers. This so-called Junge layer consists of supercooled sulfuric acid droplets with dif-ferent weight percentages of H2SO4in the aerosol and with varying size between 0.1 and 1 µm in diameter.
An important source of the stratospheric aerosol are vol-canic eruptions, which can inject a large amount of SO2into the stratosphere, where it is photo-oxidized to sulfuric acid (Hofmann and Rosen, 1983; Oberreck et al., 1983; Deshler et al., 1992, 1993). Hence, volcanic stratospheric aerosol in-fluences directly the heat budget of the atmosphere by ab-sorbing, scattering and emitting radiation depending on their optical properties (Mugnai et al., 1978; McCormick et al., 1995; Solomon, 1999). Close to the tropopause the strato-spheric aerosol may affect the formation of cirrus clouds and so it can have an indirect effect on climate and atmospheric photochemistry (K¨archer and Str¨om, 2003; Penner et al., 2009). Non-volcanic sources of stratospheric aerosol include the transport of OCS from the lower atmosphere to the strato-sphere, where it is photochemically transformed into SO2 (Crutzen, 1976). At present, it is still an outstanding ques-tion whether human activities significantly affect the strato-spheric aerosol abundance (Hofmann et al., 2009). Next to its climate relevance, stratospheric aerosol interacts with nitrous oxide and chlorine reservoir species (Crutzen, 1970; Fahey et al., 1993) and even small enhancements of the background aerosol level are sufficient to repartition the ozone balance. Thus it is difficult to assess long-term ozone trends without sufficient knowledge on stratospheric aerosol variability.
1
2
surface
atmosphere
instrument line of sight
tangent
point
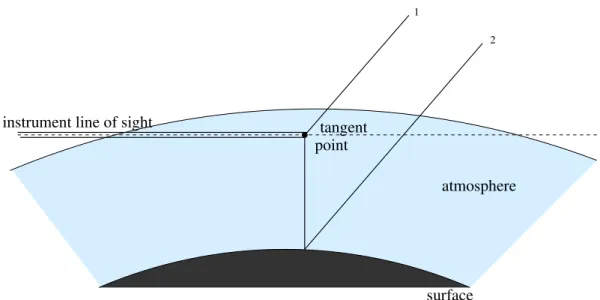
Fig. 1.Two relevant light paths for limb observations in the longwave visible and near infrared. The effect of multiple atmospheric scattering is not presented.
I, McCormick et al., 1982) was launched as the first of a series of three missions dedicated to measure stratospheric aerosols. SAGE I was operational for 34 months. In 1984 and 2001, the SAGE mission got continued with the launch of SAGE II (Mauldin et al., 1985; Bingen et al., 2004a,b) and of SAGE III (Yue, 2000; Chu et al., 2002). After nearly 21 yr, the SAGE II instrument was powered off in 2005. The Meteor-3M mission, along with the SAGE III instrument, was terminated shortly after, in 2006. The Improved Limb Atmospheric Spectrometer-II (ILAS-II) onboard the Advanced Earth Observing Satellite-II (ADEOS-II) was successfully launched in 2002 which also observed the atmo-sphere through solar occultation. However after 10 months ADEOS-II lost its function, and only seven months of data were acquired by the measurements of vertical profiles of aerosol extinction coefficients (Saitoh et al., 2006). Still functional is the Atmospheric Chemistry Experiment (ACE, Bernath et al., 2005) which was launched 2003. Overall this unique series of satellite missions provides a set of more than 40 yr of solar occultation measurements of stratospheric aerosols.
Solar occultation measurements allow a straight forward and robust retrieval of aerosol extinction profiles but with the downside of spatially sparse measurements. Alternatively, one can observe stratospheric aerosol from space employing limb viewing geometry, which generally provides a better ge-ographic coverage. The OSIRIS (Bourassa et al., 2007) and SCIAMACHY (Bovensmann et al., 1999) spectrometers are both limb sounding spectrometers. They were launched in 2001 and 2002, respectively, and are both still fully opera-tional. SCIAMACHY is a grating spectrometer, whose pri-mary mission objective is to perform global measurements of trace gases in the troposphere and in the stratosphere. It
measures the solar radiation in nadir, limb and occultation geometry, where the light is attenuated along its path through the Earth atmosphere. The relatively high spectral resolu-tion (0.2 nm to 0.5 nm) between 240 nm to 1700 nm, and in selected regions between 2000 nm and 2400 nm, makes it suited for the detection of stratospheric aerosols (see also Taha et al., 2011). In this paper we present a novel approach in order to retrieve stratospheric aerosol density profiles from SCIAMACHY limb measurements in the O2A-band. In this spectral range the different atmospheric paths of the mea-sured light allows to disentangle the effect of aerosols and surface reflection on the limb measurement. So, an effec-tive Lambertian surface albedo and a vertical distribution of aerosol density between 10 and 35 km can be retrieved simul-taneously from SCIAMACHY limb radiance measurements. This paper is structured as follows: Sect. 2 analyzes the ef-fect of stratospheric aerosols on SCIAMACHY limb mea-surements over the Libyan desert between 2003 and 2009. Section 3 describes the retrieval approach and in Sect. 4 the retrieval results are discussed, including a comparison with spatially co-located SAGE II measurements. Finally, the paper is summarized in Sect. 5.
2 Effect of Aerosols on SCIAMACHY limb observations
2005 2006 2007 2008 2009
t[year]
0.010 0.015 0.020 0.025 0.030 0.035
I/F
0
[1]
Measurement
0 alb. ; 0 aer.
alb
alb. + aer.
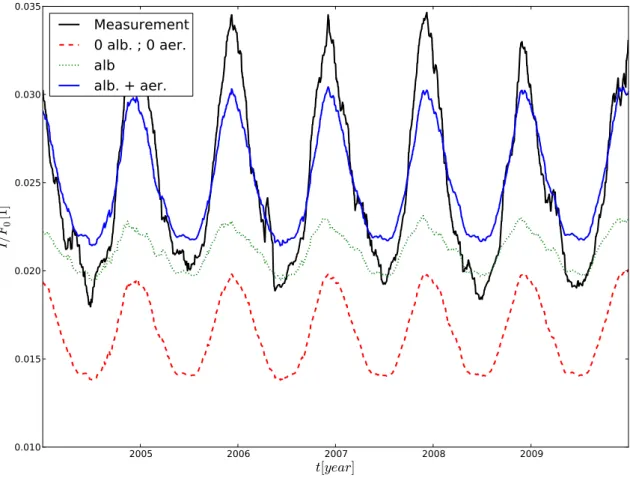
Fig. 2.SCIAMACHY limb radiance measurements at 500 nm over the Libyan desert for tangent height of 25 km as a function of time (black solid line). The Figure shows also three different model simulations using the solar and viewing geometry of the limb observations: for only Rayleigh scattering and no surface reflection (red dashed line), for only Rayleigh scattering and a Lambertian surface albedo of 0.30 (green dotted line), for Rayleigh and background aerosol scattering and a Lambertian surface albedo of 0.30 (blue solid line).
the measured light is mainly direct sunlight which is either scattered at the tangent point in the SCIAMACHY view-ing direction, or reflected at the Earth surface and subse-quently scattered in the instrument’s line of sight (see Fig. 1). Here the light can be scattered either by air molecules or stratospheric aerosols. At 500 nm atmospheric absorption by ozone is weak and thus its effect on the measurement is small. The Libyan desert is located around 23◦ north-ern latitudes and so, the solar zenith angle varies between 27◦in summer and 70◦ in winter at the time of the SCIA-MACHY observation. For the limb viewing geometry of SCIAMACHY this causes a variation of the scattering an-gle of singly scattered light at the tangent point between 55◦ in winter and 100◦ in summer. It means that in winter the single scattering geometry is closer to the forward peak of the scattering phase function than in summer. As a result the SCIAMACHY limb radiance varies seasonally as depicted in Fig. 2 for a tangent height of 25 km. To illustrate the different effects of aerosol scattering, Rayleigh scattering, and surface reflection on the measurement, the figure shows different limb radiance simulations for the corresponding
measurement geometries. Here we employ the full spherical scalar radiative transfer model of Walter et al. (2006), which includes multiple scattering of light. For an aerosol free at-mosphere without surface reflection (red dashed line), the measurements are significantly underestimated by the ulations. Also, the seasonal variation is too weak in the sim-ulation. Enhancing the surface albedo to 0.30 increases the modeled radiance level, but reduces the seasonal variability (green dotted line). The upward radiance at surface level due to Lambertian reflection of the direct solar beam is propor-tional to the fluxµoFoexp(−τo)whereµois the cosine of the local solar zenith angle,Fois the extraterrestrial solar ir-radiance, andτois the optical thickness along the solar beam from top of the model atmosphere to the surface. At 500 nm,
Fig. 3.Profile of aerosol particle density adopted from Loughman et al. (2004). The upper panel shows the stratospheric part of the profile and lower panel the tropospheric part. The profile refers to a background load of stratospheric aerosol.
background aerosol to the model atmosphere. Here, the aerosol optical properties are adopted from Loughman et al. (2004) and the corresponding stratospheric aerosol density profile is shown in Fig. 3. Due to the strong forward peak of the aerosol scattering phase function, stratospheric aerosols enhance the seasonal variation of the simulation by increas-ing the sincreas-ingle scatterincreas-ing signal durincreas-ing the winter months.
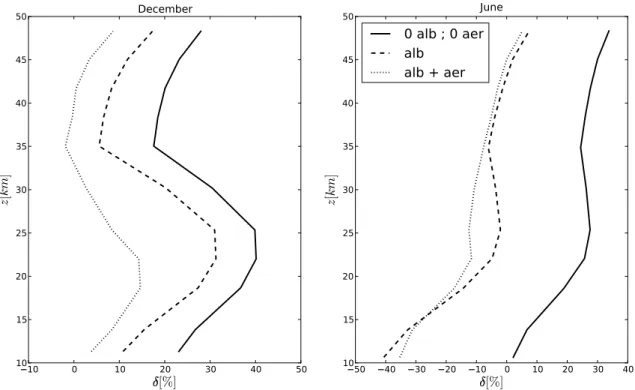
To compare SCIAMACHY measurements and simulations at different tangent heights, we consider the mean Decem-ber and June radiances for the period 2004–2009. Figure 4 shows the difference between the measurement and different model simulations as a function of height. Ignoring surface reflection and scattering by stratospheric aerosol results in an underestimation of the measurements by the simulations.
During the winter month the effect is largest around 20– 25 km, which hints at the presence of stratospheric aerosols. Surface reflection with an Lambertian albedo of 0.30 en-hances the simulation by about the same fraction at all al-titudes. This can be explained by the fact that at 500 nm atmospheric absorption and scattering are weak and so, the relative contribution of light that is reflected at the surface is only governed by the scattering properties at the satel-lite line of sight. The extinction of light between the sur-face and the scattering point on the line of sight is of little relevance. When we introduce a stratospheric background aerosol in the simulation, we also see an increase of the ra-diances, which is largest around 20–25 km. Due to that, we
expect that adjusting both the surface albedo and the aerosol profile in the lower stratosphere may lead to an improved fit to the data.
Also for the summer month, an albedo of 0.30 enhances the simulated limb radiance signal by nearly the same frac-tion at all altitudes. However, the aerosol effect is much smaller and causes only a significant change in the limb radi-ance between 20 and 35 km, which hints at a reduced aerosol sensitivity of SCIAMACHY limb measurements for high so-lar elevation during summer months.
Figures 2 and 4 indicate that a proper description of SCIA-MACHY limb radiance measurements requires knowledge of both the surface albedo and stratospheric aerosol abun-dances for each individual sequence of limb measurements. Normalizing the limb radiances with respect to a higher tan-gent height removes a significant part of the albedo sensitiv-ity of the measurement, but retains the sensitivsensitiv-ity to strato-spheric aerosols. This approach is chosen e.g. by Taha et al. (2011) to retrieve stratospheric aerosol abundances. This pa-per presents a different approach, where both surface albedo and stratospheric aerosol density profiles are retrieved si-multaneously from SCIAMACHY limb measurements at the spectral range of the O2A-band, near 760 nm. In this man-ner, one fully accounts for the sensitivity of the limb radi-ance measurements with respect to both surface reflection and stratospheric aerosol scattering.
3 Retrieval approach
10 0 10 ✁20 30 40 50
[%]
10 15 20 25 30 35 40 45 50
z
[
km
]
December
50 40 30 20 10 0✁10 20 30 40
[%]
10 15 20 25 30 35 40 45 50
z
[
km
]
June
0 alb ; 0 aer
alb
alb + aer
Fig. 4. Differences between monthly mean SCIAMACHY radiances and model simulations (measurement – simulation) as a function of tangent height for December (left panel) and June (right panel) for the period 2004–2009. The model configurations are the same as in Fig. 2.
measurement biases like spatial straylight increases. More-over, limb measurements at high tangent heights are affected by stratospheric aerosols because of the extinction of light by aerosol scattering along the second light path in Fig. 1. De-pending mainly on solar geometry the aerosol optical depth along this light path can be significant and so a seasonal bias can be introduced.
Alternatively, we propose to use limb measurements at different absorption depths of the O2A-band including the spectral continuum. Assuming a constant surface albedo over wavelength, one is able to disentangle the measurement information on albedo and on aerosol concentration due to the different penetration depth of light. For the retrieval the forward modelF in
y=F(x,b)+ey (1)
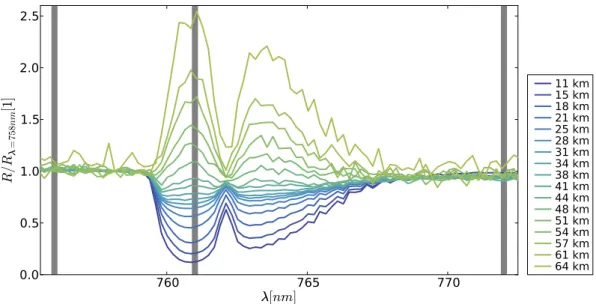
has to be inverted, whereyis the measurement vector, andx is the state vector, which has the parameters to be retrieved as its components. The forward model parameter vectorb con-tains other model parameters, which have to be chosen a pri-ori, andeycombines measurement and forward model errors. For this study, we use SCIAMACHY level 1b version 7 data. The measurement vector is defined by a limb scan with tan-gent heights between 9.5 and 40 km and at three wavelengths, 756, 761, and 772 nm. The shortest and longest wavelength belong to the spectral continuum, whereas the center wave-length is subject to strong oxygen absorption at the lower and middle stratosphere. The height range of the retrieval is determined by two aspects. First, most of stratospheric
aerosol is located below 30 km, and so the retrieval captures the most relevant height range. Also, Fig. 5 illustrates that above 44 km the O2A-band is observed as emission lines in the spectrum. The source of this emission is dayglow which typically originates from direct photodissociation, photoex-citation, and excitation by fast electrons, or ion recombina-tion (Buchholtz et al., 1986; Slanger and Copeland, 2003). Because atmospheric emission is not taken into account by our forward model we consider only limb measurements be-low 40 km tangent height for the retrieval. The retrieval er-ror which is caused by neglecting atmospheric emission is estimated in Sect. 4.
760
765
770
✂[
nm
]0.0
0.5
1.0
1.5
2.0
2.5
R/R
✄=
758
nm
[1]
11 km
15 km
18 km
21 km
25 km
28 km
31 km
34 km
38 km
41 km
44 km
48 km
51 km
54 km
57 km
61 km
64 km
Fig. 5.SCIAMACHY limb radiance measurements in the O2A-band normalized to the radiance at 758 nm for different tangent heights. The vertical lines indicate the wavelengths used in the retrieval.
The state vectorx of the retrieval consists of the Lam-bertian surface albedo and the aerosol density profile, grid-ded on 3.3 km thick layers between 10 and 40 km. Here, the layer thickness is chosen such that each aerosol element of the state vector can be assigned one-to-one to a limb mea-surement. Above 40 km, we assume an exponential aerosol height distribution with a relative decrease exp(−c1z)with
c=6·10−5m−1. 1zrepresents the altitude difference with respect to 40 km altitude. The model parameter vectorb con-tains the description of the aerosol micro-physical proper-ties. For this study, we assume that the stratospheric aerosol consists of spherical droplets of 25 % sulfuric acid and 75 % water. The aerosol size is described by a mono-modal log-normal distribution function with a variance of 0.25 µm and with an effective radius of 0.10, 0.15, 0.20, and 0.35 µm for different retrieval scenarios. Using Mie theory, the extinc-tion coefficient, the scattering coefficient, and the scatter-ing phase function are calculated for a refractive index of
r=(1.427,0.000)at 756 nm (d’Almeida et al., 1991). Sur-face pressure and temperature profiles are taken from the three-hourly forecast of the European Centre for Medium-Range Weather Forecasts (ECMWF) model, and have been interpolated to the SCIAMACHY overpass time and foot print (cf. http://www.knmi.nl/samenw/tosti/). The absorp-tion cross secabsorp-tions of molecular oxygen are adopted from the Hitran 2008 data base (Rothman et al., 2009).
With the defined state vectorx and the model parameter vectorb, Eq. (1) is inverted by combining a Gauß-Newton iteration with a linear least squares minimization for each iteration step,
ˆ
xlsq=min x ||S
−1/2
y {˜y−Ksscx}|| (2)
withy˜=y−F(xo,b)+Ksscxoand the measurement covari-ance matrixSy. Here, the forward model Jacobian is approx-imated by its single scattering contributionKsscandxois the solution of the previous iteration step. The solution of the inversion problem (2) can be expressed by
ˆ
xlsq=G˜y (3)
with the gain matrixG=KTS−y1KKTS−y1. The statistical er-ror on the solutionxlsqˆ due to the measurement noise, i.e. the retrieval noise is described by the covariance matrix
Sx=GSyGT. (4)
Convergence of the iteration is tested by comparing theχ2
values between measurement and simulation for two consec-utive iteration stepsn−1 andn. For a maximum number of nine iteration steps convergence is achieved when
|χn2−χn2−1|<0.1χn2. (5) Otherwise data are rejected. A more stringent convergence criterion did not improve the quality of the retrieved aerosol profiles.
4 Results
Retrieval over Libya
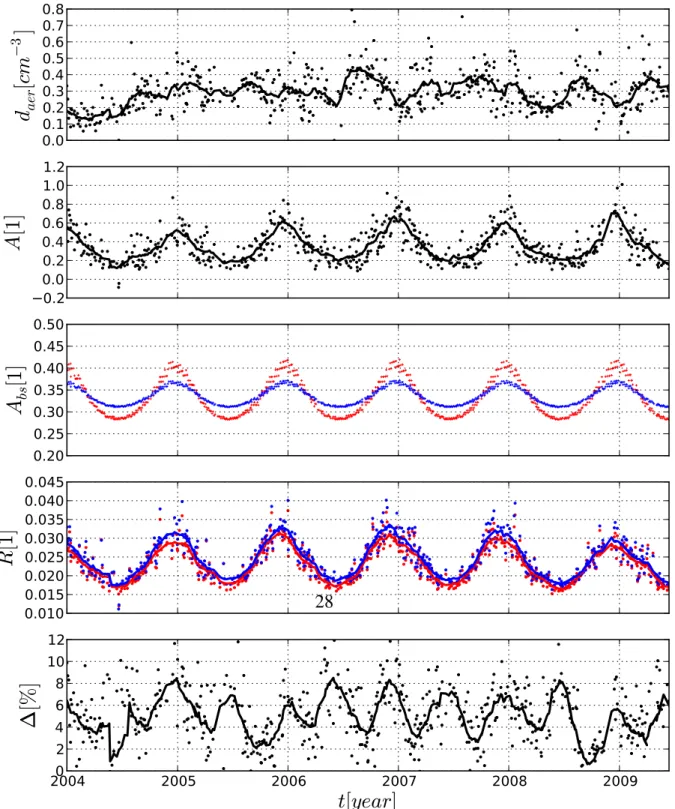
0.0 0.1 0.2 0.3 0.4 0.5 0.6 0.7 0.8
d
ae
r
[
cm
☎3
]
✆0.2
0.0 0.2 0.4 0.6 0.8 1.0 1.2
A
[1]
0.20 0.25 0.30 0.35 0.40 0.45 0.50
A
bs
[1]
0.010 0.015 0.020 0.025 0.030 0.035 0.040 0.045
R
[1]
2004 2005 2006 2007 2008 2009
t
[
year
]
0 2 4 6 8 10 12
✝
[%]
28
25 km height, assuming a size of 0.35 µm effective radius. The mean aerosol density is about 0.3 particles cm−3, which is a typical stratospheric background concentration at this altitude (e.g. Bingen et al., 2004b). Since the launch of SCIAMACHY, there has been no major volcanic eruption with significant stratospheric sulfur injection in the tropical and subtropical region and so, the mean retrieved values re-flects the present stratospheric abundance. The time series shows a spread of the data around its monthly running value
≈0.1 particles cm−3. This is significantly above the retrieval noise level<0.01 particles cm−3at 25 km for a typical scat-tering angle between 40◦ and 80◦ for this geolocation (see the discussion of Fig. 11 later in the paper). For the time series in Fig. 6 the provided SCIAMACHY tangent height varies only by±100 m. This means that the depicted time series shows measurements at slightly different altitudes and assuming the gradient in the aerosol density profile of Fig. 3 the corresponding fluctuation in the aerosol density is below 0.015 cm−3. In addition, the limb altitude pointing error of SCIAMACHY of a few hundred meters (von Savigny et al., 2005) is not sufficient to explain the spread of the aerosol density as shown in the figure. Thus we can rule out vari-ations and errors of the tangent height to explain this fea-ture. To our knowledge stratospheric aerosol at this altitude does not vary on these short time scales and so, we have to attribute this variation mainly to the effect of measurement biases and forward model errors on the retrieval.
To assess the spectral consistency of the retrieved aerosol properties, we look into the simulations of SCIAMACHY limb radiance measurements at 500 nm in the visible part of the solar spectrum. From these measurements, we determine a Lambertian surface albedo using a least squares inversion. In this manner, we account for the spectral variability of sur-face reflection between the visible and the spectral range of the O2 A-band. Moreover, for the radiance simulation the aerosol properties were used, which were retrieved before-hand from SCIAMACHY O2 A-band measurements. Fig-ure 6 shows SCIAMACHY measFig-urements and correspond-ing radiances simulation at 500 nm. At this wavelength and for small scattering angles the limb radiance has significant sensitivity to stratospheric aerosol. In addition, the measure-ment is only little affected by ozone absorption at the Chap-puis absorption band ranging from 440 nm to 1180 nm. So uncertainties in the stratospheric ozone profile are of minor relevance in this context. The lowest two panels of Fig. 6 indicate a small underestimation of the measurement by the simulation of about 5 % (±5 %). This is slightly larger than the spectral residuals of the aerosol fit in the O2 A-band (about 3 % in the continuum). One possible explanation is the prior choice of aerosol micro-physical properties for the measurement simulations which is not fully suited to de-scribe the correct wavelength dependence. Nevertheless, the retrieved vertical aerosol distribution improves significantly the SCIAMACHY limb measurement simulations in the vis-ible. Keeping in mind that limb radiance measurements at
the center of the Chappuis ozone band are used to retrieve ozone in the lower stratosphere (see e.g. von Savigny et al., 2003) the improved forward simulations may be beneficial for these retrievals.
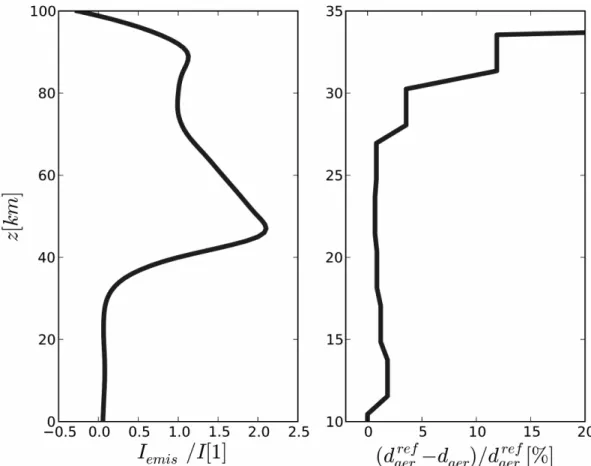
Fig. 7. (left panel) Relative contribution of the emission signalIemis to a SCIAMACHY limb radiance measurements for a representative retrieval over the Libyan Desert. The emission signal is estimated as described in Sect. 4. (right panel) Effect on the aerosol retrieval when atmospheric emission is neglected in the retrieval. Here,daerrefis the retrieved aerosol density when emission is added to the measurement simulations anddaeris the retrieved aerosol density when emission is ignored.
emission signal should only be considered as a rough esti-mate. Finally, we compare a typical retrieval from SCIA-MACHY measurements when the emission signal is added to the forwards simulation of a corresponding retrieval with the retrieval performance when the emission signal is omitted. The right panel of Fig. 7 depicts the effect on the retrieved aerosol profile which is<5 % for altitudes below 30 km.
These first results for SCIAMACHY measurements over the Libyan desert provide confidence in the overall retrieval approach. To get a more quantitative estimate of the retrieval accuracy, a comparison of our retrieval with independent spatially and temporally co-located measurements of strato-spheric aerosol is needed.
Comparison with SAGE II
SAGE II provides aerosol density and radius profiles which are retrieved from solar occultation at several wavelengths. For our study, we employ version 6.2 of the SAGE data prod-uct, which are provided by the NASA atmospheric science data center (c.f. http://eosweb.larc.nasa.gov). To compare SAGE II data with the SCIAMACHY aerosol particle den-sity profiles, it is important to realize that the SCIAMACHY
product depends on the a prior choice of the aerosol size pa-rameter. Thus we convert both, the SAGE II and the SCIA-MACHY aerosol profiles to extinction profiles at a certain wavelength using the corresponding micro-physical aerosol properties of the retrieval. Furthermore we consider only SAGE and SCIAMACHY aerosol profiles, which are spa-tially co-located within±300 km along flight direction and
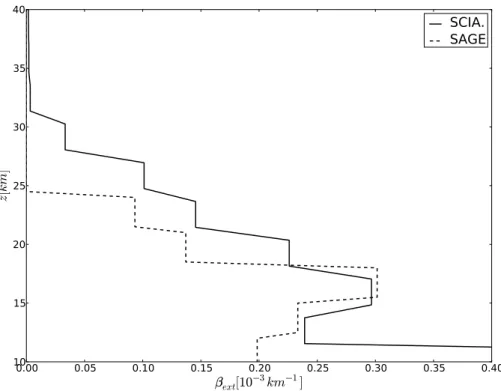
0.00 0.05 0.10 0.15 0.20 0.25 0.30 0.35 0.40
✞ext[10
✟3
km
✟1]
10 15 20 25 30 35 40
z
[
km
]
SCIA. SAGE
Fig. 8.Spatially and temporally co-located SAGE II and SCIAMACHY aerosol extinction profile at 525 nm above China, 3 January 2003. The SAGE II extinction profile are calculated from SAGE II aerosol density and radius profiles. The SCIAMACHY extinction profile is determined in the same way.
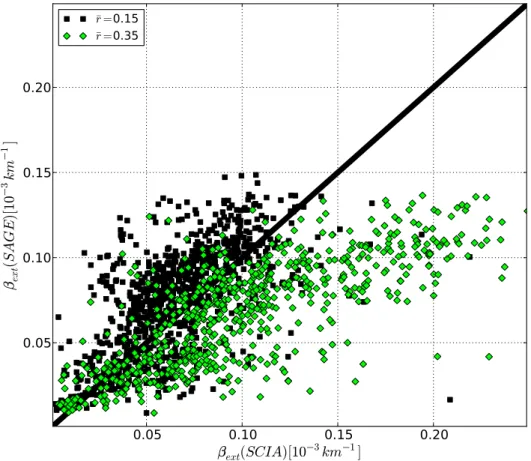
For a more extended comparison, we consider about 2000 co-locations between SAGE II and SCIAMACHY measure-ments for the period January 2003 to June 2005, between 75◦southern and northern latitude. Figure 9 shows a scat-tering diagram of co-located SAGE II and SCIAMACHY aerosol extinction coefficients in a 3 km thick layer centered at 25 km. For comparison the SAGE profiles are interpo-lated linearly to the SCIAMACHY retrieval heights. For a mean radiusr¯=0.35 µm, the SCIAMACHY aerosol ex-tinctions exceed significantly the corresponding SAGE val-ues. This is illustrated by a linear regression through the data points where the fitted line is constrained to go through the origin. Forr¯=0.35 µm, we obtain a slope of m=0.6 which deviates significantly from the ideal 1-to-1 line. The spread of the data set can be characterized by the mean dif-ferenceδm=1.5·10−5km−1between the data points and the linear regression.
Figure 10 illustrates the difference between SAGE and SCIAMACHY aerosol extinctions as a function of the scat-tering angle and latitude of the SCIAMACHY observation. Because of the sun-synchronized orbit of ENVISAT, scat-tering angle and latitude are correlated. The figure illustrates that differences between SAGE and SCIAMACHY retrievals are smallest at northern mid-latitudes or for smaller scatter-ing angle. For these cases, the aerosol sensitivity of the mea-surements is largest and hence forward model errors, e.g. due to a wrong prior estimate of the aerosol size, have a smaller
effect on the retrieval than for larger scattering angle. The re-duced aerosol sensitivity of the measurement for large scat-tering angles is also the reason for the little number of suc-cessful SCIAMACHY retrievals at the Southern Hemisphere, respectively at larger scattering angles. Figures 9 and 10 also present SCIAMACHY retrieval results for smaller aerosol particles with a mean radius of 0.15 µm. Here, the correlation between SCIAMACHY and SAGE II is clearly improved with a slope of the linear data regression ofm=1.1 but with a small effect on the spread withδm=1.3·10−5km−1. For the smaller aerosols much more retrievals converge for mea-surements over the Southern Hemisphere and the relative dif-ference between both data sets depends less on scattering an-gle or latitude, respectively. This indicates a better choice of the prior aerosol size and a clear improvement with respect to the previous retrieval.
To assess the data spread in Fig. 10, we investigate the retrieval noise for a set of simulated measurements cover-ing the scattercover-ing angles of Fig. 10. The measurement noise is estimated by an instrument noise model. For this pur-pose we consider limb radiancesI (z,λ)as a function of tan-gent heightzand wavelengthλin the O2A-band. The cor-responding photosignalSph(λ), i.e. the number of counted electrons, is given by
Sph(z,λ)=cphI (z,λ) (6)
0.05 0.10 0.15 0.20
✠
ext(
SCIA
)[10✡3km
✡1]
0.05 0.10 0.15 0.20
☛ex
t(
SAG
E
)[
10
☞3
km
☞1
]
¯
r
=0.15 ¯r
=0.35Fig. 9. Scatter diagram of co-located SAGE II and SCIAMACHY aerosol extinction coefficient at 25 km. The black squares indicate SCIAMACHY retrieval with a mean radiusr¯=0.15 µm, the green diamonds shows retrieval withr¯=0.35 µm.
20 40 60 80 100 120 140 160
✌[degrees]
✍200 ✍150 ✍100 ✍50
0 50 100
✎[%]
¯r=0.15 ¯r=0.35
20
40
60
80
100
120
140
160
✏
[degrees]
0.00
0.01
0.02
0.03
0.04
0.05
0.06
0.07
0.08
✑
ae
r[
cm
✒3
]
18km
21km
25km
31km
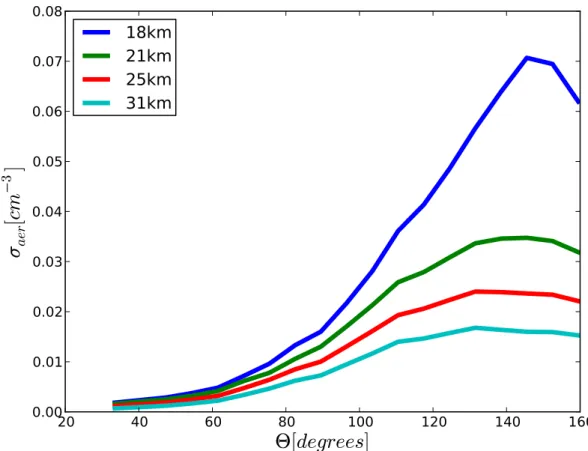
Fig. 11.Retrieval noise as function of scattering angleθat four different heights 18, 21, 25 and 31 km. The retrieval noise is estimated for simulated measurements using the SCIAMACHY noise model in Eq. (7). The measurements are simulated for a low surface albedo of 5 %.
combines the shot noise contribution p
Sph and the instru-ment noiseNinst. The latter combines error sources, like tector read-out noise and digitization noise, which do not de-pend on the signal strength. Thus, we obtain the signal to noise ratio of the measurement by
SNR(z,λ)=q cphI (z,λ)
cphI (z,λ)+Ninst2
. (7)
Both, the calibration constantcphand the instrument noiseNi are determined from the measurement noise of a representa-tive SCIAMACHY limb scan over the Libyan Desert. The error model is tested for the set of SCIAMACHY measure-ments which are used in Fig. 10 covering the range of scat-tering angles 30–160◦. Here,the measurement error could be described with an accuracy of≤15 % of the absolute mea-surement error at tangent heights≤30 km.
For the retrieval noise estimate in Fig. 11, measurements are simulated for a low surface albedo of 5 % and for the aerosol profile in Fig. 3. Due to the low albedo the noise estimate can be considered as an upper threshold. The re-trieval noise is shown for four different heights 18, 21, 25 and 31 km. It increases with increasing scattering angle
θ with a maximum at θ=150◦. The increase in the re-trieval noise is due to a decrease in the aerosol sensitivity
of the measurements. For scattering angles θ >150◦ the aerosol sensitivity of the measurements increases because of the backward scattering peak of the aerosol scattering phase function. Overall, at 18, 21 and 25 km the retrieval noise stays below 0.075, 0.035 and 0.025 cm−3which correspond to retrieval retrieval errors below 4, 3.5 and 6 %. At 31 km al-titude the retrieval noise does not exceed 0.07 cm−3or 25 %. So, the data spread in Fig. 10, especially at small scattering angle, cannot be caused by the SCIAMACHY retrieval noise. In contrast, the SAGE II data uncertainty for the considered data set at 25 km altitude is in the order of 20 %, which, at least partly, explains the scattering of data in Fig. 10.
0.4 0.6 0.8 1.0 1.2 1.4 1.6 1.8
m
[1]
12 14 16 18 20 22 24 26 28 30
z
[
km
]
0.1 0.2 0.3 0.4 0.5
✓
m
/
✔¯
ext[1]
12 14 16 18 20 22 24 26 28 30
z
[
km
]
¯
r
=0.10 ¯r
=0.15 ¯r
=0.20 ¯r
=0.350.2 0.4 0.6 0.8 1.0 1.2 1.4 1.6
rms/
✔¯
ext[1]
12 14 16 18 20 22 24 26 28 30
z
[
km
]
0.05 0.10 0.15 0.20 0.25 0.30 0.35
¯
✔
ext[10
✕3
km
✕1]
12 14 16 18 20 22 24 26 28 30
z
[
km
]
Fig. 12. (Upper left panel) Slope of a linear regression for a scattering diagram as in Fig. 9 as a function of heightz. (Upper right panel) Mean deviation from the linear regressionδmas a function of altitudez, relative to the mean SAGE extinction profileβ¯ext. (Lower left panel) Root mean square difference between SCIAMACHY and SAGE relative toβ¯ext. (Lower right panel) Mean SAGE extinction profileβ¯ext.
may be caused by the presences of cirrus clouds. Overall the agreement between the SAGE II data product and the pre-sented retrievals is in the order of 30–50 % root mean square difference relative to the mean SAGE profile, with a min-imum of 30 % around 22 km. The comparison of various stratospheric aerosol products from different instruments by Thomason and Peter (2006) indicates differences between 20–60 % and so the differences between SAGE and SCIA-MACHY aerosol extinction of this study are in agreement with these findings.
Overall, bearing in mind that the investigated data set de-scribes the current stratospheric background aerosol with low particle densities, the achieved agreement between the SAGE II and SCIAMACHY aerosol retrieval not only underlines the suitability of the retrieval concept, but also shows a satis-fying quality of the SCIAMACHY retrieval product.
5 Conclusions
profiles between 75◦ southern and northern latitudes were converted to extinction profiles at 525 nm and so, they could be compared with corresponding SAGE extinction profiles.
Overall, for background stratospheric aerosol concentra-tions with low particle densities the SAGE II and SCIA-MACHY extinction profiles differ by less than 50 % root mean square difference relative to the mean SAGE profile in the altitude range 14–30 km with a best agreement of 30 % around 22 km. The SCIAMACHY retrieval performance de-pends critically on the prior knowledge of the aerosol size. This information cannot be retrieved from the SCIAMACHY O2A-band measurements, and so an a priori choice had to be made. Here, the best agreement between SAGE and SCIA-MACHY retrievals could be achieved for an aerosol effective size radius ofr¯=0.20 µm. Due to the different scattering ge-ometry, the SCIAMACHY retrieval performance differs as a function of latitude and aerosol size. At southern latitudes, and so for larger scattering angles of the limb single scatter-ing geometry, the aerosol sensitivity of the measurement is small. Therefore, the SCIAMACHY retrieval is more sen-sitive to forward model errors and measurement biases. In turn, only for the smaller aerosol sizes a good convergence performance of the retrieval could be achieved for both the Northern and Southern Hemispheres.
The SCIAMACHY aerosol product can be beneficial for other SCIAMACHY limb retrieval products such as strato-spheric ozone profile retrieval because of a more accu-rate forward simulation of the limb radiance measurements. Moreover, the SCIAMACHY aerosol abundances in combi-nation with stratospheric ozone and nitrogen oxide profiles, both retrieved from SCIAMACHY measurements, represents a unique data set of spatially and temporally co-located mea-surements with a global coverage within 6 days. In the fu-ture this data may be useful to improve our knowledge on the long-term chemical evolution of the stratosphere. Never-theless, further effort is needed for exploiting the full capa-bility of SCIAMACHY limb measurements for stratospheric aerosol retrieval. For example, limb radiance measurements at other wavelengths may provide useful information on the size of stratospheric aerosol. Furthermore, forward model and measurement errors, e.g. due to the polarization sensitiv-ity of the measurement in the spectral range of strong atmo-spheric absorption, must be reduced to fully exploit SCIA-MACHY limb radiance measurements at all latitudes.
Acknowledgements. This research was funded by the Netherlands Space Office under the project SCIAVISIE. We thank Christian van Savigny, Institute of Environmental Physics (IUP), Bremen, for open and stimulating discussions on the subject of this paper.
Edited by: E. Kyr¨ol¨a
References
Bernath, P. F., McElroy, C. T., Abrams, M. C., Boone, C. D., But-ler, M., Camy-Peyret, C., Carleer, M., Clerbaux, C., Coheur, P., Colin, R., DeCola, P., DeMazi`ere, M., Drummond, J. R., Dufour, D., Evans, W. F. J., Fast, H., Fussen, D., Gilbert, K., Jennings, D. E., Llewellyn, E. J., Lowe, R. P., Mahieu, E., Mc-Connell, J. C., McHugh, M., McLeod, S. D., Michaud, R., Mid-winter, C., Nassar, R., Nichitiu, F., Nowlan, C., Rinsland, C. P., Rochon, Y. J., Rowlands, N., Semeniuk, K., Simon, P., Skel-ton, R., Sloan, J. J., Soucy, M., Strong, K., Tremblay, P., Turn-bull, D., Walker, K. A., Walkty, I., Wardle, D. A., Wehrle, V., Zander, R., and Zou, J.: Atmospheric Chemistry Experiment (ACE): Mission overview, Geophys. Res. Lett., 32, L15S01, doi:10.1029/2005GL022386, 2005.
Bingen, C., Fussen, D., and Vanhellemont, F.: A global climatol-ogy of stratospheric aerosol size distribution parameters derived from SAGE II data over the period 1984-2000: 2. Reference data, J. Geophys. Res., 109, D06202, doi:10.1029/2003JD003511, 2004a.
Bingen, C., Fussen, D., and Vanhellemont, F.: A global climatol-ogy of stratospheric aerosol size distribution parameters derived from SAGE II data over the period 1984-2000: 1. Methodology and climatological observations, J. Geophys. Res., 109, D06201, doi:10.1029/2003JD003518, 2004b.
Bourassa, A. E., Degenstein, D. A., Gattinger, R. L., and Llewellyn, E. J.: Stratospheric aerosol retrieval with optical spectrograph and infrared imaging system limb scatter measurements, J. Geo-phys. Res., 112, D10217, doi:10.1029/2006JD008079, 2007. Bovensmann, H., Burrows, J. P., Buchwitz, M., Frerick, J., No¨el,
S., Rozanov, V. V., Chance, K. V., and Goede, A. P. H.: SCIA-MACHY: Mission Objectives and Measurement Modes, J. At-mos. Sci., 56, 127–150, 1999.
Briegleb, B. P., Minnis, P., Ramanathan, V., and Harrison, E.: Com-parison of Regional Clear-Sky Albedos Inferred from Satellite Observations and Model Computations., J. Appl. Meteorol., 25, 214–226, 1986.
Buchholtz, A., Skinner, W., Abreu, V., and Hays, P.: The dayglow of the O2atmospheric band system, Planet Space Sci., 34, 1031– 1035, 1986.
Chu, W. P., Trepte, C. R., Veiga, R. E., Cisewski, M. S., and Taha, G.: SAGE III measurements, in: Society of Photo-Optical In-strumentation Engineers (SPIE) Conference Series, edited by: Barnes, W. L., 4814, 453–460, 2002.
Crutzen, P. J.: The influence of nitrogen oxides on the atmo-spheric ozone content, Q. J.e Roy. Meteorol. Soc., 96, 320–325, doi:10.1002/qj.49709640815, 1970.
Crutzen, P. J.: The possible importance of CSO for the sul-fate layer of the stratosphere, Geophys. Res. Lett., 3, 73–76, doi:10.1029/GL003i002p00073, 1976.
d’Almeida, G., Koepke, P., and Shettle, E.: Atmospheric Aerosols, Global Climatology and Radiative Characteristics, A. DEEPAK Publishing, Hampton, Virginia USA, 1991.
Deshler, T., Hofmann, D. J., Johnson, B. J., and Rozier, W. R.: Balloonborne measurements of the Pinatubo aerosol-size distribution and volatility at Laramie, Wyoming dur-ing the summer of 1991, Geophys. Res. Lett., 19, 199–202, doi:10.1029/91GL02787, 1992.
Vertical profiles, size distribution, and volatility, Geophys. Res. Lett., 20, 1435–1438, doi:10.1029/93GL01337, 1993.
Fahey, D. W., Kawa, S. R., Woodbridge, E. L., Tin, P., Wilson, J. C., Jonsson, H. H., Dye, J. E., Baumgardner, D., Borrmann, S., and Toohey, D. W.: In situ measurements constraining the role of sulphate aerosols in mid-latitude ozone depletion, Nature, 363, 509–514, 1993.
Hofmann, D. J. and Rosen, J. M.: Stratospheric sulfuric acid fraction and mass estimate for the 1982 volcanic erup-tion of El Chichon, Geophys. Res. Lett., 10, 313–316, doi:10.1029/GL010i004p00313, 1983.
Hofmann, D., Barnes, J., O’Neill, M., and Trudeau, M.: Increase in background stratospheric aerosol observed with lidar at Mauna Loa Observatory and Boulder, Colorado, Geophys. Res. Lett., 36, L15808, doi:10.1029/2009GL039008, 2009.
Junge, C. E. and Manson, J. E.: Stratospheric Aerosol Studies, J. Geophys. Res., 66, 2163–2182, doi:10.1029/JZ066i007p02163, 1961.
K¨archer, B. and Str¨om, J.: The roles of dynamical variability and aerosols in cirrus cloud formation, Atmos. Chem. Phys., 3, 823– 838, doi:10.5194/acp-3-823-2003, 2003.
Loughman, R. P., Griffioen, E., Oikarinen, L., Postylyakov, O. V., Rozanov, A., Flittner, D. E., and Rault, D. F.: Com-parison of radiative transfer models for limb-viewing scat-tered sunlight measurements, J. Geophys. Res., 109, D06303, doi:10.1029/2003JD003854, 2004.
Mauldin, L. E., Zaun, N. H., Cormick Jr., M. P., Guy, J. H., and Vaughn, W. R.: Stratospheric Aerosol and Gas Experiment II Instrument: A functional description, Opt. Eng., 24, 307–312, 1985.
McCormick, M. P., Chu, W. P., McMaster, L. R., Hamill, P., Swissler, T. J., and Pepin, T. J.: Satellite studies of the strato-spheric aerosol, B. Am. Meteorol. Soc., 60, 1038–1046, 1979. McCormick, M. P., Steele, H. M., Hamill, P., Chu, W. P., and
Swissler, T. J.: Polar Stratospheric Cloud Sightings by SAM II., J. Atmos. Sci., 39, 1387–1397, 1982.
McCormick, M. P., Thomason, L. W., and Trepte, C. R.: Atmo-spheric effects of the Mt Pinatubo eruption, Nature, 373, 399– 404, doi:10.1038/373399a0, 1995.
Mugnai, A., Fiocco, G., and Grams, G.: Effects of aerosol opti-cal properties and size distributions on heating rates induced by stratospheric aerosols, Q. J. Roy. Meteorol. Soc., 104, 783–796, 1978.
Oberreck, V., Danielsen, E., Snetsinger, K., Ferry, G., Fong, W., and Hayes, D.: Effect of the eruption of El Chichon on strato-spheric aerosol size and compostion, Geophys. Res. Lett., 10, 1021–1024, 1983.
Penner, J. E., Chen, Y., Wang, M., and Liu, X.: Possible influence of anthropogenic aerosols on cirrus clouds and anthropogenic forc-ing, Atmos. Chem. Phys., 9, 879–896, doi:10.5194/acp-9-879-2009, 2009.
Rossow, W. and Schiffer, R.: Advances in understanding clouds from ISCCP, B. Am. Meteorol. Soc., 80, 2261–2287, 1999.
Rothman, L. S., Gordon, I. E., Barbe, A., Benner, D. C., Bernath, P. F., Birk, M., Boudon, V., Brown, L. R., Campargue, A., Cham-pion, J., Chance, K., Coudert, L. H., Dana, V., Devi, V. M., Fally, S., Flaud, J., Gamache, R. R., Goldman, A., Jacquemart, D., Kleiner, I., Lacome, N., Lafferty, W. J., Mandin, J., Massie, S. T., Mikhailenko, S. N., Miller, C. E., Moazzen-Ahmadi, N., Nau-menko, O. V., Nikitin, A. V., Orphal, J., Perevalov, V. I., Perrin, A., Predoi-Cross, A., Rinsland, C. P., Rotger, M., ˇSimeˇckov´a, M., Smith, M. A. H., Sung, K., Tashkun, S. A., Tennyson, J., Toth, R. A., Vandaele, A. C., and Vander Auwera, J.: The HI-TRAN 2008 molecular spectroscopic database, J. Quant. Spec-trosc. Radiat. Transfer, 110, 533–572, 2009.
Saitoh, N., Hayashida, S., Sugita, T., Nakajima, H., Yokota, T., Hayashi, M., Shiraishi, K., Kanzawa, H., Ejiri, M. K., Irie, H., Tanaka, T., Terao, Y., Bevilacqua, R. M., Randall, C. E., Thoma-son, L. W., Taha, G., Kobayashi, H., and Sasano, Y.: Intercom-parison of ILAS-II version 1.4 aerosol extinction coefficient at 780 nm with SAGE II, SAGE III, and POAM III, J. Geophys. Res., 111, D11S05, doi:10.1029/2005JD006315, 2006. Slanger, T. and Copeland, R.: Energetic Oxygen in the upper
atmo-sphere and the laboratory, Chem. Rev., 103, 4731–4765, 2003. Solomon, S.: Stratospheric ozone depletion: A review
of concepts and history, Rev. Geophys., 37, 275–316, doi:10.1029/1999RG900008, 1999.
Taha, G., Rault, D. F., Loughman, R. P., Bourassa, A. E., and von Savigny, C.: SCIAMACHY stratospheric aerosol extinction pro-file retrieval using the OMPS/LP algorithm, Atmos. Meas. Tech., 4, 547–556, doi:10.5194/amt-4-547-2011, 2011.
Thomason, L. and Peter, T.: Assessment of Stratospheric Aerosol Properties (ASAP), SPARC Report No. 4 WCRP-124, WMO/TD-No. 1295, available online at: http://www.atmosp. physics.ca/SPARC/, 2006.
von Savigny, C., Haley, S., Sioris, C., McDade, I., Llewellyn, E., Degenstein, D., Evans, W., Gattinger, R., Griffioen, E., Kyr¨ol¨a, E., Lloyd, N., McConnell, J., McLinden, C., M´egie, G., Murtagh, D., Solheim, B., and Strong, K.: Stratospheric ozone profiles retrieved from limb scattered sunlight radiance spectra measured by the OSIRIS instrument on the Odin satellite, Geophys. Res. Lett., 30, 1755, doi:10.1029/2002GL016401, 2003.
von Savigny, C., Kaiser, J. W., Bovensmann, H., Burrows, J. P., McDermid, I. S., and Leblanc, T.: Spatial and temporal charac-terization of SCIAMACHY limb pointing errors during the first three years of the mission, Atmos. Chem. Phys., 5, 2593–2602, doi:10.5194/acp-5-2593-2005, 2005.
Walter, H. H., Landgraf, J., Spada, F., and Doicu, A.: Linearization of a radiative transfer model in spherical geometry, J. Geophys. Res., 111, D24304, doi:10.1029/2005JD007014, 2006.