Copy Number Variation in the Horse Genome
Sharmila Ghosh1, Zhipeng Qu2, Pranab J. Das1, Erica Fang1, Rytis Juras1, E. Gus Cothran1, Sue McDonell3, Daniel G. Kenney4, Teri L. Lear5, David L. Adelson2, Bhanu P. Chowdhary6, Terje Raudsepp1*
1Department of Veterinary Integrative Biosciences, College of Veterinary Medicine, Texas A&M University, College Station, Texas, United States of America,2School of Molecular and Biomedical Science, The University of Adelaide, Adelaide, South Australia, Australia,3New Bolton Center, School of Veterinary Medicine, University of Pennsylvania, Pennsylvania, United States of America,4Ontario Veterinary College, University of Guelph, Guelph, Ontario, Canada,5M.H. Gluck Equine Research Center, Veterinary Science Department, University of Kentucky, Lexington, Kentucky, United States of America,6New Research Complex, Qatar University, Al Tarfa, Doha, Qatar
Abstract
We constructed a 400K WG tiling oligoarray for the horse and applied it for the discovery of copy number variations (CNVs) in 38 normal horses of 16 diverse breeds, and the Przewalski horse. Probes on the array represented 18,763 autosomal and X-linked genes, and intergenic, sub-telomeric and chrY sequences. We identified 258 CNV regions (CNVRs) across all autosomes, chrX and chrUn, but not in chrY. CNVs comprised 1.3% of the horse genome with chr12 being most enriched. American Miniature horses had the highest and American Quarter Horses the lowest number of CNVs in relation to Thoroughbred reference. The Przewalski horse was similar to native ponies and draft breeds. The majority of CNVRs involved genes, while 20% were located in intergenic regions. Similar to previous studies in horses and other mammals, molecular functions of CNV-associated genes were predominantly in sensory perception, immunity and reproduction. The findings were integrated with previous studies to generate a composite genome-wide dataset of 1476 CNVRs. Of these, 301 CNVRs were shared between studies, while 1174 were novel and require further validation. Integrated data revealed that to date, 41 out of over 400 breeds of the domestic horse have been analyzed for CNVs, of which 11 new breeds were added in this study. Finally, the composite CNV dataset was applied in a pilot study for the discovery of CNVs in 6 horses with XY disorders of sexual development. A homozygous deletion involvingAKR1Cgene cluster in chr29 in two affected horses was considered possibly causative because of the known role ofAKR1C genes in testicular androgen synthesis and sexual development. While the findings improve and integrate the knowledge of CNVs in horses, they also show that for effective discovery of variants of biomedical importance, more breeds and individuals need to be analyzed using comparable methodological approaches.
Citation:Ghosh S, Qu Z, Das PJ, Fang E, Juras R, et al. (2014) Copy Number Variation in the Horse Genome. PLoS Genet 10(10): e1004712. doi:10.1371/journal. pgen.1004712
Editor:Gregory S. Barsh, Stanford University School of Medicine, United States of America
ReceivedApril 10, 2014;AcceptedAugust 26, 2014;PublishedOctober 23, 2014
Copyright:ß2014 Ghosh et al. This is an open-access article distributed under the terms of the Creative Commons Attribution License, which permits unrestricted use, distribution, and reproduction in any medium, provided the original author and source are credited.
Data Availability:The authors confirm that all data underlying the findings are fully available without restriction. The array is available at Agilent Technologies; Design ID#030025, Cat. No G4124A. The aCGH data are available at NCBI GEO accession GSE55266
Funding:TR and BPC were supported by Texas Agrilife Research, LINK Endowment and American Quarter Horse Association, DA and ZQ were supported by The University of Adelaide; ZQ was supported by a China Scholarship Council scholarship. The funders had no role in study design, data collection and analysis, decision to publish, or preparation of the manuscript.
Competing Interests:The authors have declared that no competing interests exist. * Email: [email protected]
Introduction
The significance of gene duplication in long-term evolu-tionary changes was already recognized over 40 years ago by Susumu Ohno [1]. Yet, systematic genome-wide discovery and functional interpretation of inter- and intraspecific copy number variations (CNVs) in genes and non-genic DNA sequences, started in the past decade with foundational studies in humans [2,3] and mice [4], followed by genome-wide (GW) CNV discovery in chicken [5], cattle [6], dogs [7,8] and other domestic species (see [9,10]). It is now well established that CNVs are a common feature of vertebrate genomes. Typically, they are DNA sequence variants from at least 50 base-pairs (bp) to over several megabase-pairs (Mb) in size that are involved in deletions, insertions, duplications and transloca-tions, causing structural differences between genomes [11,12]. In terms of the total number of DNA base-pairs, CNVs are responsible for more heritable sequence differences (0.5–1%) between individuals than SNPs (0.1%) [11,12,13].
One of the central goals of CNV research has been determining their association with genome instability, genetic diseases and congenital disorders. It is thought that CNVs, as a major source of inter-individual genetic variation, could explain variable pene-trance of Mendelian and polygenic diseases, and variation in the phenotypic expression of complex traits [14,15]. Indeed, CNVs have been associated with common complex and polygenic disorders in humans affecting a broad range of biological processes, such as immune response, autoimmunity and inflam-mation [3,16,17]; musculoskeletal [18,19] and cardiovascular systems [20,21]; neurodevelopment, cognition and behavior
[22,23], and sexual development and reproduction
[24,25,26,27,28].
The availability of whole genome (WG) sequence draft assemblies combined with the advances in array-based technolo-gies and next generation sequencing (NGS), have prompted CNV research in all main domestic animal species (reviewed by [9,10]) with the most advanced information currently available for cattle [6,29,30], pigs [31], and dogs [32,33,34].
In horses, five studies report about the discovery of CNVs in the whole genome [35,36,37,38] or in gene exons [39]. Attempts have also been made to associate CNVs with equine diseases [36], adaptations [38] and phenotypic traits [37,39]. While these studies set a foundation for understanding the role of CNVs in equine biology, the current information is inadequate for efficient discovery of variants affecting equine health and disorders. This is because the studies have used different CNV discovery platforms, the number of breeds and individuals in some studies is very limited, and the majority of reported CNVs are study-specific and not validated by two or more independent studies. Also, the available information has not been integrated into a composite dataset to facilitate the analysis of known CNVs and the discovery of new ones.
The aim of this study is to improve the current rather limited knowledge of CNVs in horses by their genome-wide discovery in multiple individuals of additional diverse horse breeds. Using a custom-made WG tiling array we generate a CNV map for the horse genome and integrate this with the previous CNV studies into a composite dataset. Finally, we carry out a pilot CNV analysis in horses with disorders of sexual development to test the utility of the array and the integrated dataset for the discovery of variants involved in equine complex disorders.
Results
The Texas-Adelaide horse whole-genome tiling array Texas A&M University (USA) and The University of Adelaide (Australia) collaborated to create a whole-genome (WG) 400K tiling array which was produced and printed by Agilent
Technologies (Design ID #030025), and designated as the
Texas-Adelaide array. The probes on the array represented 18,763 autosomal and X-linked genes, and intergenic, sub-telomeric and chrY sequences. Median genomic distance between the probes on the array was 7.5 kb; this distance was lower (4 kb)
in sub-telomeric regions, and higher (,20 kb) in the Y
chromo-some. Before using the array for CNV discovery in horses, the platform was tested for performance quality. Self-to-self control
hybridizations (Figure S1a) showed 1.55% of False Discovery Rate (FDR) - an indication that the array design, fabrication, and array genomic hybridization (aCGH) procedures were optimal. As a proof-of principle, female-to-male hybridizations between two
half-sib Thoroughbreds, Twilight (female) and Bravo (male),
showed massive loss in the X chromosome and a gain in the Y chromosome in the male, whereas only one CNV was detected in an autosome, chr3 (Figure S1b). Hybridization quality was assessed by measuring Derivative Log Ratio Standard Deviation (DLRSD) which calculates probe-to probe log ratio noise and is
typically,0.3 for good quality hybridizations. The DLRSD values
for all hybridizations with blood DNA fromTwilight andBravo
were,0.2. Therefore, and because the oligonucleotides on the
array were derived from the sequences of these two horses, DNA of Twilight and Bravo was used as a reference for all aCGH
experiments:Twilightfor females and Bravofor males. Further,
because our DNA collection from horse breeds contained samples isolated from blood and hair, an additional self-to-self hybridiza-tion was conducted using DNA from blood and hair of one male Quarter Horse QH3-H528 (Table S1). Blood DNA gave good quality results with DLRSD = 0.14, whereas consistent and high level hybridization noise was observed for hair DNA (DLRSD = 0.41) (Figure S1c). Due to this, CNVs in all samples were called
with stringent criteria: log2ratio alterations higher than 0.5 over 5
neighboring probes – a necessary compromise between calling CNVs with confidence and missing a few true calls. With median probe spacing of 7.5 kb on the array, this allowed detection CNVs of about 30 kb, and in probe-dense regions even smaller. We concluded that the performance of the equine 400K Texas-Adelaide whole-genome CGH array was optimal for the discovery of CNVs in the horse genome.
CNV discovery and construction of a whole-genome CNV map for the horse
The aCGH data are available at NCBI GEO accession GSE55266. Collectively, 950 CNV calls were made across 36 horses, with an average of 26.4 calls per individual (Table 1; Table S3). The number of CNV calls was the highest in two American Miniature Horses (59 and 46) and the lowest in American Quarter Horses (12 and 14), whereas the number of calls per individual was
not significantly different between blood and hair DNA (P= 0.07;
Table 1) at the settings of log260.5 over 5 probes. The number
and distribution of CNVRs in the two Przewalski horses were similar to those in domestic horses (Table 1, Table S4). Because the Thoroughbred served as a reference, by default all the 950 CNV calls recorded in other breeds were also present in the Thoroughbred, though inversely with respect to gains and losses. However, because the Thoroughbred was compared with multiple
individuals, the same CNV had different log2values, and that is
why the Thoroughbreds were not included in the comparisons of CNV metrics.
The ADM-2 algorithm arranged adjacent and overlapping CNV calls (CNVs) within and between individual horses into 258 CNV regions (CNVRs; Table S5) of which 114 were shared between at least 2 individuals of the same or different breeds, while 144 were private and found only in one individual. Two CNVRs were found in two or more individuals of the same breed but not in other breeds and were tentatively considered as breed-specific: a 14 kb loss in chr9 in Exmoor ponies, and a 39 kb loss in chr20 in Swiss Warmblood horses (Table S4).
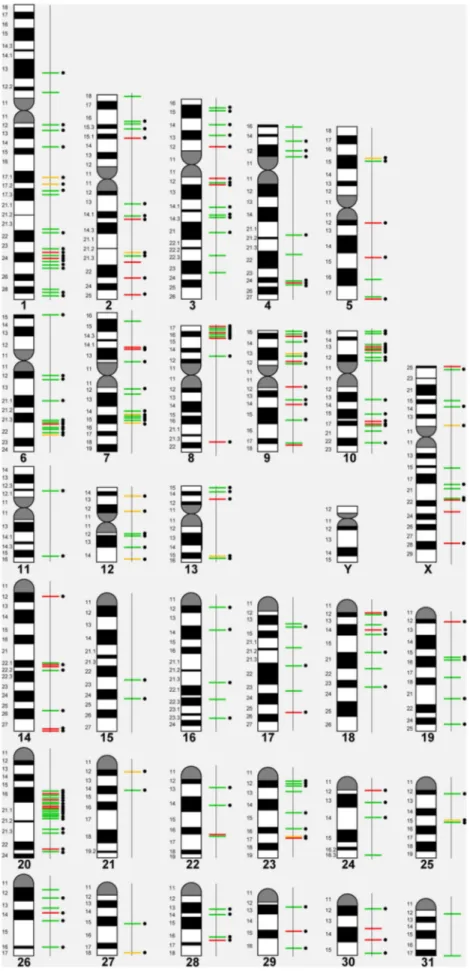
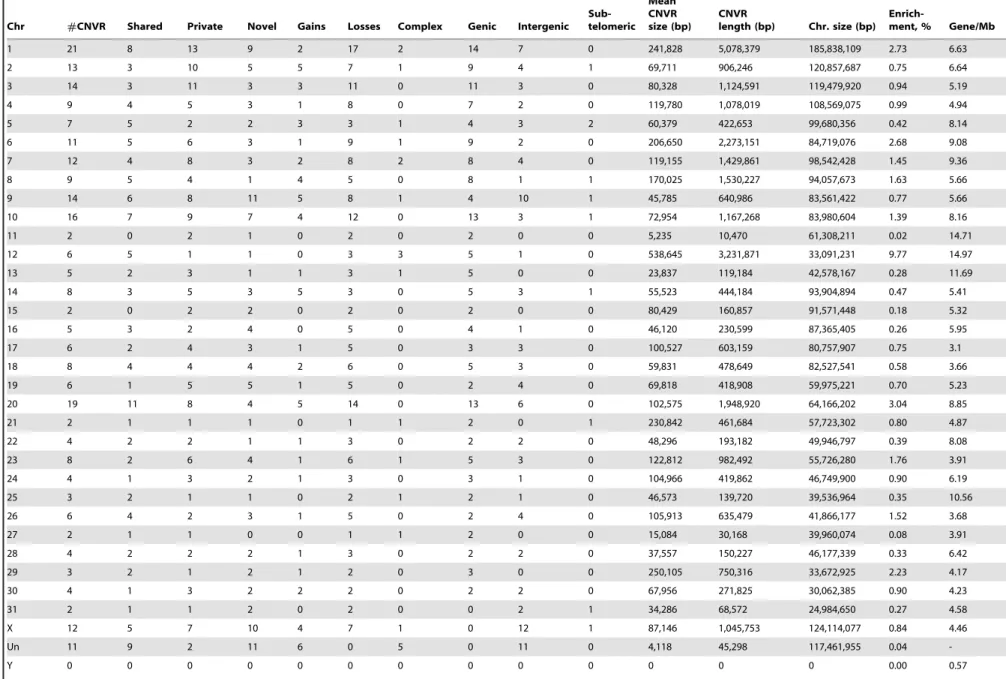
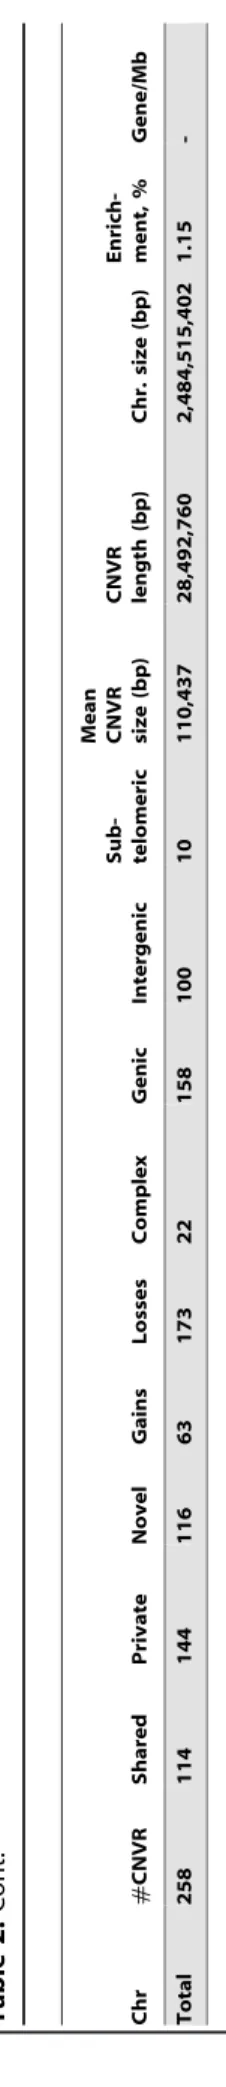
Based on the 258 CNVRs, a whole genome CNV map for the horse was constructed (Figure 1) details of which are summarized in Table 2. The mean size of CNVRs was 110 kb ranging from 1 kb to 2.5 Mb. The CNVRs occupied 1.15 % of the equine Author Summary
genome and were distributed over all horse chromosomes, except the Y, with the highest enrichment in chromosomes 12 (9.7%) and 20 (3.0 %). Even though chr12 is the gene richest chromosome in the horse genome (15 genes/Mb), there was no overall correlation between CNV enrichment and gene density. For example, the enrichment values for the second and third gene densest chromosomes, chr11 and chr13, were 0.02% and 0.28%, respectively (Table 2). Likewise, we did not observe CNV
enrichment in sub-telomeres, as previously reported for humans [40]: the array contained 5,716 sub-telomeric probes, though only 10 CNVRs were detected in these regions in horses.
In general, losses (173; 67%) prevailed over gains (63; 24%), although 6 horses had more gains than losses (Table 1). Twenty-two CNVRs (8.5%) were complex involving both losses and gains in different individuals (Table 2, Table S3). Even though aCGH on diploid samples cannot discriminate between copies of alleles
Table 1.Breed- and individual-wise summary of CNV calls in horses.
Horse breed Source of DNA for aCGH CNV calls per individual Gains Losses
Akhal-teke 1 Blood 37 12 25
Akhal-teke 2 Blood 26 13 13
American Miniature Horse 1 Blood 59 16 43
American Miniature Horse 2 Hair 46 4 42
American Quarter Horse 1 Blood 12 0 12
American Quarter Horse 2 Blood 21 2 19
American Quarter Horse 3 Blood 14 10 4
Arabian 1 Blood 21 17 4
Arabian 2 Hair 17 0 17
Belgian 1 Blood 31 14 17
Belgian 2 Hair 14 1 13
Caspian Pony 1 Blood 40 16 24
Caspian Pony 2 Hair 12 1 11
Clydesdale 1 Blood 25 6 19
Clydesdale 2 Hair 16 1 15
Exmoor Pony 1 Blood 29 15 14
Exmoor Pony 2 Hair 18 8 10
Fell Pony 1 Blood 25 11 14
Fell Pony 2 Hair 47 11 36
Friesian 1 Blood 29 6 23
Friesian 2 Blood 39 10 29
Friesian 3 Blood 41 9 32
Friesian 4 Blood 22 12 10
Mongolian Native Horse1 Hair 22 1 21
Mongolian Native Horse2 Hair 18 2 16
Percheron 1 Blood 17 11 6
Percheron 2 Hair 12 1 11
Przewalski’s Horse 1 Fibroblasts 21 5 16
Przewalski’s Horse 2 Fibroblasts 21 3 18
Sorraia 1 Blood 36 8 28
Sorraia 2 Hair 18 1 17
Standardbred 1 Blood 17 7 10
Standardbred 2 Blood 44 13 31
Swiss Warmblood 1 Blood 23 1 22
Swiss Warmblood 2 Blood 30 6 24
Swiss Warmblood 3 Blood 29 9 20
Thoroughbred 1 Blood Male reference n/a n/a
Thoroughbred 2 Blood Female reference n/a n/a
Average 26.4 7.3 19.1
Median 22.5 7.5 17.0
The number of calls per individual was not significantly different (Student’s T-testp= 0.07) between hair and blood DNA. doi:10.1371/journal.pgen.1004712.t001
CNVs in Equine Health and Congenital Disorders
Table 2.Chromosome-wise CNVR statistics for the horse genome.
Chr #CNVR Shared Private Novel Gains Losses Complex Genic Intergenic
Sub-telomeric
Mean CNVR size (bp)
CNVR
length (bp) Chr. size (bp)
Enrich-ment, % Gene/Mb
1 21 8 13 9 2 17 2 14 7 0 241,828 5,078,379 185,838,109 2.73 6.63
2 13 3 10 5 5 7 1 9 4 1 69,711 906,246 120,857,687 0.75 6.64
3 14 3 11 3 3 11 0 11 3 0 80,328 1,124,591 119,479,920 0.94 5.19
4 9 4 5 3 1 8 0 7 2 0 119,780 1,078,019 108,569,075 0.99 4.94
5 7 5 2 2 3 3 1 4 3 2 60,379 422,653 99,680,356 0.42 8.14
6 11 5 6 3 1 9 1 9 2 0 206,650 2,273,151 84,719,076 2.68 9.08
7 12 4 8 3 2 8 2 8 4 0 119,155 1,429,861 98,542,428 1.45 9.36
8 9 5 4 1 4 5 0 8 1 1 170,025 1,530,227 94,057,673 1.63 5.66
9 14 6 8 11 5 8 1 4 10 1 45,785 640,986 83,561,422 0.77 5.66
10 16 7 9 7 4 12 0 13 3 1 72,954 1,167,268 83,980,604 1.39 8.16
11 2 0 2 1 0 2 0 2 0 0 5,235 10,470 61,308,211 0.02 14.71
12 6 5 1 1 0 3 3 5 1 0 538,645 3,231,871 33,091,231 9.77 14.97
13 5 2 3 1 1 3 1 5 0 0 23,837 119,184 42,578,167 0.28 11.69
14 8 3 5 3 5 3 0 5 3 1 55,523 444,184 93,904,894 0.47 5.41
15 2 0 2 2 0 2 0 2 0 0 80,429 160,857 91,571,448 0.18 5.32
16 5 3 2 4 0 5 0 4 1 0 46,120 230,599 87,365,405 0.26 5.95
17 6 2 4 3 1 5 0 3 3 0 100,527 603,159 80,757,907 0.75 3.1
18 8 4 4 4 2 6 0 5 3 0 59,831 478,649 82,527,541 0.58 3.66
19 6 1 5 5 1 5 0 2 4 0 69,818 418,908 59,975,221 0.70 5.23
20 19 11 8 4 5 14 0 13 6 0 102,575 1,948,920 64,166,202 3.04 8.85
21 2 1 1 1 0 1 1 2 0 1 230,842 461,684 57,723,302 0.80 4.87
22 4 2 2 1 1 3 0 2 2 0 48,296 193,182 49,946,797 0.39 8.08
23 8 2 6 4 1 6 1 5 3 0 122,812 982,492 55,726,280 1.76 3.91
24 4 1 3 2 1 3 0 3 1 0 104,966 419,862 46,749,900 0.90 6.19
25 3 2 1 1 0 2 1 2 1 0 46,573 139,720 39,536,964 0.35 10.56
26 6 4 2 3 1 5 0 2 4 0 105,913 635,479 41,866,177 1.52 3.68
27 2 1 1 0 0 1 1 2 0 0 15,084 30,168 39,960,074 0.08 3.91
28 4 2 2 2 1 3 0 2 2 0 37,557 150,227 46,177,339 0.33 6.42
29 3 2 1 2 1 2 0 3 0 0 250,105 750,316 33,672,925 2.23 4.17
30 4 1 3 2 2 2 0 2 2 0 67,956 271,825 30,062,385 0.90 4.23
31 2 1 1 2 0 2 0 0 2 1 34,286 68,572 24,984,650 0.27 4.58
X 12 5 7 10 4 7 1 0 12 1 87,146 1,045,753 124,114,077 0.84 4.46
Un 11 9 2 11 6 0 5 0 11 0 4,118 45,298 117,461,955 0.04
-Y 0 0 0 0 0 0 0 0 0 0 0 0 0 0.00 0.57
CNVs
in
Equine
Health
and
Congenital
Disorders
PLOS
Genetics
|
www.plosgen
etics.org
5
October
2014
|
Volume
10
|
Issue
10
|
and thus, distinguish between heterozygous and homozygous CNVs, two gains and 14 losses were tentatively considered
homozygous because of log2 alterations over 2.0 (Table S6).
Homozygosity of 8 losses was confirmed by qualitative PCR (Fig. S2).
Gene content of CNVRs and functional categories of copy number variable genes
The majority (82%) of horse CNVRs contained one or more
known Ensembl (http://www.ensembl.org/index.html) horse
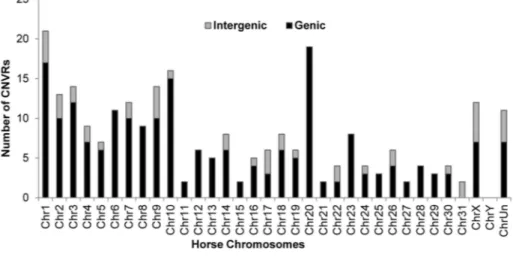
genes (158 CNVRs) or non-horse mammalian reference genes (54 CNVRs) (Table S7), while 46 CNVRs (18%) were located in intergenic regions (Table S8). Gene containing CNVRs were also predominant in individual chromosomes with the exception of chr31 which was enriched with intergenic variants Fig. 2. However, we consider calls for intergenic CNVRs tentative and subject to change as the annotation of the horse genome is still in progress.
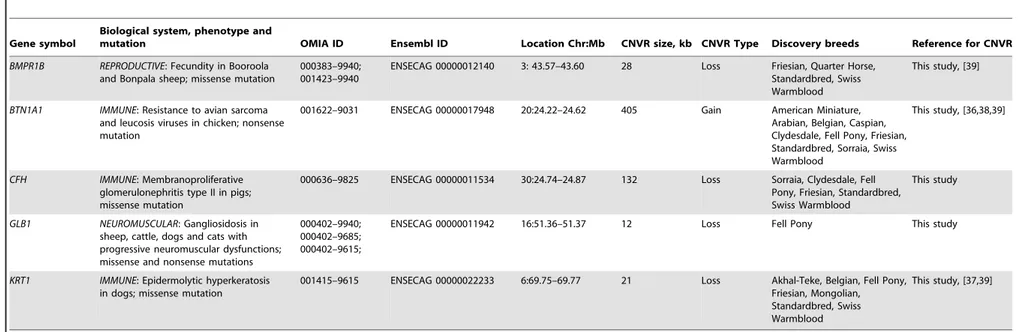
Altogether, the CNVRs involved 805 protein-coding genes (750 Ensembl genes, 33 non-Ensembl genes and 22 horse mRNAs; Table S7) but also non-coding small and long RNA genes, and pseudogenes. The largest CNVRs with the highest number of genes corresponded to clusters of olfactory and non-olfactory G-protein coupled receptors (GPCRs) or to immunity related genes, such as immunoglobulins, T-cell receptors, and MHC protein complex genes - a typical feature of CNVRs in all mammalian genomes studied so far [3,30,32,39,41,42]. Likewise, Gene Ontology (GO) analysis indicated that equine copy number variable genes are predominantly involved in biological processes and molecular functions related to transmembrane signal trans-duction, chemo-attractant sensory perception, immune response and steroid metabolism (Fig. 3; Table S9). Notably, 5 copy number variable genes from this study were associated with known OMIA (http://omia.angis.org.au/home/) phenotypes for im-mune, reproductive or neuromuscular diseases (Table 3), though none of the OMIA records involved horses or CNVs. The CNVR
overlapping with theBMPR1Bgene has been earlier reported in
horses and is of interest because of a possible role in the regulation of the rate of ovulation [39].
Composite CNV dataset for the horse genome
Comprehensive knowledge of CNVs in normal horse popula-tions, within and across breeds, is a prerequisite for the discovery of variants that contribute to equine genetic diseases and disorders. Therefore, we aligned the 258 CNVRs identified in this study with previously published CNV data for the horse [35,36,37,38,39]. Altogether, we found records of about 2041 CNVs and CNVRs (calling criteria vary between studies). These were further consolidated, based on adjacent locations or partial overlaps, into 1476 CNVRs of which 301 CNVRs (20%) were shared between two or more studies (Table S10, Fig. 4). The majority of shared CNVRs involved genes associated with olfactory reception (50 CNVRs) and membrane transport (49 CNVRs) but also genes involved in transcription (30 CNVRs), cell cycle regulation (12 CNVRs) and RNA genes (34 CNVRs). Expectedly, CNVRs that were found in more than 100 horses and reported by all 6 studies exclusively involved olfactory receptors. Comparative analysis also revealed that novel (study-specific) CNVRs predominated over shared ones in all 6 studies (Fig. 4). Novel CNVRs of functional interest from this study involved genes related to sperm-egg interaction and fertilization in chr4:19.8–19.9 Mb; a
developmen-tal geneSOX2in chr19:20.1 Mb; an X-linked region harboring
genes of circadian pacemaker function chrX:83.8–84.0 Mb, and a complex CNVR in chrUn:225–226 kb with cancer related genes.
Table 2. Cont. Chr # CNVR Shared Private Novel Gains Losses Complex Genic Intergenic Sub- telomeric Mean CNVR size
Notably, the latter two CNVRs were found in more than 10 horses each. Details of all novel and shared CNVRs are presented in Table S10.
Experimental validation of CNVRs by quantitative PCR and FISH
Nineteen CNVRs were validated by quantitative PCR (qPCR) using array probe-specific primers (Table S2). The regions were selected upon three criteria – size, gene content and novelty. The smallest tested CNVR was 4 kb and the largest 2 Mb; 13 involved clusters of horse genes, and 6 were novel. A summary of qPCR results are presented in Figure S3 and Table S11. All selected CNVRs were first tested in the discovery horses and then analyzed in more individuals of the same breed to identify possible breed-specific tendencies. Overall, qPCR observations agreed well
(P-value,0.05) with the array CGH data for all discovery horses and
for other animals of the same breed. For example, it confirmed a
complex CNVR in chr27 involvingCSMD1gene (CUB and Sushi
multiple domains 1) which encodes a transmembrane and a candidate tumor suppressor protein [43]. Copy numbers in this region were tested on 11 breeds with at least 2 individuals each and showed a gain in native ponies, draft breeds and the Przewalski horse, and a loss in American Miniature horses in relation to the Thoroughbred (Fig. 5A–B). Likewise, qPCR confirmed a CNVR in chr20 (Fig. 5C) which has been found only in this study and in indigenous plateau horses [38]. However, we found some differences too between the two data sets: e.g., while qPCR confirmed a loss in chr20:32.0–32.4 Mb and chr17:18.8–19.0 Mb in the discovery Swiss Warmblood and Mongolian horses (Table S3), respectively, inclusion of additional horses from the same breeds resulted in a significant gain in these regions (Fig. S3). Also, initial qPCR confirmed a loss in chr7:74.8– 74.9 Mb in the two discovery Swiss Warmblood horses (Table S3) but no significant losses were found when more individuals were added. These minor discrepancies can be attributed to intra-breed variation: array CGH was based on 2 to 4 individuals, while qPCR involved 4 or more horses per breed (Figure S3, Table S11).
Two CNVRs, a complex 200 kb gain-loss region in chr1:114.0– 114.2 Mb and a 2.2 kb gain in chrUn: 529–531 kb) were validated by FISH using CNV-containing CHORI-241 BAC clones 132B13 (Fig. S4) and 91B23 (Fig. 6), respectively. Clear differences in copy numbers between individual horses, as well as between homologous chromosomes of the same horse were
observed. Additionally, the CNVR in chrUn was mapped to horse chr19q12–q13 (Fig. 6).
Discovery of CNVs in horses with XY disorders of sexual development (DSDs)
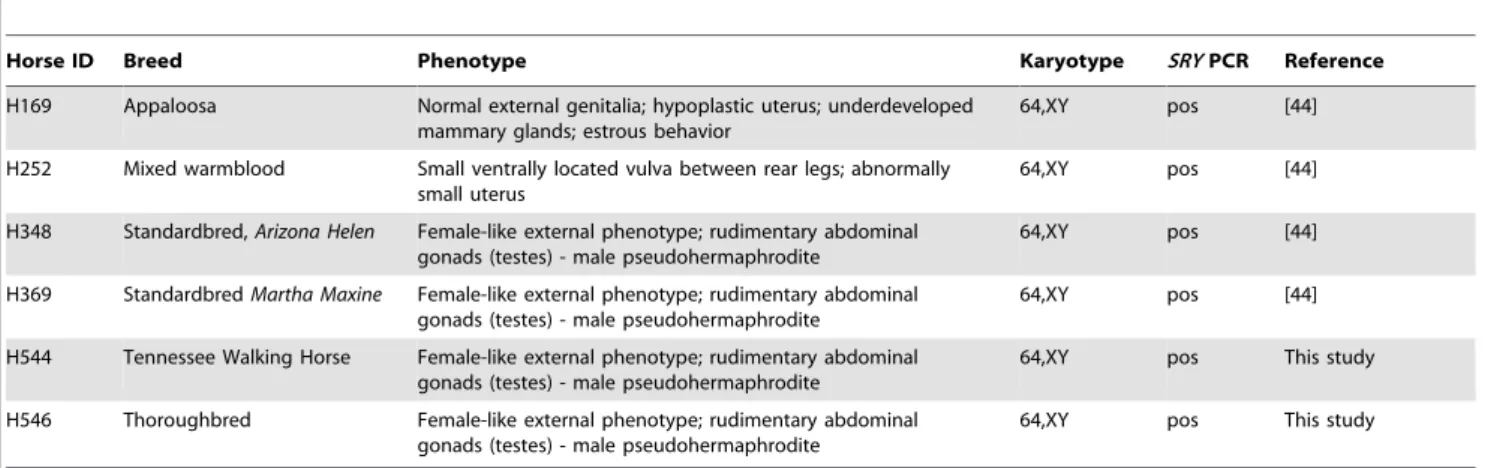
Finally, we carried out a pilot study to test the utility of the tiling array and the integrated CNV data set (Table S10) for the discovery of CNVs involved in equine XY disorders of sexual development (XY DSD). Selection of the phenotype was based upon studies in humans suggesting contribution of CNVs to XY DSDs [25,27,28]. Array CGH experiments were carried out in 6 affected horses (Table 4): all had normal male 64,XY karyotype
with an intactSRY gene, abnormal male or female gonads, and
female or female-like external phenotype [44]. We determined 179 CNVs (average 30 calls per individual) and 107 CNVRs, of which 83 were common and shared with normal equine populations, and 24 CNVRs were novel (Table 5). Only 3 novel CNVRs were shared between two or three XY DSD horses, while the remaining 21 were private and present in just one animal. Protein coding or miRNA genes with functions in cell cycle regulation, transcription and posttranscriptional processing were involved in 14 novel CNVRs. None of the CNV-genes had known functions in sexual differentiation or development.
Analysis of common CNVRs for highly aberrant log2 values
detected two likely homozygous deletions (Table 5): a 26 kb loss in
chr7 (log2 22.2) and a,200 kb loss in chr29 (log2 23.5). The
latter was of particular interest because it was found in two closely related American Standardbreds with very similar male-pseudo-hermaphrodite phenotypes (H348 and H369; Table 4). The CNVR was also present in 10 out of the 38 normal horses (Table S3) including one American Standardbred, though with a
moderate aberration value (log2average 20.7) compared to
log2=23.5 in the two XY DSD horses. Most notably, the CNVR
involved at least 4 members of the aldo-keto reductaseAKR1C
gene family, known to be critical in the backdoor pathway of dihydrotestosterone (DHT) synthesis and sexual development [45,46]. A schematic overview of the CNVR, including the involved genes and aberration profiles of all 47 array probes in the region, is presented in Fig. 7. Homozygosity of the deletion was
confirmed by fluorescence in situ hybridization (FISH) with a
BAC clone (CHORI-241-23N13) spanning the deletion. The BAC hybridized to chr29 in control animals but not in the two XY DSD horses, whereas a control BAC (CHORI-241-76H613) with the
Figure 2. Chromosome-wise distribution of genic and intergenic CNVRs in the horse genome.
doi:10.1371/journal.pgen.1004712.g002
CNVs in Equine Health and Congenital Disorders
CREMgene from a non-CNVR in chr29 [47] hybridized equally in the XY DSD horses and controls (Fig. 7). Homozygosity of the deletion was further confirmed by PCR showing that primers designed inside the CNVR amplified genomic DNA of control horses and the remaining 4 XY DSD horses, but not of the two male-pseudohermaphrodite American Standardbreds (H348 and H369; Fig. 7). Though primers designed outside the CNVR, amplified the DNA by PCR in all horses – an evidence that the DNA quality of the two Standardbreds was acceptable. We
theorized that the homozygous deletion involvingAKR1Cgenes
in the two male-pseudohermaphrodite horses might be the risk factor for abnormal sexual development.
Discussion
During just the past two years, five studies have addressed the phenomenon of copy number variation in the horse genome [35,36,37,38,39] contributing to our knowledge about the genomic landscape of CNVs and their role in inter-individual variation in horses. Despite the progress, lessons from humans [48,49,50] and more recently from dogs [7,34], show that efficient biomedical application of this information requires integration of data from many more populations and individuals and the use of comparable methodological platforms[48,49,50].
Here we report about the construction of a 400K high-density WG tiling oligoarray for the horse and its application for the discovery of CNVs in 38 normal horses of 16 diverse breeds, as well as in 6 horses with congenital disorders. Probes on the array were designed to detect CNVs in 18,763 equine autosomal and X-linked genes but also in intergenic, sub-telomeric and Y chromosome sequences. Regarding genome coverage, our CNV discovery platform most closely resembled the recently reported WG 1.3 M NimbleGen CGH array [38], but essentially comple-mented the exon CGH array by Doan and colleagues [39] and the studies based on WG SNP50 BeadChip [37,51]. The latter is of a magnitude lower density and not specifically designed for CNV capture. Also, as shown in humans and cattle, the efficiency of CNV discovery is lower in SNP platforms compared to CNV focused arrays [29,50]. While the future direction for CNV research in any species is probably next generation sequencing (NGS), the approach has as yet found only limited application in horses: for the discovery of CNVs in the genome of a Quarter Horse mare [35] and for the discovery of segmental duplications in 6 horse breeds and the donkey [52].
A unique feature of our CGH array was the inclusion of probes from the Y chromosome and sub-telomeric regions. This was
because CNVs and segmental duplications are known to be an integral part of the architecture of the mammalian Y chromosome [53,54], while sub-telomeres are hotspots of DNA breakage and repair, and undergo structural rearrangements more frequently than the rest of the genome [40,55]. Despite the almost 6,000
sub-telomeric probes with lower than average spacing (,4 kb vs.
,7 kb across the genome) on the array, only 10 CNVs were
detected in sub-telomeres and none in the Y chromosome (Table 2). It is likely that the complex sub-telomeric sequences are either missing or underrepresented in the current horse sequence assembly [56], due to which it is possible that the probes designed from the ends of the chromosomes, did not originate from actual sub-telomeres.
Poor representation of centromeric/pericentromeric and telo-meric/sub-telomeric sequences is a common shortcoming of all draft genome assemblies. Whilst the horse may be different to humans or other species in terms of subtelomeric sequences, this can only be rigorously shown by sequencing BAC clones from these regions, preferably with long-read single molecule technol-ogy such as a Pacific Biosciences instrument to resolve long repeats. Such an approach was recently successfully applied to resolve regions of segmental duplications in the finished genome sequence of humans [57].
The Y chromosome, on the other hand, has acquired and amplified novel sequences, as well as sequences from the rest of the genome [58]. Thus, it is likely that many potential copy number variable Y probes did not pass the ‘uniqueness’ test by BLAST and were dropped from the array (see Material and Methods for details).
Integration and comparison of the CNV data for the horse
The present and all previous CNV studies in horses [35,36,37,38,39] differ by discovery platforms, genome coverage, resolution, the study cohorts and analytical methods (Table 6). Therefore, the overall numbers, size ranges and chromosomal distribution of CNVs vary between the studies. For example, it has been shown that due to analytical reasons, CGH-based studies tend to detect more losses than gains [59]. This holds true for the Agilent WG array in the present study and also the Nimblegen WG array [38], though [38]slightly more gains were detected with the Agilent exon array [39] (Table 6). The latter was attributed to the large number of losses in the reference animal compared to the Thoroughbred (Twilight) genome sequence assembly EquCab2 [56]. In contrast, gains vastly predominate (97%) among the CNVs found by NGS in a Quarter Horse mare [35]. Apparent Figure 3. Gene Ontology classifications of copy number variable genes in horses.
Table 3.Equine copy number variable genes with known mammalian phenotypes (OMIA; http://omia.angis.org.au/home/).
Gene symbol
Biological system, phenotype and
mutation OMIA ID Ensembl ID Location Chr:Mb CNVR size, kb CNVR Type Discovery breeds Reference for CNVR
BMPR1B REPRODUCTIVE: Fecundity in Booroola and Bonpala sheep; missense mutation
000383–9940; 001423–9940
ENSECAG 00000012140 3: 43.57–43.60 28 Loss Friesian, Quarter Horse, Standardbred, Swiss Warmblood
This study, [39]
BTN1A1 IMMUNE: Resistance to avian sarcoma and leucosis viruses in chicken; nonsense mutation
001622–9031 ENSECAG 00000017948 20:24.22–24.62 405 Gain American Miniature, Arabian, Belgian, Caspian, Clydesdale, Fell Pony, Friesian, Standardbred, Sorraia, Swiss Warmblood
This study, [36,38,39]
CFH IMMUNE: Membranoproliferative glomerulonephritis type II in pigs; missense mutation
000636–9825 ENSECAG 00000011534 30:24.74–24.87 132 Loss Sorraia, Clydesdale, Fell Pony, Friesian, Standardbred, Swiss Warmblood
This study
GLB1 NEUROMUSCULAR: Gangliosidosis in sheep, cattle, dogs and cats with progressive neuromuscular dysfunctions; missense and nonsense mutations
000402–9940; 000402–9685; 000402–9615;
ENSECAG 00000011942 16:51.36–51.37 12 Loss Fell Pony This study
KRT1 IMMUNE: Epidermolytic hyperkeratosis in dogs; missense mutation
001415–9615 ENSECAG 00000022233 6:69.75–69.77 21 Loss Akhal-Teke, Belgian, Fell Pony, Friesian, Mongolian, Standardbred, Swiss Warmblood
This study, [37,39]
doi:10.1371/journal.pgen.1004712.t003
CNVs
in
Equine
Health
and
Congenital
Disorders
PLOS
Genetics
|
www.plosgen
etics.org
9
October
2014
|
Volume
10
|
Issue
10
|
differences in CNV calling algorithms and thresholds (Table 6), on the other hand, are responsible for the variation in the number of CNVs, their size and the criteria for merging individual CNVs into CNVRs. For example, in this study we
mainly reported CNVRs because this is how the ADM-2 algorithm analyses and assembles the CNV calls (CNVs) within and across individuals. Further, specific features of the probe/ array design, and not necessarily the number of probes, are responsible for the differences in the genomic distribution of discovered CNVs. So far, X-linked CNVs have been found only in this study and by Doan & colleagues [39], and CNVs in chrUn only in this study. Surprisingly, the study with a three times denser 1.3 M Nimblegen array failed to detect CNVs in chrX, as well as in [38] chrs30 and 31 [38]. At the same time, the latter two small autosomes show the highest number of CNVs in the Quarter Horse mare [35]. Major differences are also in the size, diversity and origin of the study cohorts, ranging from just a few breeds and individuals [35,38] to over 15 breeds (this study and [37]) and hundreds of individuals [36,37] (Table 6).
Figure 4. A summary diagram of all CNV studies in horses and their contribution to the integrated CNV dataset.Numbers in arrow-heads denote the contribution of each study to the common pool of301shared CNVRs; numbers in arrow-tails denote the total and novel (separated by colon) CNVRs per study; CGH, SNP and NGS denote the platforms used for CNV detection.
doi:10.1371/journal.pgen.1004712.g004
Figure 5. Validation of CNVRs by PCR. A. gains andB. losses in Chr27 (37.3 Mb; probe Gs_27_37371896) involving CUB and Sushi multiple domains 1 (CSMD1) gene;C. Loss in Chr20 (24.8 Mb; probe Eic_20_24841849) involving olfactory receptors; n – number of individuals analyzed. doi:10.1371/journal.pgen.1004712.g005
The many variables between the six studies (Table 6) obviously confound assessments based solely on CNV metrics, and it would probably be more appropriate to compare the actual CNVs/CNVRs reported. Therefore, and in order to obtain a comprehensive overview about the status of CNV discovery in horses, we integrated the CNVs or CNVRs from all six studies ([35,36,37,38,39], this study) according
to their genomic locations into a composite dataset of 1476 CNVRs (Table S10). Of these, 301 are reported by at least two studies, while the remaining 1174 CNVRs are study-specific (novel; Fig. 4) and require further validation.
The integrated dataset is a needed resource for evaluating new CNV discoveries and gives an idea about the most intrinsic
Table 4.Horses withSRY-positive XY DSDs analyzed in this study.
Horse ID Breed Phenotype Karyotype SRYPCR Reference
H169 Appaloosa Normal external genitalia; hypoplastic uterus; underdeveloped mammary glands; estrous behavior
64,XY pos [44]
H252 Mixed warmblood Small ventrally located vulva between rear legs; abnormally small uterus
64,XY pos [44]
H348 Standardbred,Arizona Helen Female-like external phenotype; rudimentary abdominal gonads (testes) - male pseudohermaphrodite
64,XY pos [44]
H369 StandardbredMartha Maxine Female-like external phenotype; rudimentary abdominal gonads (testes) - male pseudohermaphrodite
64,XY pos [44]
H544 Tennessee Walking Horse Female-like external phenotype; rudimentary abdominal gonads (testes) - male pseudohermaphrodite
64,XY pos This study
H546 Thoroughbred Female-like external phenotype; rudimentary abdominal gonads (testes) - male pseudohermaphrodite
64,XY pos This study
doi:10.1371/journal.pgen.1004712.t004
Table 5.Novel and highly aberrant common (in bold font) CNVRs in XY DSD horses.
Horse ID Chr Start Stop Size, kb Gene symbol or sequence ID log2 average
H169 3 57,377,730 57,394,356 16.6 Intergenic 20.7
H546 4 95,018,254 95,034,834 16.5 ENSECAG00000014506 21.0
H369 8 13,128,936 13,134,708 5.7 MZT2B, TUBA3D 21.0
H544 10 51,078,681 51,119,659 40.9 Intergenic 20.9
H545 12 619,419 638,513 19.0 CSTF3 20.7
H544, H546 14 15,353,340 15,560,610 207.2 ENSECAG00000002162 20.7
H544 14 29,406,214 29,432,771 26.5 TET2 21.3
H369 15 14,237,934 14,272,519 34.5 BCL2L11 20.7
H544 15 44,348,596 44,377,735 29.1 eca-mir-217, eca-mir-216a, eca-mir-216b 21.1
H369 16 21,651,711 21,683,467 31.7 Intergenic 20.9
H546 16 65,654,753 65,661,154 6.4 Intergenic 21.1
H544 18 14,064,543 14,101,261 36.7 JU909423 21.0
H546 18 60,925,026 60,954,644 29.6 ENSECAG00000003850 21.2
H252 20 18,917,213 18,969,026 51.8 E2F3 +0.8
H546 20 36,503,850 36,508,477 4.6 SRSF3 21.0
H546 23 27,814,249 27,838,233 23.9 GLDC +0.8
H544 23 46,897,740 46,957,535 59.7 AK140548 20.9
H369 24 44,255,536 44,269,279 13.7 Intergenic 20.7
H544 25 22,614,255 22,768,706 154.4 JO239254 20.5
H544 26 5,796,076 5,840,516 44.4 TIGD1 21.2
H252 27 20,201,870 20,232,375 30.5 MICU3 20.5
H369, H544, H546 28 18,833,995 18,846,757 12.7 UBE2N 21.1
H252 X 203 366,729 366.5 AKAP17A, ASMT, ZBED1, XG 20.5
H544, H546 X 98,506,468 98,543,836 37.3 STAG2 21.1
H252 7 74,885,505 74,911,413 25.9 OR56B4 22.2
H348, H369 29 28,640,862 28,835,337 194.4 AKR1CL1, AKR1C2, AKR1C3, AKR1C4 23.5
doi:10.1371/journal.pgen.1004712.t005
CNVs in Equine Health and Congenital Disorders
features of the CNV profile in horses. Copy number variants account for about 1 to 3 % of the horse genome and there are more CNVs that involve genes than those located in intergenic regions. Though, the number of intergenic CNVs is possibly deflated because all tiling arrays [38,39], including ours, have been biased towards probes for gene exons. For example, 20% of the probes in the Texas-Adelaide WG array represent protein coding genes, whereas these genes make up only about 2–3% of the mammalian genome. Notably, all studies find chr12 as the most CNV-enriched (Table 6) and not because of many CNVs, but because of a few very large clusters of olfactory receptors and immunity-related genes (Tables S8, S10).
Copy number variants and segmental duplications Studies in human [3,60], dogs [8] and cattle [30] have noted strong correlation between CNVs and segmental duplications (SDs). This is because SDs share 90% sequence similarity with another genomic location and can promote CNV formation by non-allelic homologous recombination [61]. Similar tendency has been observed in horses [39], although horse SDs are relatively
small (largest,60 kb) and comprise only about 0.5–0.6 % of the
genome [56], thus less than the portion involved in CNVs (Table 6). Low level of SDs or low copy number repeats was also
reported by a recentde novoanalysis of the equine genome where
no novel classes or types of interspersed repeats were identified [62]. An additional 0.4% of SDs are in unplaced contigs (chrUn) [56], though in this study only 0.04 % of chrUn sequences had
CNVs (Table 2). Likewise, chr25 which is the most SD-rich chromosome (1.7%) according to EquCab2 genome assembly [56], was only moderately enriched with CNVs (0.35%) in this study. Yet, findings by us and others support the correlation between CNVs and SDs in some genomic regions. For example, a known large (750 kb) segmental duplication at the boundary of ELA class I and class III [63] falls into a large common CNVR in chr20:30,127,886–31,231,182 (Table S10); further, low copy number directional repeats have been associated with large deletions in the horse Y chromosome [44] or, GO categories, such as olfactory reception and immune response, prevail among the genes involved both in CNVs and SDs [52]. Therefore, for improved understanding of the genomic architecture of CNVs and their relation to genes and phenotypes in horses, it would be worthwhile to focus future CNV research on associations between CNVs and SDs, as recently successfully done in dogs [8].
Copy number variable genes and intergenic regions It is noteworthy that regardless of the discovery methodology and study cohorts, functional groups of genes that are most affected by CNVs remain the same in all studies. These include genes for transmembrane signal transduction and chemo-attrac-tant sensory perception (olfactory and non-olfactory G-protein coupled receptors, GPCRs), immune response (immunoglobulins, T-cell receptors, MHC protein complexes), and steroid metabo-lism (Table S9). Not coincidentally, CNVs are associated with the same groups of genes in humans [3,64], cattle/ruminants Figure 7. Schematic of the homozygous deletion in chr29, 28.6–28.8 Mb in two XY DSD horses. A. chr29 ideogram showing the location ofAKR1Cgenes and a control geneCREM;B. Detailed map of the CNVR showing the location of genes (black horizontal bars) and CGH signal log2 values for 47 array probes in XY DSD and control horses;C. FISH results with a BAC 23N13 spanning the deletion (green signal) and a control BAC 76H13 forCREMfrom a non-CNVR (red signal);D. PCR with CNVR-specific primers in XY DSD and control horses.
[30,65,66], pigs [31], dogs [32] and even chicken [67], suggesting the importance of inter-individual variation in these genes for adaptive plasticity [68]. Indeed, genetic diversity and fine functional tuning of sensory receptors, immunoglobulins, natural killer and Toll-like receptors is further enhanced by additional mechanisms, such as asynchronous replication which increases the rate of tandem duplications, and monoallelic expression, so that each sensory neuron or lymphoid cell expresses only one allele of a gene [69,70]. Conserved linkage between distinct olfactory receptor genes and the MHC in several mammalian species suggests their concerted function - in this case, MHC-influenced mate choice in reproduction [71]. Olfactory receptors are also thought to function as chemo-sensing receptors to regulate sperm density, motility, acrosome reaction and sperm-egg interaction in fertilization [71,72]. Thus functionally, the CNV-enriched genes in horses and other mammals fall into just three large categories: sensory perception, immunity and reproduction.
Among the 258 CNVRs detected in this study, 20% were located in intergenic regions. These CNVRs were relatively small (average 50 kb, median 35 kb) and represented predominantly
losses (Fig. 2, Table S8). Prevalence of losses among intergenic CNVRs has also been found in dogs [32]. Although there is no information about possible implication of these regions on the function of genes in animal genomes, studies in humans show that intergenic deletions are significantly enriched among gene expression-associated CNVs [73]. Thus, with the improvement of genome sequence assembly and annotation in horses, intergenic CNVRs will be of interest for future studies. We also anticipate that as gene models are revised and converge more with the underlying reality of the genes, some intergenic CNVRs may
become genic andvice versa.
Breed-specific CNVs
One of the goals of CNV research in horses is to find variants that distinguish between breeds or groups of breeds and could be associated with specific adaptations and phenotypic traits of interest. In order to visualize the breeds and the degree of diversity represented in this and previous studies, we performed a phylogenetic analysis using population data of 15 microsatellite loci [74] for the breeds involved (E.G. Cothran, unpublished). The
Table 6.Summary statistics of all CNV studies in horses.
This study Doanet al.2012a
Doanet al.
2012b
Dupuiset al.
2012
Metzgeret al.
2013 Wang et al. 2014
Platform Tiling array Tiling array n/a SNP Beadchip SNP Beadchip Tiling array
Production company Agilent Agilent n/a Illumina Illumina Nimblegen
Genome coverage WG Exons and UTRs WG WG WG WG
No of probes 400K 400K n/a 50K 50K 1.3 M
Method CGH CGH NGS SNP genotyping SNP genotyping CGH
Breeds 16 15 1 4** 17 6
Horses 38 16 1 477 717 6
CNV calling algorithm
ADM-2 ADM-2 Control-FREE
copy number (FREEC)
PennCNV [99] 1) CNVPartition (Illumina); 2) PennCNV [99]; 3) QuantiSNP [100]
segMNT
CNV calling threshold
Log260.5, 5 probes Log260.5, 3 probes Breakpoint
at20.0013; a coefficient of variation 0.045
PennCNV [99] *** Log260.5, 5 probes
No of CNVs per animal
12 to 59 55 to 347 282 n/a Min 1, max n/a 22 to 84
No of CNVs/CNVRs* 258 775 282 478 166–1090 353
Gains 64 398 274 238 n/a 109
Losses 172 315 8 236 n/a 234
Complex 22 62 n/a n/a n/a n/a
CNV size range 1 kb–2.5 Mb 197 bp–3.5 Mb 3.7 kb–4.8 Mb 97 bp–2.7 Mb 516 bp–0.9 Mb** 6.1 kb–0.5 Mb
CNV size, mean, kb 110 5.3 n/a 114 487 38.5
CNV size, median, kb
46 99.4 n/a 61 169 13.1
Genomic
distribution of CNVs
Autosomes, X, Un Autosomes, X Autosomes Autosomes Autosomes Autosomes, except
chr30, 31
Most enriched chr. 12 12 12 12 12 12
Chrs. with the highest no. of CNVs
1; 20 1; 7 30; 31 1 12 20
Genome enrichment %
1.15 3.65 3.53 2.32 1.7–22.0** 0.61
*As reported by original studies and before consolidating overlapping and tandemly located CNVRs into a composite dataset. **Dupuis and colleagues specified only large groups of horses (warmblood, coldblood, draft, pony) but not individual breeds. ***Results by Metzger and colleagues vary between different analysis software packages used.
doi:10.1371/journal.pgen.1004712.t006
CNVs in Equine Health and Congenital Disorders
dendrogram in Figure 8 shows that while the major clades of domestic horses are represented, there is a clear preponderance of the breeds with Thoroughbred ancestry. It is therefore noteworthy that data for 11 new breeds, mainly representing native ponies and draft horses, were added in this study. Nevertheless, the current tally of horse breeds studied for CNVs is 41 (Table S12) which is less than 10% of the over 400 horse breeds known worldwide [75]. Furthermore, given that just 7 breeds have been involved in 2 or more studies (Fig. 8, Table S12) and several breeds are represent-ed by one individual [38,39], any CNV reportrepresent-ed to be brerepresent-ed- breed-specific should be taken with caution. For example, our composite CNV dataset (Table S10) shows that the 18 CNVs reported to be specific for Hanoverians [37] are present in other breeds. Likewise,
only one (chr13: 1,497,390.00–1,508,926.00;EIF2AK1) of the 7
plateau-breed-specific CNVs in heme binding genes [38] is not found in other breeds. The same happened with our data where initially we identified over 10 putative breed-specific CNVs which, after comparison, reduced to 2 - one in Exmoor pony, another in Swiss Warmblood horse (Table S4). Interestingly, no unique CNVs were found in the Przewalski horse which shared similarity mainly with ponies and draft breeds (Table S3). Besides, only 9 of the 25 CNVs in Przewalski horses were shared between the two individuals studied. Similar tendency for intra-breed individual variation was observed for domestic horses where private CNVs predominated over the shared ones. Nevertheless, as suggested by other studies in horses [39], cattle [29], pigs [31] and dogs [33],we anticipate that a small percentage of CNVs might remain unique to their respective breeds, though this requires analysis of much
larger and more diverse equine populations. On the other hand, most horse breeds are of recent origin with a good deal of cross-breeding until closed breeds were established which has led to a high degree of haplotype sharing [56,76], and thereby decreased chances for finding breed-specific CNVRs compared to species like dogs [34].
CNVs and disorders of sexual development
Probably the most exciting goal of CNV research in any species is the discovery of pathogenic variants responsible for complex diseases and congenital disorders. Among these, disorders of sexual development (DSDs) are not uncommon in horses, though causative mutations have been identified for just a few: Y
chromosome deletions in SRY-negative XY sex reversal mares
[44] and a point mutation in the androgen receptor gene in 3
relatedSRY-positive XY mares [77].
Here, we conducted the first pilot CNV analysis in horses with XY DSD and identified a large autosomal (chr29) deletion in 2 related American Standardbreds (H348 and H369, Table 4). The animals were classified as male pseudo-hermaphrodites with XY male genotype, immature testes-like abdominal gonads, and female-like external phenotype (Table 4). The deletion in chr29:28.6–28.8 Mb was homozygous as confirmed by FISH and PCR, and involved at least 8 genes of which 4 belonged to the aldo-keto reductase family 1, member C (AKR1C; Fig. 7). Annotation of these genes in the equine genome is, as yet, preliminary and based on the alignment with human AKR1C proteins in the UCSC Genome Browser (http://genome.ucsc. edu/index.html) and mammalian homology in Ensembl (http:// www.ensembl.org/index.html). Therefore in Fig. 7, three genes
are denoted as AKR1CL1 and one gene has three labels,
corresponding toAKR1C2 in chimpanzee,AKR1C3 in human,
andAKR1C4in cattle.
The AKR1C genes are members of the aldo-keto reductases
(AKR) superfamily [78]and encode for 3a-hydroxysteroid
dehy-drogenases [78] which are critically involved in steroid hormone metabolism [79]. In the human genome, there are 4 family
members -AKR1C1, ALR1C2, AKR1C3and AKR1C4, which
share 86% sequence identity and are clustered in HSA10p15-p14
[78,79]. The human AKR1C genes are not widely expressed:
AKR1C1in brain, kidney, liver and testis, AKR1C2in prostate
and brain, AKR1C3 in prostate and mammary gland, and
AKR1C4 in liver, whereas the rat has a single AKR1C gene
expressed in liver [79,80,81]. Among other functions, theAKR1C
genes are involved in the biochemical pathway that leads to dihydrotestosterone (DHT) synthesis without testosterone inter-mediate. As opposed to ‘classical’ DHT synthesis from cholesterol and testosterone, this pathway is known as ‘the backdoor pathway’ and was originally discovered in marsupials [82] and thereafter in eutherian mammals [45,46,83,84]. The importance of the
‘backdoor pathway’ andAKR1C genes in male sexual
develop-ment was recently demonstrated by a study in humans showing
that mutations inAKR1C2 andAKR1C4genes cause abnormal
virilization and disordered sexual development, including XY sex reversal [46,84]. Even though no mouse knockout models are
available for any of the AKR1C genes (MGI; http://www.
informatics.jax.org/), it is tempting to speculate that the homo-zygous deletion in horse chr29 is a causative or a risk factor for some forms of equine XY DSDs, such as male-pseudohermaph-roditism, as observed in this study. It is also worth mentioning that a CNV analysis of human XY DSDs detected a clinically
significant de novo 64 kb duplication in HSA10p14 [28] - a
genomic segment next to theAKR1Cgene cluster (UCSC: http://
genome.ucsc.edu/cgi-bin/hgGateway). Whether this is a coinci-Figure 8. Genetic relationships of horse breeds studied for
CNVs.A Maximum Likelihood tree showing genetic relationships of the horse breeds that have been studied for CNVs; * new breeds added in this study (except Swiss Warmblood);** breeds involved in 2 or more studies. Numbers denote bootstrap values.
dence or the region includes more copy number variable factors contributing to DSDs, needs further investigation. [45,46,84] [84] [28].
Our findings in horses might be of even broader interest because the two deletion carrying horses were elite American
Standardbred pacers, Martha Maxine and Arizona Helen
(Table 4), whose problematic sexual identity has become public,
making headlines inThe New York Times[85] andThe Horse[86].
Thus, studies are underway to precisely determine the deletion breakpoints and develop molecular tests for detecting other horses with a similar deletion, as well as heterozygous carriers. Finally, the fact that only 2 XY DSD horses out of 6 had this mutation underscores the phenotypic and genetic heterogeneity of these disorders.
Concluding statement
This study represents an important contribution to CNV research in horses by identifying new CNVs and developing an integrated datset of 1476 CNVRs to facilitate the discovery of variants of biomedical importance. However, despite progress, the majority of the CNVRs reported for the horse require proper validation by methodologically comparable studies invloving more diverse breeds and individual animals. Last but not least, due to the very nature of CNVs, these regions are likely to have sequence assemblies not as accurate as non-variable regions. Thus, the findings also identified potential targets for genome re-sequencing and -assembly.
Materials and Methods
Ethics statement
Procurement of peripheral blood and hair was performed according to the United States Government Principles for the Utilization and Care of Vertebrate Animals Used in Testing, Research and Training. These protocols were approved by Texas A&M Office of Research Compliance and Biosafety as AUP2009-115, AUP2012-0250. CRRC09-32 and CRRC09-47.
Array design
A horse WG tiling array was designed using the horse genome
draft sequence (EquCab2, http://www.ncbi.nlm.nih.gov/
assembly/286598; [56], Oligowiz2.0 (http://www.cbs. dtu.dk/
services/OligoWiz/), ArrayOligoSelector (http://arrayoligosel.
sourceforge.net/), and ArrayDesign [87] software packages. The array comprised 417,377 60-mer oligonucleotide probes: 85,852 probes corresponded to one or more exons of the 18,763 annotated equine genes (http://www.ncbi.nlm.nih.gov/genome/ genomes/145?); 305,416 probes originated from intergenic regions (excluding telomeres); 5,716 probes were designed from sub-telomeres (the terminal 1 Mb of each chromosome), and 519 probes represented the horse Y chromosome [58]; our unpub-lished data). [87]For intergenic probes, including chrUn, repeat-masked (http://www.repeatmasker.org/) sequences were used. For reference genes, we first designed probes from exons. If these were not specific, attempts were made to design probes from introns and upstream/downstream flanking regions of those genes. Before inclusion in the array, the specificity of all sequences were analysed with BLAT (http://www.kentinformatics.com/) and BLAST (http://blast.ncbi.nlm.nih.gov/Blast.cgi) against the Equ-Cab2 reference genome sequence. Probes with more than one hit in the genome were discarded. Possible cross-hybridization of the probes was further evaluated using Kane’s parameters [88] and all
probes that had a total percent identity .75–80% with a
non-target sequence, or probes with contiguous stretches of identity.
15 nucleotides with a non-target sequence were discarded. Only
probes with high specificity were kept in the final array. A Cytoband file was generated to align the horse draft sequence assembly with the cytogenetic map [89]. The array, designated as the Texas-Adelaide horse WG tiling array, was fabricated by Agilent Technologies using Agilent SurePrint G3 technology and
26400K chip format (two arrays on a single slide). The array is
available at Agilent Technologies; Design ID#030025, Cat. No
G4124A.
Horses, breeds, phenotypes
The CNV discovery cohort comprised 38 horses representing 16 diverse breeds and the Przewalski’s horse (Table S1). Horse breeds were selected according to the recent population studies [51,56,76,90] with an aim to maximize the genetic diversity among samples and to encompass the common warm blood, cold blood (draft) and native pony breeds. An additional cohort of 52 normal horses representing the same 16 breeds was used for quantitative PCR validation of CNVs. Finally, a pilot study testing the utility of the tiling array for the discovery of CNVs contributing to equine congenital disorders used 6 horses previously diagnosed with XY disorders of sexual development (XY DSDs; Table 4) [44].
DNA isolation
Genomic DNA was isolated from peripheral blood or hair follicles using QIAGEN Gentra PureGene Blood kit (Qiagen) according to manufacturer’s protocol. The DNA was cleaned with DNeasy Blood and Tissue kit (Qiagen) and quality checked by gel electrophoresis and by Nanodrop spectrophotometry (Thermo Scientific).
Array comparative genomic hybridization
Probe labeling and array CGH experiments were performed according to Agilent Technologies Protocol Version 7.3, March
2014 (http://www.chem.agilent.com/Library/usermanuals/
Public/G4410-90010_CGH_Enzymatic_7.3.pdf). All hybridiza-tions comprised of a pair of differently labeled probes, one of which was always the reference DNA – a Thoroughbred mare Twilightfor females and a Thoroughbred stallionBravofor males (see explanations below). The genomic DNA (gDNA) was cleaved
to 200–500 bp fragments with RsaI and AluI (Promega) and
labeled with Cy3 (the reference DNA) or Cy5 (sample DNA) by random priming using Genomic DNA Enzymatic Labeling Kit (Agilent Technologies). The products were cleaned with 30 kDa filters (Amicon) and the yield and specific activity of labeled DNA was determined with a Nanodrop spectrophotometer. Typical
yield for 1mg of starting DNA was 6–8mg; specific activity for Cy3
was 25–40 pmol/mg and for Cy5 20–35 pmol/mg. The hybrid-ization mixture was prepared using Agilent Oligo aCGH Hybridization Kit and contained equal quantity of Cy3 and Cy5
labeled probes, 1mg/mL horse Cot1 DNA, 106blocking agent,
and 26 Hi-RPM buffer. Denatured and pre-annealed probe
mixture was applied onto gasket slide, placed in Agilent SureHyb hybridization chamber, ‘sandwiched’ with an array slide and
incubated in Agilent hybridization oven at 65uC for 40 hours. The
array slides were washed with Agilent aCGH Wash Buffers 1 and 2 and dried with Acetonitrile and Stabilization and Drying Solutions (Agilent Technologies).
Array CGH data analysis
The slides were scanned with Agilent SureScan DNA Micro-array Scanner and Scanner Control software v8.3. The data were extracted and normalized with Agilent Feature Extraction
CNVs in Equine Health and Congenital Disorders
software v10.10.1.1 and saved in.fep format. The Feature Extraction software also checks the quality of aCGH by measuring
Derivative Log2Ratio Standard Deviation (DLRSD),
Signal-To-Noise Ratio (SNR) and Background Signal-To-Noise (BGSignal-To-Noise). The data were analyzed with Agilent Genomic Workbench 5.0 software. In
each array spot log2ratios of Cy3 versus Cy5 were computed with
the defaultP-value threshold 0.05 and overlap threshold value 0.9.
The CNVs were represented by gains and losses of normalized fluorescence intensities relative to the reference and called by
conservative criteria which required alterations of.0.5 log2ratios
over 5 neighboring probes. Homozygous losses were called when
signal log2 ratio was ,22.0. Copy number variable regions
(CNVRs) were determined by ADM-2 algorithm [91] by combining overlapping and adjacent CNVs in all samples across the CGH experiments. Output files were generated with genomic coordinates and cytoband locations for all CNVs. The raw data were submitted to NCBI Gene Expression Omnibus (GEO) accession GSE55266.
Array performance evaluation
To evaluate baseline variations and determine FDR [92,93] female and male self-to-self, and female-to-male control hybrid-izations were conducted using blood DNA from one female and one male Thoroughbred horses. The female Thoroughbred, Twilight, was the DNA donor for the horse reference sequence EquCab2 [56] and the origin of the probes on the tiling array. The
male Thoroughbred, Bravo, a half-sibling to Twilight, was the
DNA donor for the CHORI-241 BAC library (http://bacpac. chori.org/equine241.htm) and the origin of all Y chromosome probes on the array. The FDR was calculated as a percentage of the ratio of CNVs in self-to-self hybridization to the total number of CNVs in all experiments. Additionally, array performance was evaluated by self-to-self hybridizations with blood and hair DNA from one Quarter Horse (H528, Table S1). Hybridization quality was assessed by DLRSD which calculates probe-to probe log ratio
noise of an array; (http://www.chem.agilent.com/Library/
applications/5989-6624EN.pdf): DLRSD ,0.2 was considered
excellent; 0.2$DLRSD#0.3 was good, and values.0.3 indicated
poor quality hybridization.
Chromosome CNVR enrichment
Horse chromosome enrichment percentage was determined by the total length of CNVRs present in each chromosome, divided by chromosome length (Ensembl, http://www.ensembl.org/ index.html).
Gene ontology enrichment analysis
Ensembl gene list (Ensembl Genebuild 73.2) along with their position in the horse genome was added to Agilent Genomic Workbench as a custom track to determine the genic and intergenic CNVs. Gene Ontology analysis (GO) and Kyoto Encyclopedia of Genes and Genomes (KEGG) pathway analysis of the genes present in CNVs were performed using DAVID bioinformatics tool with default settings [94,95]. Because only a limited number of genes in the horse genome have been annotated, horse gene IDs were converted to orthologous human Ensembl gene IDs by BioMart, followed by GO and pathway analyses, as described above. Biological functions of the genes in CNVRs were further analyzed manually by data mining in Ensembl (http://www.ensembl.org/index.html), UCSC (http:// genome.ucsc.edu/) and NCBI (http://www.ncbi.nlm.nih.gov/) Genome Browsers searching for data for equine orthologs in other mammalian species. CNVs present in intergenic regions were analyzed in UCSC genome browser and NCBI and
GeneCards (http://www.genecards.org/) for similarities to known mammalian genes.
A composite CNV dataset for the horse (Table S10) was generated by aligning genomic positions of CNVs/CNVRs from this and all previously published studies [35,36,37,38,39]. Partially or completely overlapping and adjacent CNVs (the end position of a previous CNV and the start position of the next CNV are the same) were consolidated into one CNVR.
Array CGH data validation by qualitative and quantitative PCR
Genomic copy number changes as detected by aCGH were validated by quantitative PCR (qPCR) for 18 selected CNVRs using 22 probe-specific primers. Additionally, 8 putative homozygous deletions were validated by regular (qualitative) PCR. Primers (Table S2) were designed inside CNVRs using array probe sequences and the horse whole genome sequence information (EquCab2 at UCSC: http://genome.ucsc.edu/and Ensembl: http://www.ensembl.org/index.html) and Primer3
software (http://bioinfo.ut.ee/primer3-0.4.0/primer3/input.
htm). The qPCR experiments were performed with LightCycler 480 (Roche Diagnostics) in triplicate assays. Each assay was
done in triplicate 20mL reactions containing 50 ng of template
DNA, 10mM primers and the SYBR Green PCR kit (Roche).
Relative copy numbers of the selected regions were determined in comparison to the reference sample (Thoroughbred and Quarter Horse) and normalized to an autosomal reference gene GAPDH. The cycling conditions were 1 cycle 5 min at 95uC; 45 cycles 10 sec at 95uC, 5 sec at 58uC, and 10 sec at 72uC; 1 cycle for melting curve 30 sec 95uC, 30 sec 65uC and final cooling 20 sec at 50uC. Quantification of the copy number was carried
out using the comparative CTmethod (2DDCt) [96,97] with p,
0.05 as a cut-off threshold for statistical significance. Qualitative PCR results were analyzed by agarose gel electrophoresis.
Array CGH data validation by fluorescence in situ hybridization (FISH)
CNV specific primers were used to screen CHORI-241 BAC library (http://bacpac.chori.org/equine241.htm) by PCR (Table S2); BAC DNA was isolated by Plasmid Midiprep kit (Qiagen), labeled with biotin-16-dUTP or digoxigenin-11-dUTP using Biotin- or DIG-Nick Translation Mix (Roche), and hybridized to metaphase chromosomes of CNV carriers and control horses following standard protocols [98]. A BAC clone representing a non-CNV region was used as a control in each FISH experiment. Images for a minimum of 20 metaphase and/or interphase cells were captured for each experiment and analyzed with a Zeiss Axioplan2 fluorescent microscope equipped with Isis v5.2 (MetaSystems GmbH) software.
Phylogenetic analysis
Genotypes for 15 microsatellite loci [74]; E.G. Cothran, unpublished) were available for 32 out of 41 horse breeds involved in CNV studies (see Table S12). Majority-rule consensus of Restricted Maximum Likelihood (RML) trees were constructed and visualized as described elsewhere [74]. The Przewalski Horse population was used as an out-group.
Supporting Information
Figure S1 Array and aCGH quality control. A. Genome-wide distribution of CNVs in self-to-self hybridization (upper) compared to cumulative hybridizations with all animals (lower) to determine
results for the X chromosome;C. DLRSD values of aCGH using DNA from blood (left) and from hair (right) of the same individual. (PDF)
Figure S2 Homozygous deletions. Confirmation of putative homozygous deletion CNVs (red arrows) by qualitative PCR. (PDF)
Figure S3 Validation of selected CNVRs by quantitative PCR
(qPCR). A1–A14 qPCR was in agreement with aCGH in
discovery horses and their breed-mates; B1–B3 qPCR agrees
with aCGH in the discovery horse (left) but not in additional horses of the same breed (right).
(PDF)
Figure S4 Validation of a copy number gain in chr1 (114.0 Mb)
by FISH. A. and B. – metaphase and interphase of the
Thoroughbred control; C. and D. metaphase and interphase of
a Quarter Horse; red signals - BAC 132B13; green signals inD. –
a single-copy control BAC. Note the difference in copy numbers between homologous chromosomes in both horses.
(PDF)
Table S1 Horse breeds (n = 16) and individuals (n = 38) used in this study.
(XLSX)
Table S2 Primers for quantitative and qualitative PCR to validate CNVs.
(XLSX)
Table S3 List of all 950 CNV calls in the study cohort. (XLSX)
Table S4 Tentative breed-specific CNVRs. (XLSX)
Table S5 258 CNVRs identified in the horse genome in this study.
(XLSX)
Table S6 Gains and losses with high log2alteration values. (XLSX)
Table S7 Genomic locations, names, symbols and known or predicted functions of copy number variable genes.
(XLSX)
Table S8 Intergenic CNVRs. (XLSX)
Table S9 GO analysis of equine copy number variable genes. (XLSX)
Table S10 Integrated dataset of 1476 CNVs/CNVRs in the horse.
(XLSX)
Table S11 Details of validation of 19 selected CNVRs by qPCR. (XLSX)
Table S12 List of horse breeds studied for CNVs. (XLSX)
Acknowledgments
The authors thank Dr. Doug Antzack and Dr. Donald Miller for kindly providing blood samples and fibroblast cell lines for Thoroughbreds Twilight and Bravo, Jana Caldwell for blood samples from a Quarter Horse and a Percheron, Dr. Vincent Gerber for DNA samples from 3 Swiss Warmblood horses, Dr. Molly McCue for DNA samples from 2 American Standardbreds, Dr. Tom A. E. Stout for blood samples from 4 Friesians, and Helena Josefina Kjo¨llerstro¨m for DNA samples from 2 Sorraia horses. We also thank Dr. Scott V. Dindot and Dr. Ryan Doan for valuable advice and discussions regarding array CGH and CNV data analysis, and Agilent Technologies for continuing technical and bioinfor-matics support.
Author Contributions
Conceived and designed the experiments: TR BPC DLA ZQ SG. Performed the experiments: SG ZQ PJD EF TR. Analyzed the data: TR SG BPC DLA ZQ EF EGC RJ. Contributed reagents/materials/analysis tools: EGC RJ SM DGK TLL. Wrote the paper: TR SG BPC EGC DLA.
References
1. Ohno S (1970) Evolution by gene duplication. New York: Springer-Verlag.150 pp.
2. Iafrate AJ, Feuk L, Rivera MN, Listewnik ML, Donahoe PK, et al. (2004) Detection of large-scale variation in the human genome. Nat Genet 36: 949– 951.
3. Redon R, Ishikawa S, Fitch KR, Feuk L, Perry GH, et al. (2006) Global variation in copy number in the human genome. Nature 444: 444–454. 4. Li J, Jiang T, Mao JH, Balmain A, Peterson L, et al. (2004) Genomic segmental
polymorphisms in inbred mouse strains. Nat Genet 36: 952–954.
5. Griffin DK, Robertson LB, Tempest HG, Vignal A, Fillon V, et al. (2008) Whole genome comparative studies between chicken and turkey and their implications for avian genome evolution. BMC Genomics 9: 168.
6. Liu GE, Hou Y, Zhu B, Cardone MF, Jiang L, et al. (2010) Analysis of copy number variations among diverse cattle breeds. Genome Res 20: 693–703. 7. Alvarez CE, Akey JM (2012) Copy number variation in the domestic dog.
Mamm Genome 23: 144–163.
8. Nicholas TJ, Cheng Z, Ventura M, Mealey K, Eichler EE, et al. (2009) The genomic architecture of segmental duplications and associated copy number variants in dogs. Genome Res 19: 491–499.
9. Clop A, Vidal O, Amills M (2012) Copy number variation in the genomes of domestic animals. Animal Genet 43: 503–517.
10. Bickhart DM, Liu GE (2014) The challenges and importance of structural variation detection in livestock. Frontiers in Genetics 5: 37.
11. Weischenfeldt J, Symmons O, Spitz F, Korbel JO (2013) Phenotypic impact of genomic structural variation: insights from and for human disease. Nature Rev Genet 14: 125–138.
12. Conrad DF, Pinto D, Redon R, Feuk L, Gokcumen O, et al. (2010) Origins and functional impact of copy number variation in the human genome. Nature 464: 704–712.
13. Pang AW, MacDonald JR, Pinto D, Wei J, Rafiq MA, et al. (2010) Towards a comprehensive structural variation map of an individual human genome. Genome Biol 11: R52.
14. Beckmann JS, Sharp AJ, Antonarakis SE (2008) CNVs and genetic medicine (excitement and consequences of a rediscovery). Cytogenet Genome Res 123: 7– 16.
15. Beckmann JS, Estivill X, Antonarakis SE (2007) Copy number variants and genetic traits: closer to the resolution of phenotypic to genotypic variability. Nature Rev Genet 8: 639–646.
16. Cooper GM, Nickerson DA, Eichler EE (2007) Mutational and selective effects on copy-number variants in the human genome. Nat Genet 39: S22–29. 17. Rogers AJ, Chu JH, Darvishi K, Ionita-Laza I, Lehmann H, et al. (2013) Copy
number variation prevalence in known asthma genes and their impact on asthma susceptibility. Clin Exp Allergy 43: 455–462.
18. Alvarado DM, Buchan JG, Frick SL, Herzenberg JE, Dobbs MB, et al. (2013) Copy number analysis of 413 isolated talipes equinovarus patients suggests role for transcriptional regulators of early limb development. Eur J Hum Genet 21: 373–380.
19. Robinson JI, Carr IM, Cooper DL, Rashid LH, Martin SG, et al. (2012) Confirmation of association of FCGR3B but not FCGR3A copy number with susceptibility to autoantibody positive rheumatoid arthritis. Hum Mutat 33: 741–749.
20. Peng Y, Chen M, Liu XJ, Liu W, Li Q, et al. (2013) The CYP2C19 genotype does not impact the long-term prognosis of patients with coronary artery disease. Atherosclerosis 227: 106–111.
21. Hitz MP, Lemieux-Perreault LP, Marshall C, Feroz-Zada Y, Davies R, et al. (2012) Rare copy number variants contribute to congenital left-sided heart disease. PLoS Genet 8: e1002903.
22. Lupski JR (2007) Genomic rearrangements and sporadic disease. Nat Genet 39: S43–47.
23. Grayton HM, Fernandes C, Rujescu D, Collier DA (2012) Copy number variations in neurodevelopmental disorders. Progress in Neurobiology 99: 81–91. 24. Carrell DT, Aston KI (2011) The search for SNPs, CNVs, and epigenetic variants associated with the complex disease of male infertility. Syst Biol Reprod Med 57: 17–26.
CNVs in Equine Health and Congenital Disorders