Characterization of methane retrievals from the IASI space-borne sounder
Texto
Imagem


Documentos relacionados
Comparing the spectral properties of the two di ff erent snow accumulation rate time- series (power law compared to piece-wise linear vertical strain rate models), revealed that
5 Seasonal variations in relation to biomass burning In this section we compare the 2009 time series of methanol, formic acid and carbon monoxide for three selected regions subject
In the Southern Hemisphere during the period from Novem- ber 2010 to September 2011 the assimilation of version v.1 of the TANSO data helps in reducing the bias with respect to
IASI observations of tropospheric ozone over the Beijing, Shanghai and Hong Kong areas during one year (2008) have been analysed, demonstrating the capability of space-borne
The cloud optical thickness and the droplet e ff ective radius are retrieved from spectral radiance data in nadir and and from hyperspectral radiances in a 40 ◦ field of view..
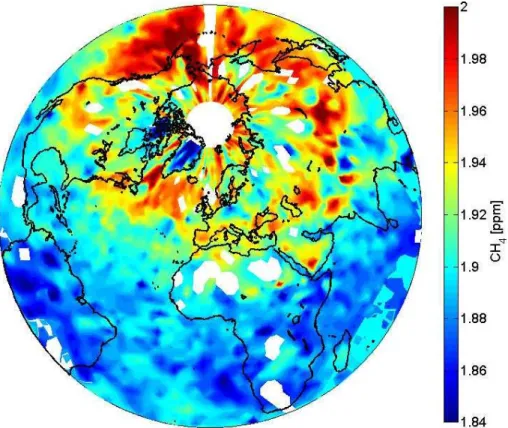
Features of the retrieved methane space-time distribution include: (1) a strong sea- sonal cycle of 30 ppbv in the northern tropics with a maxi- mum in January–March and a minimum
We expect di ff erences to be associated with (i) the di ff erent vertical sensitivity of the two sensors, (ii) with the a priori assumptions, (iii) the auxiliary data (e.g.
Sensitivity of AIRS and IASI brightness temperature variances to wave perturbations with di ff erent vertical wavelengths (left) and horizontal wavelengths (right). Sensitivity
