R E S E A R C H A R T I C L E
Open Access
The cross-national epidemiology of social
anxiety disorder: Data from the World
Mental Health Survey Initiative
Dan J. Stein
1*, Carmen C. W. Lim
2,3,4, Annelieke M. Roest
5, Peter de Jonge
5,6, Sergio Aguilar-Gaxiola
7,
Ali Al-Hamzawi
8, Jordi Alonso
9,10,11, Corina Benjet
12, Evelyn J. Bromet
13, Ronny Bruffaerts
14, Giovanni de Girolamo
15,
Silvia Florescu
16, Oye Gureje
17, Josep Maria Haro
18, Meredith G. Harris
4,19, Yanling He
20, Hristo Hinkov
21,
Itsuko Horiguchi
22, Chiyi Hu
23, Aimee Karam
24, Elie G. Karam
24,25,26, Sing Lee
27, Jean-Pierre Lepine
28,
Fernando Navarro-Mateu
29, Beth-Ellen Pennell
30, Marina Piazza
31,32, Jose Posada-Villa
33, Margreet ten Have
34,35,
Yolanda Torres
36, Maria Carmen Viana
37, Bogdan Wojtyniak
38, Miguel Xavier
39, Ronald C. Kessler
40,
Kate M. Scott
2and WHO World Mental Health Survey Collaborators
Abstract
Background:There is evidence that social anxiety disorder (SAD) is a prevalent and disabling disorder. However, most of the available data on the epidemiology of this condition originate from high income countries in the West. The World Mental Health (WMH) Survey Initiative provides an opportunity to investigate the prevalence, course, impairment, socio-demographic correlates, comorbidity, and treatment of this condition across a range of high, middle, and low income countries in different geographic regions of the world, and to address the question of whether differences in SAD merely reflect differences in threshold for diagnosis.
Methods:Data from 28 community surveys in the WMH Survey Initiative, with 142,405 respondents, were analyzed. We assessed the 30-day, 12-month, and lifetime prevalence of SAD, age of onset, and severity of role impairment associated with SAD, across countries. In addition, we investigated socio-demographic correlates of SAD,
comorbidity of SAD with other mental disorders, and treatment of SAD in the combined sample. Cross-tabulations were used to calculate prevalence, impairment, comorbidity, and treatment. Survival analysis was used to estimate age of onset, and logistic regression and survival analyses were used to examine socio-demographic correlates. Results:SAD 30-day, 12-month, and lifetime prevalence estimates are 1.3, 2.4, and 4.0% across all countries. SAD prevalence rates are lowest in low/lower-middle income countries and in the African and Eastern Mediterranean regions, and highest in high income countries and in the Americas and the Western Pacific regions. Age of onset is early across the globe, and persistence is highest in upper-middle income countries, Africa, and the Eastern Mediterranean. There are some differences in domains of severe role impairment by country income level and geographic region, but there are no significant differences across different income level and geographic region in the proportion of respondents with any severe role impairment. Also, across countries SAD is associated with specific socio-demographic features (younger age, female gender, unmarried status, lower education, and lower income) and with similar patterns of comorbidity. Treatment rates for those with any impairment are lowest in low/lower-middle income countries and highest in high income countries.
(Continued on next page)
* Correspondence:dan.stein@uct.ac.za
1Department of Psychiatry and Mental Health, University of Cape Town, Cape
Town, Republic of South Africa
Full list of author information is available at the end of the article
(Continued from previous page)
Conclusions:While differences in SAD prevalence across countries are apparent, we found a number of consistent patterns across the globe, including early age of onset, persistence, impairment in multiple domains, as well as characteristic socio-demographic correlates and associated psychiatric comorbidities. In addition, while there are some differences in the patterns of impairment associated with SAD across the globe, key similarities suggest that the threshold for diagnosis is similar regardless of country income levels or geographic location. Taken together, these cross-national data emphasize the international clinical and public health significance of SAD.
Keywords:Social anxiety disorder, Social phobia, Cross-national epidemiology, World Mental Health Survey Initiative
Background
There is evidence from both community and clinical studies that social anxiety disorder (SAD), previously termed social phobia, is a prevalent and disabling disorder. In the National Comorbidity Survey (NCS) and National Comorbidity Survey Replication (NCS-R), SAD was one of the most common of all mental disorders (with lifetime prevalence estimates of 16% and 12.1% respectively) [1, 2]. In each of these surveys, SAD age of onset was early, comorbidity with
other mental disorders was high, and subsequent
impairment was notable [3, 4]. Research in clinical settings has also indicated that SAD is a prevalent and disabling condition in this context [5, 6]. Such data have been key in suggesting the clinical and public health relevance of SAD.
Nevertheless, most of the available data on the epidemi-ology of SAD originate from high income countries in the West. European epidemiological data have largely been consistent with US data, emphasizing the high prevalence, comorbidity, and morbidity of SAD [7]. A study using the Diagnostic Interview Schedule in four countries (USA, Canada, Korea, and Puerto Rico) found some consistent patterns, including higher rates in females and considerable comorbidity [8]. Still, many questions about the cross-national epidemiology of SAD remain unanswered. It has been suggested, for example, that anxiety disorders such as SAD are a peculiarly Western construct (in the East, for example, there may be more concern with offending others than with embarrassing oneself) [9]; from this perspective it might be hypothesized that SAD is less prevalent elsewhere, or that thresholds for SAD diagnosis differ across the globe.
Few data have systematically addressed the 30-day prevalence of SAD (which is important in establishing the prevalence at a particular point in time), whether age of onset and persistence vary across a range of different coun-tries, whether impairment associated with SAD differs from place to place, and whether SAD treatment differs across the globe. Data on socio-demographic correlates of SAD and on comorbidity with other mental disorders have again mainly been reported in high income Western contexts. The WHO World Mental Health (WMH) Survey Initiative provides an important opportunity to investigate the epidemiology of SAD across a range of countries. In the
current study, we assessed 30-day, 12-month, and lifetime SAD prevalence; age of onset; persistence; severity of role impairment associated with SAD; and treatment of SAD, across countries. In addition we investigated socio-demographic correlates of SAD, and comorbidity of SAD with other mental disorders, in the combined sample.
Methods
Samples
Interviews were administered in 13 regions classified by the World Bank [10] as high income (Australia, Belgium, France, Germany, Italy, Japan, New Zealand, Northern Ireland, Poland, Portugal, Spain, The Netherlands, USA), seven as upper-middle income (Brazil, Bulgaria, Colombia-Medellin, Lebanon, Mexico, Romania, South Africa), and six as low/lower-middle income (Colombia, Iraq, Nigeria, Peru, People’s Republic of China [PRC], Ukraine). Classified by region, surveys are from Africa (Nigeria, South Africa), the Americas (Brazil, Colombia, Mexico, Peru, USA), East-ern Europe (Bulgaria, Poland, Romania, Ukraine), WestEast-ern Europe (Belgium, France, Germany, Italy, Northern Ireland, Portugal, Spain, The Netherlands), Western Pacific (Australia, Japan, New Zealand, PRC), and Eastern Mediter-ranean (Iraq, Lebanon).
All but ten surveys were based on area probability house-hold samples representative of the entire nation (see Table 1 for survey details). The exceptions were surveys of all ur-banized areas in three countries (Colombia, Mexico, Peru), of a specific region in two countries (Colombia-Medellin, Spain-Murcia), of specific metropolitan areas in three coun-tries (São Paulo in Brazil; a series of cities in Japan; Beijing, Shanghai and Shen Zhen in PRC) and of selected states in one country (Nigeria). Respondents had to be at least 18 years of age in most countries (20 in Japan). Five surveys (Colombia, Colombia-Medellin, Mexico, Peru, Poland) had an upper age limit (64 or 65), and one (Australia) had an upper age limit of 85.
Table 1World Mental Health sample characteristics by World Bank income categories
Country Survey Sample characteristics Field dates Age
rangeb Sample size Responserate (%)
Part 1 Part 2 subsample
Low/lower-middle income countriesa
Colombia NSMH All urban areas of the country (approximately 73% of the total national population)
2003 18–65 4426 2381 87.7
Iraq IMHS Nationally representative 2006–2007 18+ 4332 4332 95.2
Nigeria NSMHW 21 of the 36 states in the country, representing 57% of the national population. The surveys were conducted in Yoruba, Igbo, Hausa and Efik languages
2002–2003 18+ 6752 2143 79.3
Peru EMSMP Five urban areas of the country (approximately 38% of the total national population)
2004–2005 18–65 3930 1801 90.2
PRC Beijing/ Shanghai
B-WMH S-WMH Beijing and Shanghai metropolitan areas 2002–2003 18+ 5201 1628 74.7
PRC Shen Zhen Shenzhen Shen Zhen metropolitan area. Included temporary residents as well as household residents
2006–2007 18+ 7132 2475 80.0
Ukraine CMDPSD Nationally representative 2002 18+ 4725 1720 78.3
Upper-middle income countriesa
Brazil São Paulo Megacity São Paulo metropolitan area 2005–2007 18+ 5037 2942 81.3
Bulgaria NSHS Nationally representative 2003–2007 18+ 5318 2233 72.0
Colombia
(Medellin)c MMHHS Medellin metropolitan area 2011–2012 18–65 3261 1673 97.2
Lebanon LEBANON Nationally representative 2002–2003 18+ 2857 1031 70.0
Mexico M-NCS All urban areas of the country (approximately 75% of the total national population)
2001–2002 18–65 5782 2362 76.6
Romania RMHS Nationally representative 2005–2006 18+ 2357 2357 70.9
South Africa SASH Nationally representative 2003–2004 18+ 4315 4315 87.1
High income countriesa
Australia SMHWB Nationally representative 2007 18–85 8463 8463 60.0
Belgium ESEMeD Nationally representative 2001–2002 18+ 2419 1043 50.6
France ESEMeD Nationally representative 2001–2002 18+ 2894 1436 45.9
Germany ESEMeD Nationally representative 2002–2003 18+ 3555 1323 57.8
Italy ESEMeD Nationally representative 2001–2002 18+ 4712 1779 71.3
Japan WMHJ Eleven metropolitan areas 2002–2006 20+ 4129 1682 55.1
New Zealand NZMHS Nationally representative 2003–2004 18+ 12790 7312 73.3
Northern Ireland NISHS Nationally representative 2004–2007 18+ 4340 1986 68.4
Poland EZOP Nationally representative 2010–2011 18–64 10081 4000 50.4
Portugal NMHS Nationally representative 2008–2009 18+ 3849 2060 57.3
Spain ESEMeD Nationally representative 2001–2002 18+ 5473 2121 78.6
Spain (Murcia) PEGASUS-Murcia Murcia region 2010–2012 18+ 2621 1459 67.4
The Netherlands ESEMeD Nationally representative 2002–2003 18+ 2372 1094 56.4
USA NCS-R Nationally representative 2002–2003 18+ 9282 5692 70.9
Total 142,405 74,843
Weighted average response rate (%) 69.4
aThe World Bank. (2008). Data and Statistics. Accessed May 12, 2009 at:http://go.worldbank.org/D7SN0B8YU0 b
For the purposes of cross-national comparisons we limit the sample to those 18+
cThe newer Colombian survey in Medellin classified Colombia as an upper-middle income country (due to a change of classification by the World Bank),
although in the original survey Colombia was classified as a low/lower-middle income country
Table 2Prevalence of DSM-IV social anxiety disorder (SAD) in the World Mental Health surveys
Country Lifetime
prevalence
12-month prevalence
30-day prevalence
12-month prevalence of SAD among lifetime cases
30-day prevalence
of SAD among 12-month cases Sample size used
% SE % SE % SE % SE % SE
Low/lower-middle income countries 1.6 0.1 1.0 0.1 0.5 0.0 62.6 2.5 52.0 3.4 36,498
Colombia 5.0 0.5 2.9 0.3 1.6 0.3 58.0 4.6 54.9 6.1 4426
Iraq 0.8 0.2 0.7 0.2 0.5 0.2 86.0 7.5 72.0 6.9 4332
Nigeria 0.2 0.1 0.2 0.1 0.1 0.1 96.3 3.9 83.3 11.7 6752
Peru 2.6 0.3 1.4 0.1 0.5 0.1 54.2 3.2 35.5 6.8 3930
PRC China 0.5 0.1 0.4 0.1 0.2 0.1 66.6 11.9 52.8 13.7 5201
PRC Shen Zhen 0.9 0.2 0.7 0.1 0.2 0.1 76.5 6.0 29.3 9.9 7132
Ukraine 2.6 0.2 1.5 0.2 1.0 0.2 59.9 4.9 62.3 7.8 4725
Upper-middle income countries 2.9 0.1 2.1 0.1 1.3 0.1 72.4 2.1 61.4 2.6 28,927
Brazil 5.6 0.4 3.9 0.3 2.7 0.3 70.8 4.5 67.5 5.2 5037
Bulgaria 0.8 0.2 0.6 0.2 0.4 0.1 74.7 7.0 58.9 9.4 5318
Colombia (Medellin) 4.6 0.5 3.8 0.5 2.2 0.4 82.7 3.8 58.3 6.5 3261
Lebanon 1.9 0.4 1.3 0.3 0.8 0.2 67.0 7.0 61.3 9.4 2857
Mexico 2.9 0.2 2.0 0.2 1.1 0.2 69.4 4.0 53.4 4.9 5782
Romania 1.3 0.3 1.0 0.2 0.6 0.2 74.7 8.3 60.1 12.2 2357
South Africa 2.8 0.4 1.9 0.3 1.2 0.2 68.7 5.8 64.4 5.6 4315
High income countries 5.5 0.1 3.1 0.1 1.7 0.1 57.3 1.0 53.1 1.2 76,980
Australia 8.5 0.4 4.2 0.3 1.9 0.2 49.8 2.9 44.7 3.3 8463
Belgium 2.0 0.4 1.2 0.2 0.7 0.2 59.8 7.2 58.4 13.5 2419
France 4.3 0.5 2.6 0.4 1.8 0.3 59.3 5.2 71.8 6.7 2894
Germany 2.5 0.3 1.5 0.2 1.0 0.2 60.4 6.0 63.7 7.7 3555
Italy 1.9 0.2 1.1 0.2 0.6 0.1 60.0 5.4 52.8 8.6 4712
Japan 1.4 0.2 0.7 0.2 0.5 0.1 51.9 8.1 68.4 9.3 4129
New Zealand 9.5 0.3 5.3 0.3 2.8 0.2 56.0 1.8 52.5 2.5 12,790
Northern Ireland 6.0 0.4 4.0 0.3 2.5 0.3 65.8 2.9 63.4 4.6 4340
Poland 1.4 0.1 0.9 0.1 0.5 0.1 63.4 3.8 55.1 4.5 10,081
Portugal 4.7 0.5 3.1 0.4 1.7 0.2 67.1 3.9 54.2 4.8 3849
Spain 1.2 0.2 0.7 0.1 0.4 0.1 56.3 6.9 58.6 12.4 5473
Spain (Murcia) 1.7 0.2 1.2 0.2 0.9 0.2 67.7 11.0 74.4 10.3 2621
The Netherlands 2.6 0.4 1.3 0.3 1.0 0.3 50.8 9.3 73.9 8.1 2372
USA 12.1 0.4 7.1 0.3 3.5 0.2 58.8 1.7 48.9 1.9 9282
All countries combined 4.0 0.1 2.4 0.1 1.3 0.0 60.2 0.8 54.5 1.0 142,405
WHO regionsa
Region of the Americas 6.4 0.2 4.0 0.1 2.1 0.1 62.8 1.3 53.1 1.6 31,718
African region 1.2 0.2 0.9 0.1 0.6 0.1 71.1 5.5 66.7 5.3 11,067
Western Pacific region 5.5 0.2 3.0 0.1 1.5 0.1 54.5 1.5 49.4 1.9 37,715
Eastern Mediterranean region 1.2 0.2 0.9 0.2 0.6 0.1 74.2 5.7 66.0 6.1 7189
Western European region 3.0 0.1 1.9 0.1 1.2 0.1 62.4 1.8 62.3 2.5 32,235
Eastern European region 1.5 0.1 1.0 0.1 0.6 0.1 64.7 2.7 58.6 3.7 22,481
Comparison between countriesb χ227= 78.6*,
P< 0.001
χ227= 46.3*,
P< 0.001
χ227= 25.7*,
P< 0.001
χ227= 3.3*,
P< 0.001
χ227= 2.4*,
respondents were administered the full interview, internal subsampling was used to reduce respondent burden by dividing the interview into two parts. Part 1 assessed core disorders, including SAD, and was administered to all re-spondents. Part 2 included additional disorders and corre-lates and was administered to all Part 1 respondents who met criteria for any lifetime Part 1 disorder plus a prob-ability subsample of other respondents. Part 1 data were weighted to adjust for differential probabilities of selection and to match population distributions on census socio-demographic and geographic distributions. Part 2 data were additionally weighted for the under-sampling of Part 1 respondents without core disorders. Response rates range from a low of 45.9% (France) to 97.2% (Colombia-Medellin) (69.4% weighted average) (Table 1). Technical details about WMH sample design are presented else-where [11].
Measures
The WMH interviews assess prevalence and a wide range of predictors and consequences of numerous anxiety, mood, impulse control, and substance use disorders [12]. The full text of the interview schedule is available at www.hcp.med.-harvard.edu/wmh. The WMH interview schedule was de-veloped in English and translated into other languages using a standardized WHO translation, back-translation, and harmonization protocol described elsewhere [13]. Consist-ent interviewer training and quality control monitoring procedures were used in all surveys to facilitate cross-national comparison [14]. The following sections emphasize the measures considered in the current report.
Mental disorders
SAD and other Diagnostic and Statistical Manual of Mental Disorders (DSM)-IV anxiety (i.e., panic disorder with or without agoraphobia, agoraphobia without panic disorder, generalized anxiety disorder, specific phobia, post traumatic stress disorder, and separation anxiety disorder), mood (i.e., major depressive episode, bipolar disorder), im-pulse control (i.e., intermittent explosive disorder, bulimia nervosa, binge eating disorder, oppositional defiant
disorder, conduct disorder, attention deficit disorder), and substance use disorders (i.e., alcohol abuse and drug abuse with or without dependence) were assessed using Version 3.0 of the WHO Composite International Diagnostic Inter-view (CIDI 3.0) [15], a fully structured lay-administered interview. Respondents were administered the full SAD section if they endorsed a diagnostic stem question for one or more performance or interactional fears described as excessive and causing substantial distress or avoidance. The SAD section screened for lifetime experiences of shy-ness, fear, and discomfort associated with each of 14 social situations. Respondents endorsing one or more such questions were asked about all DSM-IV criteria. Age of onset (AOO) of each disorder was assessed using special probing techniques shown experimentally to improve recall accuracy [16]. CIDI diagnoses were compared to blinded clinical diagnoses using the Structured Clinical Interview for DSM-IV (SCID) [17] in probability subsamples of WMH respondents from France, Italy, Spain, and the USA. As detailed else-where, good CIDI-SCID diagnostic concordance was found for SAD — area under the curve (AUC) = 0.67— and most other DSM-IV/CIDI disorders [18].
Impairment
The Sheehan Disability Scale (SDS) [19] was used to assess recent impairment in role functioning in each of four domains (home, work, relationship, and social) in re-spondents with a 12-month SAD diagnosis. The response scale is from 0 to 10, with severe impairment in a specific role domain defined as a score ≥7. In addition, respon-dents were asked how many days in the past year they were unable to work or carry out their normal activities due to their disorder (days out of role).
Treatment
The 12-month treatment was assessed by asking respon-dents if they had seen any of a list of professionals for problems with emotions, nerves, mental health, or alcohol or drug use, including both inpatient and outpatient care. Sectors included were as follows: specialty mental health Table 2Prevalence of DSM-IV social anxiety disorder (SAD) in the World Mental Health surveys(Continued)
Comparison between low, middle, and high income country groupsb χ
2 2= 387.5*,
P< 0.001
χ22= 224.2*,
P< 0.001
χ22= 121.7*,
P< 0.001
χ22= 21.3*,
P< 0.001
χ22= 4.5*,
P= 0.01 Comparison between WHO regionsb
χ25= 207.5*,
P< 0.001
χ25= 118.4*,
P< 0.001
χ25= 53.2*,
P< 0.001
χ25= 6.1*,
P< 0.001
χ25= 5.2*,
P< 0.001
*Significant at the 0.05 level
a
Region of the Americas(Colombia, Mexico, Brazil, Peru, USA, Medellin);African region(Nigeria, South Africa);Western Pacific region(PRC Shen Zhen, PRC Beijing and Shanghai, Japan, Australia, New Zealand);Eastern Mediterranean region(Iraq, Lebanon);Western European region(Belgium, France, Germany, Italy, The Netherlands, Spain, Northern Ireland, Portugal, Murcia);Eastern European region(Romania, Bulgaria, Poland, Ukraine)
bChi-square test of homogeneity to determine if there is variation in prevalence estimates across countries
Table 3Age at selected percentiles on the standardized age of onset distributions of DSM-IV SAD with projected lifetime risk at age 75
Country Ages at selected percentiles Lifetime prevalence of SAD Projected risk at age 75
5 10 25 50 75 90 95 99 % SE % SE
Low/lower-middle income countries 7 8 11 15 19 26 36 57 1.6 0.1 1.7 0.1
Colombiaa 6 8 11 15 19 26 31 39 5.0 0.5 5.3 0.5
Iraq 7 9 13 14 18 23 36 36 0.8 0.2 0.8 0.2
Nigeria 7 7 7 11 19 23 24 24 0.2 0.1 0.2 0.1
Perua 9 10 13 16 19 27 34 41 2.6 0.3 2.7 0.3
PRC China 8 12 14 14 17 19 37 37 0.5 0.1 0.5 0.1
PRC Shen Zhen 5 7 11 14 18 26 31 41 0.9 0.2 1.0 0.2
Ukraine 7 8 11 14 16 25 37 57 2.6 0.2 2.9 0.3
Upper-middle income countries 5 7 11 15 20 36 49 67 2.9 0.1 3.4 0.2
Brazil 5 7 11 14 17 29 41 54 5.6 0.4 6.1 0.4
Bulgaria 8 8 11 14 18 24 31 38 0.8 0.2 0.9 0.2
Colombia (Medellin)a 5 5 8 13 16 21 31 41 4.6 0.5 4.7 0.5
Lebanon 6 7 11 14 18 20 26 30 1.9 0.4 2.0 0.4
Mexicoa 6 7 11 15 19 26 40 54 2.9 0.2 3.2 0.3
Romania 10 13 14 21 36 58 58 58 1.3 0.3 1.8 0.4
South Africa 11 13 16 26 49 67 67 67 2.8 0.4 4.7 1.2
High income countries 5 6 9 13 17 29 42 59 4.0 0.1 6.0 0.1
Australia 5 6 9 14 20 37 46 68 8.5 0.4 9.6 0.5
Belgium 5 5 7 13 17 25 36 36 2.0 0.4 2.2 0.4
France 7 8 11 14 20 31 45 57 4.3 0.5 4.9 0.5
Germany 7 9 11 14 35 50 62 62 2.5 0.3 3.0 0.5
Italy 5 7 13 15 20 28 36 56 1.9 0.2 2.0 0.3
Japan 5 5 9 13 16 29 43 48 1.4 0.2 1.6 0.2
New Zealand 5 6 8 13 17 27 38 57 9.5 0.3 10.4 0.4
Northern Ireland 5 6 10 14 20 40 49 54 6.0 0.4 7.1 0.5
Polandb 5 5 8 11 14 17 19 21 1.4 0.1 1.4 0.1
Portugal 5 5 9 14 18 29 43 61 4.7 0.5 5.2 0.5
Spain 5 5 9 13 19 22 48 48 1.2 0.2 1.3 0.2
Spain (Murcia) 5 5 5 13 18 33 37 40 1.7 0.2 1.9 0.3
The Netherlands 5 7 11 17 29 41 49 52 2.6 0.4 3.1 0.5
USA 5 6 8 13 15 23 32 51 12.1 0.4 13.0 0.5
All countries combined 5 6 9 14 18 31 44 62 4.0 0.1 4.4 0.1
WHO regions
Region of the Americas 5 6 9 13 17 26 36 52 6.4 0.2 6.9 0.2
African region 7 13 15 23 47 67 67 67 1.2 0.2 2.0 0.5
Western Pacific region 5 6 9 14 18 33 46 66 5.5 0.2 6.1 0.2
Eastern Mediterranean region 6 8 11 14 18 23 26 36 1.2 0.2 1.3 0.2
Western European region 5 6 10 14 20 36 45 61 3.0 0.1 3.4 0.1
Eastern European region 5 7 9 13 17 24 38 58 1.5 0.1 1.7 0.1
aThe projected risk for these countries is at age 65 because the age range of these surveys is between 18–65 bThe projected risk for this country is at age 64 because the age range of this survey is between 18–64
(e.g., psychiatrist and non-psychiatrist mental health spe-cialist), general medical (e.g., general practitioner), human services sector (e.g., religious advisor), and complementary and alternative medicine (e.g., herbalist or homeopath).
Demographic factors
We examined age (18–29, 30–44, 45–59, 60+), time since onset, gender, employment status (student, homemaker, retired, other, employed), marital status (never married, divorced/separated/widowed, currently married), education level (no education, some primary, finished primary, some secondary, finished secondary, some college, finished col-lege), and household income (low, low average, high average, and high, which were based on country-specific quartiles of gross household earnings in the past 12 months) [20].
Statistical analysis
Cross-tabulations were used to calculate prevalence, im-pairment, comorbidity, and treatment. Significance was calculated using Wald and McNemar’s chi-square tests. Survival analysis was used to estimate AOO and projected lifetime risk, as the young age of many respondents biases the AOO distribution downwards. The actuarial method implemented in SAS 9.4 (PROC LIFETEST) was used to generate the AOO curves. Logistic regression and survival
analyses were used to examine socio-demographic corre-lates. Because the data were weighted and clustered, the Taylor series linearization method [21] implemented in the SUDAAN software package 11.0 [22] was used to esti-mate design-based standard errors. Statistical significance was consistently evaluated using two-sided tests, withP< 0.05 considered significant.
Results
Prevalence
On average, the estimated lifetime, 12-month, and 30-day prevalence is highest in high income countries (5.5%, 3.1%, 1.7%), intermediate in upper-middle income coun-tries (2.9%, 2.1%, 1.3%), and lowest in low/lower-middle income countries (1.6%, 1.0%, 0.5%) (Table 2). Prevalence rates are highest in the Americas and the Western Pacific region, and lowest in Africa and the Eastern Mediterra-nean. Across all countries, SAD is a prevalent disorder (4.0%, 2.4%, 1.3%). Comparison of lifetime, 12-month, and 30-day prevalence across all countries, across different income groups, and across different regional groups all reached significance (P< 0.001) (Table 2).
Table 4Severity of role impairment (Sheehan Disability Scale: SDS) associated with 12-month SAD, by country
Country Proportion with severe role impairment (SDS score: 7–10) Number of
12-month cases
Home Work Relationship Social Anya
% SE % SE % SE % SE % SE
Low/lower-middle income countriesc,d,e,g 9.3 1.6 14.1 2.4 18.0 2.6 21.2 2.8 34.3 3.2 349
Colombiac,d,e,g,h 8.1 2.3 18.1 5.2 22.5 4.9 32.3 5.0 43.2 5.3 133
Iraqf 18.0 9.2 9.0 5.4 31.6 12.7 22.7 8.3 48.0 12.6 28
Nigeria 7.8 7.8 28.2 15.7 24.1 13.9 24.1 13.9 36.3 17.4 9
Peru 13.7 4.7 13.4 5.2 11.7 4.0 20.6 7.7 33.0 7.9 51
PRC China 4.9 4.8 4.6 4.6 4.6 4.6 17.4 12.1 26.9 13.0 16
PRC Shen Zhen 2.1 1.9 1.4 1.2 1.2 1.2 6.1 3.5 9.4 4.2 45
Ukrained,h 11.5 4.1 18.4 5.6 23.1 5.8 12.2 4.7 33.0 6.4 67
Upper-middle income countriesc,d,e,f,g 12.7 1.8 17.0 2.5 28.5 2.2 28.5 2.2 39.3 2.6 601
Brazilc,d,e,g 13.9 4.0 20.5 6.1 25.8 3.5 27.7 3.9 36.7 4.7 186
Bulgariad,f 5.3 2.9 2.5 1.0 23.2 11.0 10.0 4.7 25.8 10.8 27
Colombia (Medellin)c,d,e,f,g 12.5 4.0 19.8 4.6 33.5 6.1 33.6 6.0 43.2 6.1 110
Lebanond,e,f,g 14.1 6.4 7.9 5.5 43.7 10.0 33.8 9.8 45.8 9.6 35
Mexicod,e,f,g 7.3 2.0 11.9 3.2 23.4 3.7 28.1 4.2 35.2 4.4 134
Romania 26.0 10.9 31.5 11.9 40.4 12.9 32.0 11.0 56.2 9.8 22
South Africad 16.6 5.2 17.9 6.0 27.4 6.1 28.1 5.9 43.6 8.1 87
High income countriesc,d,e,f,g,h 11.0 0.7 16.8 0.8 23.6 1.0 29.8 1.1 37.7 1.1 2510
Australiac,d,e,f,g,h 17.2 2.7 24.3 2.8 37.2 3.9 43.1 4.2 50.1 4.0 381
Belgiumc,d,e 9.6 6.9 28.1 10.7 37.0 13.1 38.4 8.8 54.9 8.3 28
Francee,g 9.9 5.1 11.0 4.3 17.5 4.0 24.0 5.3 32.9 5.9 72
Germanyc,d,e,g 4.0 3.0 14.1 4.9 20.0 5.9 28.0 7.9 42.2 7.9 58
Italyf 15.9 6.1 7.9 3.9 23.3 6.0 17.1 6.3 33.1 6.9 53
Japanc,d 6.5 5.9 26.2 8.3 20.4 8.0 25.7 9.4 37.8 8.8 25
New Zealandc,d,e,f,g,h 6.1 1.1 12.3 1.3 18.8 1.9 26.7 2.1 32.5 2.1 720
Northern Irelandd,e,g,h 19.6 2.7 24.7 3.0 31.4 3.4 41.4 4.3 52.3 4.1 183
Poland 14.2 4.6 21.3 4.8 18.6 4.5 21.4 5.2 32.4 5.6 91
Portugalc,d,e,g 7.2 2.1 13.4 2.5 15.8 2.7 19.4 3.2 25.1 3.9 124
Spain 8.2 5.4 15.6 7.3 21.2 9.8 17.0 8.2 26.3 10.5 33
Spain (Murcia)c,d,e,f,g 25.8 8.9 41.7 12.7 67.2 11.0 62.4 6.8 71.6 9.4 33
The Netherlandsc 41.9 11.2 56.8 12.7 46.8 13.9 56.1 11.1 63.6 12.0 30
USAc,d,e,f,g,h 10.9 1.3 15.4 1.4 22.6 1.6 28.8 1.4 36.5 1.7 679
All countries combinedc,d,e,f,g,h 11.1 0.7 16.5 0.8 23.9 0.9 28.6 0.9 37.6 1.0 3460
WHO regions
Region of the Americasc,d,e,f,g,h 11.0 1.0 16.5 1.4 23.7 1.3 29.0 1.3 37.5 1.5 1293
African Regiond,e 15.6 4.7 19.1 5.6 27.0 5.6 27.6 5.4 42.7 7.4 96
Western Pacific regionc,d,e,f,g,h 8.1 1.0 14.2 1.1 21.4 1.6 28.7 1.8 34.9 1.8 1187
Eastern Mediterranean Regiond,e,f,g 15.8 5.4 8.4 3.9 38.4 7.9 28.9 7.0 46.8 7.7 63
Western European Regionc,d,e,f,g,h 14.4 1.7 20.2 2.0 26.7 2.0 31.4 2.2 41.7 2.4 614
Eastern European Regionc,d,h 13.2 2.6 18.3 3.1 23.4 3.6 17.6 3.1 34.2 3.7 207
Comparison between countriesb χ227= 2.3*,
P< 0.001
χ227= 2.9*,
P< 0.001
χ227= 3.0*,
P< 0.001
χ227= 2.8*,
P< 0.001
χ227= 2.6*,
Western Pacific (54.5%), and highest in upper-middle in-come countries (72.4%), Africa (71.1%), and the Eastern Mediterranean (74.2%). Across all countries, SAD is a per-sistent disorder (60.2%). The ratio of the 30-day prevalence to 12-month prevalence is an indirect indicator of episode persistence among those with recent disorder. This ratio is again lowest in the Western Pacific (49.4%), and highest in upper-middle income countries (61.4%), Africa (66.7%), and the Eastern Mediterranean (66.0%). Comparison of disorder and episode persistence across all countries, across different income groups, and across different regional groups all reached significance (P< 0.001) (Table 2).
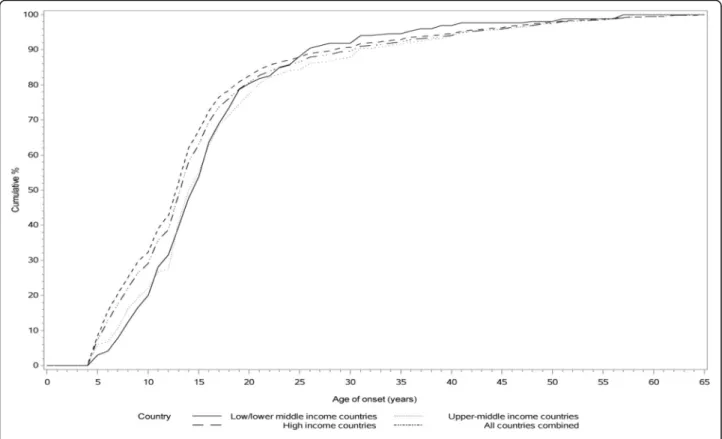
Age of onset
Table 3 and Fig. 1 indicate that the median estimated AOO is similar for high income, upper-middle income, and low/lower-middle income countries. Across all coun-tries, the risk period for onset of SAD ranges from the mid-late adolescence to the early 40s. In high income countries, the earliest median AOO estimates occurr in Poland (50% by age 11), whereas the latest are in The Netherlands (50% by age 17). In upper-middle countries, the earliest median AOO estimates are in Colombia (50% by age 13), and the latest in South Africa (50% by age 26). In low/lower-middle income countries, the earliest me-dian AOO estimates are in Nigeria (50% by age 11), and the latest in Peru (50% by age 16). Projected lifetime risk for SAD across the globe is 4.4%.
Impairment
SAD is associated with substantial impairment in multiple domains of role functioning in the WMH data (Table 4) and with a mean number of days out of work of 24.7 (1.8) in the past year (Appendix 1: Table 8). However, in most countries, the proportion of respondents with 12-month SAD and severe role impairment (SDS score of 7–10) is higher in the domains of relationships and social situa-tions than in the domains of home and work. Further-more, in most countries, between one-third and one-half of respondents with 12-month SAD have severe role im-pairment in at least one domain. Notably, there are no
significant differences between low, middle, and high in-come groups, or between different WHO regions, in the proportion of respondents with severe role impairment in at least one domain.
However, there are significant differences across coun-tries in proportion of 12-month SAD respondents with severe role impairment in any of the domains (ranging from 9.4% in PRC Shen Zhen to 71.6% in Spain-Murcia) (Table 4), and there are also some differences in specific domains across country, income region, and WHO region. The proportion of respondents with severe home impair-ment varies significantly by country and by WHO region; it is lowest in PRC Shen Zhen (2.1%) and the Western Pacific (8.1%), and highest in The Netherlands (41.9%) and the Eastern Mediterranean (15.8%). The proportion of respondents with severe work impairment varies signifi-cantly by country and by WHO region; it is lowest in the PRC Shen Zhen (1.4%) and the Eastern Mediterranean (8.4%), and highest in the Netherlands (56.8%) and West-ern Europe (20.2%). The proportion of respondents with severe relationship impairment varies significantly by country and by income region (lowest in low/lower-mid-dle income countries, i.e., 18%, and highest in upper-middle income countries, i.e., 28.5%). The proportion of respondents with severe social impairment varies by coun-try, by WHO region (lowest in Eastern Europe, i.e., 17.6%, highest in Western Europe, i.e., 31.4%), and by income region (lowest in low/lower-middle income, i.e., 21.2%, highest in high income, i.e., 29.8%).
Socio-demographic correlates
Table 5 shows the bivariate associations of the socio-demographic characteristics with SAD in the combined sample. Both 30-day and lifetime risk of SAD are associated with younger AOO, female gender, not being employed, be-ing unmarried (never married or divorced/widowed/sepa-rated), lower educational status, and low household income. SAD recurrence (as indicated by 12-month SAD in lifetime cases) is associated with female gender, earlier AOO, and being unmarried— while persistence (as indi-cated by 30-day SAD in 12-month cases) is associated with Table 4Severity of role impairment (Sheehan Disability Scale: SDS) associated with 12-month SAD, by country(Continued)
Comparison between low, middle,
and high income country groupsb χ 2 2= 1.0,
P= 0.371
χ22= 0.6,
P= 0.561
χ22= 4.7*,
P= 0.008
χ22= 4.1*,
P= 0.016
χ22= 0.8,
P= 0.463 Comparison between WHO regionsb
χ25= 2.9*,
P= 0.013
χ25= 2.3*,
P= 0.042
χ25= 1.5,
P= 0.180
χ25= 2.7*,
P= 0.020
χ25= 1.5,
P= 0.175
*Significant at the 0.05 level
a
Highest severity category across four SDS role domains
bChi-square test of homogeneity to determine if there is variation in impairment severity across countries. McNemar
’s chi-square test to determine if there is a significant difference forchome vs work impairment,dhome vs relationship impairment,ehome vs social impairment,fwork vs relationship impairment,gwork vs
social impairment,hrelationship vs social impairment for each row entry. For example,cfor Colombia indicates that the proportion with severe impairment
Table 5Bivariate associations between socio-demographics correlates and DSM-IV social anxiety disorder (all countries combined)
Correlates 30-day Social
Anxiety Disordera Lifetime SocialAnxiety Disorderb 12-month Social AnxietyDisorder among lifetime casesc 30-day Social Anxiety Disorderamong 12-month casesc
OR (95% CI) OR (95% CI) OR (95% CI) OR (95% CI)
Age-cohort
18-29 3.2* (2.6-3.9) 3.6* (3.2-4.0)
30-44 2.8* (2.3-3.4) 2.9* (2.6-3.2)
45-59 2.5* (2.0-3.1) 2.4* (2.1-2.6)
60+ 1.0 1.0
Age-cohort differenced χ23= 145.4*,P< .001 χ23= 547.3*,P< .001
Age of onset
Early 1.5* (1.2-1.8) 1.0 (0.7-1.2)
Early-average 1.4* (1.1-1.7) 0.9 (0.7-1.2)
Late-average 1.1 (0.9-1.3) 0.9 (0.8-1.2)
Late 1.0 1.0
Age of onset differenced χ23= 15.4*,P= 0.002 χ23= 0.5,P= 0.926
Time since onset (Continuous) 0.98* (0.98-0.99) 1.01* (1.00-1.01)
χ21= 63.1*,P< .001 χ21= 5.0*,P= 0.025
Gender
Female 1.7* (1.5-1.9) 1.3* (1.2-1.4) 1.3* (1.2-1.5) 1.2* (1.0-1.4)
Male 1.0 1.0 1.0 1.0
Gender differenced χ21= 65.3*,P< .001 χ21= 61.5*,P< .001 χ21= 15.7*,P< .001 χ21= 5.9*,P= 0.015
Employment status
Student 1.4* (1.1-1.9) 1.2 (1.0-1.4) 1.1 (0.8-1.6) 2.1* (1.4-3.0)
Homemaker 1.5* (1.3-1.7) 1.2* (1.1-1.3) 1.4* (1.1-1.7) 1.4* (1.1-1.8)
Retired 0.6* (0.5-0.8) 0.9 (0.7-1.0) 1.0 (0.7-1.3) 0.9 (0.6-1.3)
Other 1.8* (1.5-2.1) 1.5* (1.3-1.6) 2.0* (1.6-2.6) 1.0 (0.8-1.3)
Employed 1.0 1.0 1.0 1.0
Employment status differenced χ24= 81.8*,P< .001 χ24= 63.6*,P< .001 χ24= 36.9*,P< .001 χ24= 20.4*,P< .001
Marital status
Never married 1.2* (1.1-1.4) 1.4* (1.3-1.5) 1.3* (1.1-1.6) 1.0 (0.8-1.2)
Divorced/separated/widowed 1.5* (1.3-1.7) 1.3* (1.2-1.5) 1.4* (1.1-1.6) 1.0 (0.8-1.3)
Currently married 1.0 1.0 1.0 1.0
Marital status differenced χ22= 26.6*,P< .001 χ22= 75.7*,P< .001 χ22= 18.4*,P< .001 χ22= 0.2,P= 0.887
Education level
No education 1.3 (0.8-2.2) 0.8 (0.6-1.2) 5.6* (2.2-14.4) 1.2 (0.6-2.6)
Some primary 1.8* (1.3-2.4) 1.1 (0.9-1.3) 3.0* (2.1-4.3) 1.7* (1.1-2.8)
Finished primary 1.5* (1.2-2.0) 1.2 (1.0-1.4) 2.0* (1.4-2.8) 1.1 (0.7-1.8)
Some secondary 1.4* (1.1-1.7) 1.2* (1.1-1.3) 1.6* (1.3-2.0) 1.0 (0.8-1.4)
Finished secondary 1.0 (0.8-1.2) 1.1 (1.0-1.2) 1.3* (1.1-1.6) 0.8 (0.6-1.0)
Some college 1.0 (0.8-1.2) 1.1 (1.0-1.2) 1.3* (1.0-1.6) 0.8 (0.6-1.0)
Finished college 1.0 1.0 1.0 1.0
Education level differenced χ26= 33.6*,P< .001 χ26= 16.2*,P= 0.013 χ26= 54.1*,P< .001 χ26= 14.8*,P= 0.022
Household income
Low 1.4* (1.2-1.7) 1.1* (1.0-1.2) 1.6* (1.3-1.9) 1.4* (1.0-1.8)
female gender but not with earlier AOO or marital status. SAD recurrence is particularly highly associated with lower education (with no education having an odds ratio [OR] of 5.6, confidence interval [CI] 2.2–14.4), SAD persistence is particularly associated with being a student (OR of 2.1, CI 1.4–3.0), and both recurrence and persistence are associated with being a homemaker. Socio-demographic correlates are similar across countries for the most part, but also demonstrate some differences (Appendix 2: Table 9, Appendix 3: Table 10, and Appendix 4: Table 11).
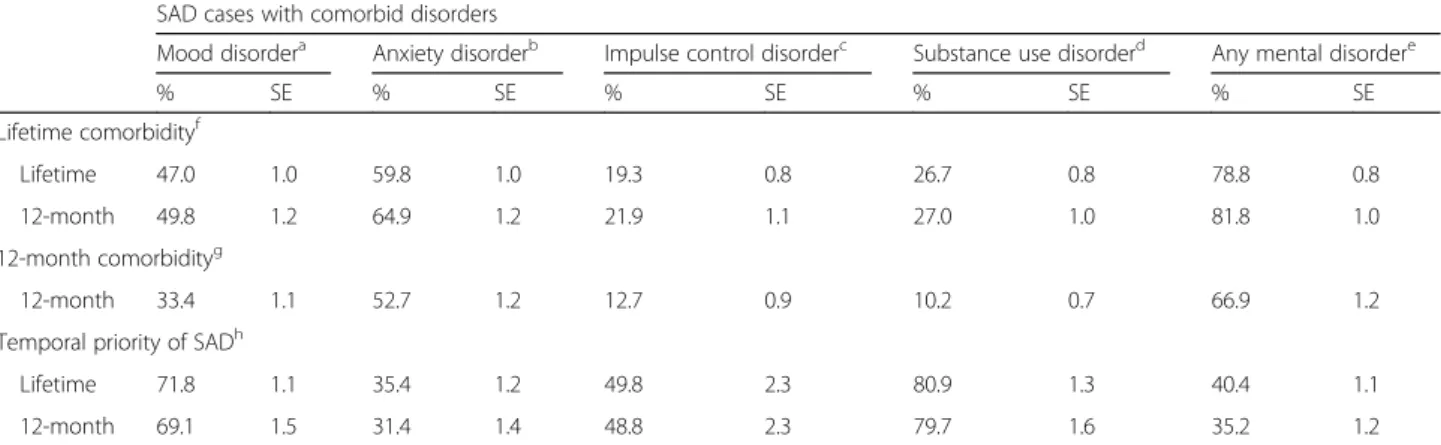
Comorbidity
Table 6 shows that respondents with either lifetime or 12-month SAD are most likely to meet lifetime criteria for other anxiety disorders (59.8% and 64.9%), less likely to meet lifetime criteria for mood and substance use disor-ders, and least likely to meet lifetime criteria for impulse control disorders (19.3% and 21.9%); in both cases around
80% of such respondents meet lifetime criteria for any other mental disorder. Similarly, respondents with 12-month SAD are most likely to meet 12-12-month criteria for other anxiety disorders (52.7%), less likely to meet 12-month criteria for mood and impulse control disorders, and least likely to meet 12-month criteria for substance use disorders (10.2%); with 66.9% of such respondents meeting 12-month criteria for any other disorder. For both lifetime and 12-month SAD, SAD begins earlier in only 31.4–35.4% of cases of anxiety disorder, but SAD begins earlier in 48.8–80.9% of cases of mood disorder, substance use disorder, or impulse control disorder.
Treatment
Among those with 12-month SAD, the percentage reporting treatment of any kind (i.e., specialty mental health, general medical care, health care, human services, complementary and alternative medicine, non-health care) in the past Table 5Bivariate associations between socio-demographics correlates and DSM-IV social anxiety disorder (all countries combined)
(Continued)
High-average 1.1 (0.9-1.3) 1.0 (0.9-1.1) 1.1 (0.9-1.4) 1.1 (0.9-1.4)
High 1.0 1.0 1.0 1.0
Household income differenced
χ23= 19.4*,P< .001 χ23= 10.5*,P= 0.015 χ23= 23.1*,P< .001 χ23= 6.9,P= 0.077
Ne 142,405 6,081,561 5758 3460
*Significant at the .05 level, 2 sided test
aThese estimates are based on logistic regression models adjusted for age, gender and country
bThese estimates are based on survival models adjusted for age-cohorts, gender, person-years and country c
These estimates are based on logistic regression models adjusted for time since social anxiety disorder onset, age of social anxiety disorder onset, gender and country
dChi square test of significant differences between blocks of sociodemographic variables
eDenominator N: 142,405 = total sample; 6,081,561 = number of person-years in the survival models; 5,758 = number of lifetime cases of social anxiety disorder;
3,460 = number of 12-month social anxiety disorder cases
Table 6Comorbidity of SAD with other DSM-IV disorders
SAD cases with comorbid disorders
Mood disordera Anxiety disorderb Impulse control disorderc Substance use disorderd Any mental disordere
% SE % SE % SE % SE % SE
Lifetime comorbidityf
Lifetime 47.0 1.0 59.8 1.0 19.3 0.8 26.7 0.8 78.8 0.8
12-month 49.8 1.2 64.9 1.2 21.9 1.1 27.0 1.0 81.8 1.0
12-month comorbidityg
12-month 33.4 1.1 52.7 1.2 12.7 0.9 10.2 0.7 66.9 1.2
Temporal priority of SADh
Lifetime 71.8 1.1 35.4 1.2 49.8 2.3 80.9 1.3 40.4 1.1
12-month 69.1 1.5 31.4 1.4 48.8 2.3 79.7 1.6 35.2 1.2
aRespondents with major depressive episode or bipolar disorder (broad)
bRespondents with panic disorder, generalized anxiety disorder, specific phobia, agoraphobia, post-traumatic stress disorder, or separation anxiety disorder cRespondents with intermittent explosive disorder, conduct disorder, attention deficit disorder, oppositional defiant disorder, binge eating disorder, or
bulimia nervosa
dRespondents with alcohol abuse with or without dependence or drug abuse with or without dependence eRespondents with any disorder listed above
fPercentage of respondents with either lifetime or 12-month SAD who also meet lifetime criteria for at least one of the other DSM-IV disorders gThe human services sector or complementary and alternative medicine (CAM) sector
hPercentage of respondents with either lifetime or 12-month SAD and at least one of the other disorders, whose age of onset of SAD is reported to be younger
than the age of onset of all comorbid disorders under consideration (i.e., either mood, anxiety, substance use, impulse control, or any disorder)
Table 7Among those with 12-month SAD, percent reporting treatment in the past 12 months by Sheehan impairment severity
Sector of treatment Sheehan Disability Scale (SDS) categorya
Mild impairment Moderate impairment Severe impairment Any impairment
(Score: 1–3) (Score: 4–6) (Score: 7–10)
% SE Comparison
between countriesb % SE Comparisonbetween countriesb % SE Comparisonbetween countriesb % SE Comparisonbetween countriesb
Specialty mental healthc
Low/lower-middle income
10.7 6.0 χ2= 1.4,P= 0.25 5.2 2.4 χ2= 3.4*,P= 0.03 6.3 2.3 χ2= 33.4*,P< 0.001 7.8 1.9 χ2= 32.6*,P< 0.001
Upper-middle income
13.9 4.2 12.4 2.6 15.3 3.0 13.2 1.7
High income 19.2 2.0 12.6 1.4 34.4 1.7 23.3 0.9
All countries combined
17.5 1.7 11.7 1.1 27.7 1.4 19.8 0.8
General medicald
Low/lower-middle
income – –
χ2= 14.4*,P< 0.001 9.9 3.7 χ2= 5.1*,P= 0.01 7.0 2.4 χ2= 44.8*,P< 0.001 7.8 1.7 χ2= 65.6*,P< 0.001
Upper-middle income
13.8 3.9 12.3 3.1 15.0 2.8 13.7 1.7
High income 28.8 2.2 20.9 1.9 39.0 1.9 30.8 1.1
All countries combined
23.9 1.8 17.8 1.5 31.0 1.5 25.2 0.9
Health caree
Low/lower-middle income
12.4 6.0 χ2= 8.6*,P< 0.001 15.0 4.1 χ2= 3.3*,P= 0.04 12.7 3.2 χ2= 43.7*,P< 0.001 14.5 2.6 χ2= 54.3*,P< 0.001
Upper-middle income
23.6 4.6 22.6 3.4 26.0 3.6 23.7 1.9
High income 36.7 2.3 26.7 2.0 54.6 1.9 40.9 1.1
All countries combined
32.0 2.0 24.5 1.6 44.6 1.6 34.9 0.9
Human servicesf
Low/lower-middle
income – –
χ2= 5.1*,P= 0.01 – – χ2= 0.3,P= 0.76 3.5 1.7 χ2= 5.1*,P= 0.01 3.4 1.3 χ2= 2.5,P= 0.08
Upper-middle income
4.5 2.4 4.8 2.0 2.3 1.2 3.6 1.1
High income 7.7 1.6 3.5 0.8 7.1 1.0 5.7 0.5
All countries combined
6.5 1.2 3.9 0.8 5.8 0.7 5.1 0.5
CAMg
Low/lower-middle income
– – – – – χ2= 14.3*,P< 0.001 – – χ2= 12.5*,P< 0.001 1.6 0.6 χ2= 26.9*,P< 0.001
Upper-middle
income – –
2.7 1.4 2.5 1.2 2.3 0.7
High income 9.1 1.7 5.2 0.9 8.5 1.0 7.8 0.6
All countries combined
7.3 1.3 4.0 0.7 6.6 0.8 6.1 0.5
Non-health careh
Low/lower-middle
income – –
χ2= 6.3*,P< 0.001 – – χ2= 0.2,P= 0.80 4.7 1.8 χ2= 11.9*,P< 0.001 4.5 1.4 χ2= 15.1*,P< 0.001
Upper-middle income
5.0 2.4 7.3 2.3 4.7 1.7 5.6 1.3
12 months differs significantly by impairment, with 38% re-ceiving any treatment (Table 7). Across all countries, any treatment is lowest in those with moderate impairment (27.4%), and highest in those with severe impairment (46.9%). This pattern holds true for specialty mental health, general medical care, and health care, but human services, complementary and alternative medicine, and non-health care are most commonly used by those with mild impair-ment. Treatment rates for those with any impairment are lowest in low/lower-income countries (18.0%), and highest in high income countries (44.2%). This pattern holds true for cases with any impairment across all treatment sectors, and for almost all treatment sectors across different levels of impairment.
Discussion
A number of limitations of the current study deserve men-tion. A first important issue is that of sampling. Response rates differ widely across the WMH surveys [12]; while re-sponse rates do not appear to be related to SAD prevalence, it is possible that in some settings, particularly those where treatment is less available, those with the most severe SAD were unable to participate in surveys. Surveys also differed in their focus; some included only metropolitan areas, while others employed nationally representative samples; such differences may also have affected prevalence estimates. The surveys also excluded a range of respondents, includ-ing institutionalized patients, and people who were too in-toxicated to be interviewed. Finally, samples in the WMH surveys also reflected survivor bias; given the 10- to 15-year
gap in life expectancy between those in lower and higher income countries, this may also affect prevalence estimates [23]. Taken together, the prevalence rates provided here are therefore conservative. It is also relevant to note that only two African countries were studied, limiting conclusions about distinctions across geographic regions.
Second, the measure of SAD used in the WMH sur-veys has important limitations. The CIDI relies on a screening section that employs relatively few stem ques-tions, and this may lead to under-estimation of SAD in some settings (as noted, there is no stem question that addresses the symptom of offending others, which is thought to characterize social anxiety in some cultures, and which is now captured in the DSM-5 diagnostic criteria for SAD) [24–27]. Furthermore, no attempt was made to develop distinct cut-off points for SAD in different countries or to go beyond the DSM-IV criteria to develop distinct criteria for different countries that might have increased detection of SAD. It is relevant to emphasize that in countries where blinded clinical reappraisal interviews were undertaken, there was no evidence for systematic bias in the diagnostic threshold for SAD [18]. However, clinical reappraisal interviews were carried out in only a subset of WMH countries, and it is possible that such studies would have found systematic differences in CIDI sensitivity and specificity across contexts.
Bearing in mind these limitations, the WMH surveys provide unique cross-national data on SAD, and are able to address a number of questions about this disorder. Some Table 7Among those with 12-month SAD, percent reporting treatment in the past 12 months by Sheehan impairment severity
(Continued)
All countries combined
11.3 1.5 7.2 1.0 11.0 1.0 9.8 0.6
Any treatmenti
Low/lower-middle income
15.9 6.1 χ2= 9.2*,P< 0.001 20.2 4.9 χ2= 2.0,P= 0.13 15.3 3.4 χ2= 44.5*,P< 0.001 18.0 2.7 χ2= 52.3*,P< 0.001
Upper-middle income
26.6 4.7 24.6 3.5 27.2 3.7 25.7 2.1
High income 41.8 2.5 29.5 2.0 57.1 1.9 44.2 1.1
All countries combined
36.6 2.1 27.4 1.7 46.9 1.6 38.0 1.0
*Significant at the 0.05 level
A dash was inserted for low cell counts (<5 cases)
aHighest severity category across four SDS role domains b
Chi-square test of homogeneity to determine if there is variation in prevalence of treatment estimates across countries. Chi-square test is only generated where there is more than one stable cell (> = 5 cases) for each combination of treatment sector and Sheehan impairment
cThe mental health specialist sector, which includes psychiatrist and non-psychiatrist mental health specialists (psychiatrist, psychologist, or other non-psychiatrist
mental health professional; social worker or counselor in a mental health specialty setting; use of a mental health helpline; or overnight admissions for a mental health or drug or alcohol problems, with a presumption of daily contact with a psychiatrist)
dThe general medical sector (general practitioner, other medical doctor, nurse, occupational therapist, or any health care professional) eThe mental health specialist sector or the general medical sector
fThe human services sector (religious or spiritual advisor or social worker or counselor in any setting other than a specialty mental health setting) g
The CAM (complementary and alternative medicine) sector (any other type of healer such as herbalist or homeopath, participation in an Internet support group, or participation in a self-help group)
hThe human services sector or CAM
cross-national differences in SAD epidemiology are apparent: SAD 30-day, 12-month, and lifetime prevalence are lowest in low/lower-middle income countries and in the African and Eastern Mediterranean regions, highest in upper-middle income countries and the Americas and the Western Pacific regions, and there are some differences in domains of role impairment and in treatment rates across country, income region, and WHO region. Crucially, how-ever, there are a number of consistent patterns across the globe: SAD has an early age of onset, is a persistent disorder, and is associated with specific socio-demographic features (younger age, female sex, unmarried status, lower education, and lower income) and with similar patterns of comorbidity and health care utilization.
A previous cross-national study indicated that SAD prevalence differs across different countries, with life-time prevalence estimates ranging from 0.5 in Korea to 2.6 in the USA [8]. However, that survey was done in only four countries, and assessed only three social fears as part of the simple phobia section of the Diagnostic Interview Schedule. The current data extend such work with surveys across a broad range of countries, and with a comprehensive assessment of SAD. Differences in prevalence across countries continue to be observed, as is the case for other common mental disorders in the WMH surveys. Such differences may reflect artifactual variation across surveys (for example, mental disorder stigma may be higher in lower income settings, resulting in decreased willingness to self-disclose, and an under-estimation of prevalence) or cross-national differences in underlying mechanisms relevant to pathogenesis (for ex-ample, greater access to greater social capital and more community engagement in lower income countries).
However, the finding here of similar proportions of SAD respondents with any severe role impairment across coun-try income and geographic groupings suggests that differ-ences in prevalence are not simply due to regional differences in diagnostic thresholding. In higher income countries and in particular regions of the globe such as the Americas, Western Pacific, and Western Europe, there is a higher prevalence of SAD, and SAD is associated with more impairment in the social domain than in other do-mains, suggesting high demands for social performance in such contexts. The persistence of SAD as well as propor-tion with any role impairment are highest in upper-middle income countries, Africa, and the Eastern Mediterranean, perhaps pointing to growing performance demands in these regions, but with fewer treatment resources than in higher income countries. The disjunction between lower prevalence but higher persistence of SAD in particular re-gions may be valuable in suggesting hypotheses, such as this one, about relevant causal mechanisms in SAD.
Our findings that SAD epidemiology demonstrates similar patterns across the globe, being associated
with early age of onset, impairment in multiple do-mains, characteristic socio-demographic correlates (younger age, female gender, unmarried status, lower education, lower household income), and particular patterns of mental disorder comorbidity, again con-firms and extends previous work. Thus, for example, we were able to demonstrate that across the globe SAD disorder persistence is particularly highly associ-ated with lower education, episode persistence is par-ticularly associated with being a student, while both disorder and episode persistence are associated with being a homemaker. While it has previously been demonstrated that SAD more likely follows other anx-iety disorders, and precedes depression [1], here we provide novel data on the comorbidity of SAD with impulse control disorders; this is valuable given that a link between social anxiety and aggression has been posited in the animal and clinical literature [28, 29]. It is notable that in both lifetime and 12-month SAD, SAD begins earlier in only 31.4–35.4% of cases of co-morbid anxiety disorder, due to the common comor-bidity with specific phobia which has the earliest onset of the anxiety disorders, but SAD begins earlier in 48.8–80.9% of cases of comorbid mood disorder, substance use disorder, or impulse control disorder. We also provide novel data on treatment rates; these are highest where impairment is most severe and in countries with higher income.
Conclusions
Appendix 1
Appendix 2
Table 8Days out of role due to 12-month SAD by role impairment Sheehan disability
domain
Days out of role due to 12-month social anxiety phobiab
Severe (Score: 7-10) Not severe (Score: 0-6) Ftest,Pvaluec
Number (n) Mean SE Number (n) Mean SE
Home 2010 12.8 1.2 355 92.6 8.8 75.9*,P< 0.001
Work 1804 8.4 0.9 536 84.0 6.9 116.6*,P< 0.001
Relationship 1629 11.4 1.5 743 54.2 4.7 67.5*,P< 0.001
Social 1472 9.4 1.3 901 49.8 4.1 82.6*,P< 0.001
Anya 1183 4.5 0.7 1193 45.4 3.5 124.3*,P< 0.001
*Significant at the 0.05 level
aMean days out of role presented for subgroups of respondents defined by their highest severity category across the four Sheehan disability domains (home,
work, relationship, and social)
bMean (SE) days out of role due to 12-month SAD: 24.7 (1.8) days
cBivariate linear regression to test for significant differences in severity. No controls were used
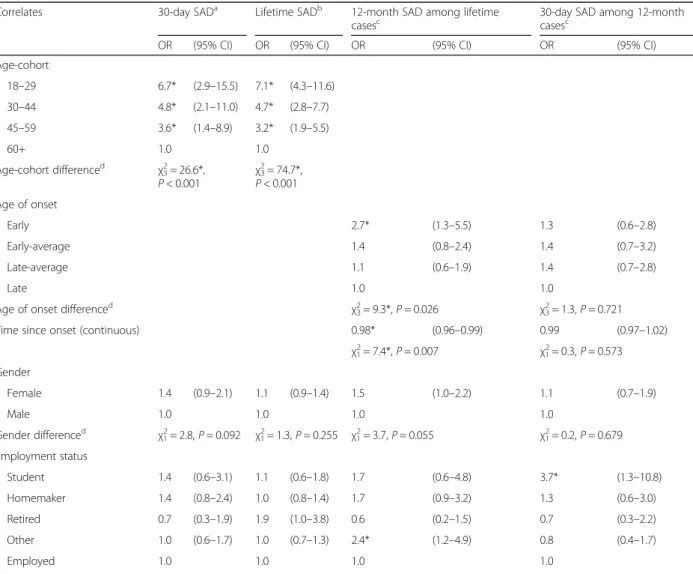
Table 9Bivariate associations between socio-demographics correlates and DSM-IV SAD (low/lower-middle income countries) Correlates 30-day SADa Lifetime SADb 12-month SAD among lifetime
casesc
30-day SAD among 12-month casesc
OR (95% CI) OR (95% CI) OR (95% CI) OR (95% CI)
Age-cohort
18–29 6.7* (2.9–15.5) 7.1* (4.3–11.6)
30–44 4.8* (2.1–11.0) 4.7* (2.8–7.7)
45–59 3.6* (1.4–8.9) 3.2* (1.9–5.5)
60+ 1.0 1.0
Age-cohort differenced
χ23= 26.6*,
P< 0.001
χ23= 74.7*,
P< 0.001
Age of onset
Early 2.7* (1.3–5.5) 1.3 (0.6–2.8)
Early-average 1.4 (0.8–2.4) 1.4 (0.7–3.2)
Late-average 1.1 (0.6–1.9) 1.4 (0.7–2.8)
Late 1.0 1.0
Age of onset differenced χ23= 9.3*,P= 0.026 χ23= 1.3,P= 0.721
Time since onset (continuous) 0.98* (0.96–0.99) 0.99 (0.97–1.02)
χ21= 7.4*,P= 0.007 χ21= 0.3,P= 0.573
Gender
Female 1.4 (0.9–2.1) 1.1 (0.9–1.4) 1.5 (1.0–2.2) 1.1 (0.7–1.9)
Male 1.0 1.0 1.0 1.0
Gender differenced χ21= 2.8,P= 0.092 χ21= 1.3,P= 0.255 χ21= 3.7,P= 0.055 χ21= 0.2,P= 0.679
Employment status
Student 1.4 (0.6–3.1) 1.1 (0.6–1.8) 1.7 (0.6–4.8) 3.7* (1.3–10.8)
Homemaker 1.4 (0.8–2.4) 1.0 (0.8–1.4) 1.7 (0.9–3.2) 1.3 (0.6–3.0)
Retired 0.7 (0.3–1.9) 1.9 (1.0–3.8) 0.6 (0.2–1.5) 0.7 (0.3–2.2)
Other 1.0 (0.6–1.7) 1.0 (0.7–1.3) 2.4* (1.2–4.9) 0.8 (0.4–1.7)
Table 9Bivariate associations between socio-demographics correlates and DSM-IV SAD (low/lower-middle income countries)
(Continued)
Employment status differenced
χ24= 2.7,P= 0.606 χ24= 4.2,P= 0.387 χ24= 9.9*,P= 0.043 χ24= 7.4,P= 0.115
Marital status
Never married 1.1 (0.7–1.7) 1.4* (1.1–1.8) 0.8 (0.5–1.3) 1.0 (0.5–1.8)
Divorced/separated/widowed 1.3 (0.8–2.1) 1.3 (0.9–1.8) 1.0 (0.5–2.1) 1.2 (0.5–2.7)
Currently married 1.0 1.0 1.0 1.0
Marital status differenced
χ22= 0.8,P= 0.664 χ22= 7.4*,P= 0.025 χ22= 1.0,P= 0.613 χ22= 0.2,P= 0.927
Education level
No education 1.2 (0.4–3.1) 0.9 (0.5–1.8) – – 1.1 (0.3–3.6)
Some primary 1.4 (0.6–3.2) 0.9 (0.5–1.4) 1.5 (0.6–4.2) 2.8 (0.9–8.9)
Primary finished 1.9 (0.8–4.1) 1.1 (0.7–1.8) 1.6 (0.7–3.7) 2.0 (0.7–6.2)
Some secondary 1.2 (0.5–2.5) 0.9 (0.6–1.3) 1.5 (0.7–3.3) 1.0 (0.5–2.4)
Secondary finished 0.9 (0.5–1.7) 1.0 (0.7–1.4) 1.5 (0.8–2.9) 0.8 (0.4–1.6)
Some college 0.6 (0.3–1.0) 0.8 (0.6–1.2) 1.1 (0.5–2.1) 0.5 (0.2–1.3)
College finished 1.0 1.0 1.0 1.0
Education level differenced χ23= 12.2,P= 0.058 χ23= 2.6,P= 0.856 χ23= 3.5,P= 0.739 χ23= 8.9,P= 0.181
Household income
Low 0.9 (0.5–1.6) 0.9 (0.6–1.2) 1.2 (0.6–2.3) 1.2 (0.6–2.6)
Low-average 1.2 (0.6–2.1) 0.9 (0.7–1.3) 2.0* (1.0–4.1) 0.9 (0.4–2.1)
High-average 0.9 (0.5–1.5) 0.9 (0.7–1.2) 1.8 (0.9–3.6) 0.7 (0.4–1.4)
High 1.0 1.0 1.0 1.0
Household income differenced
χ23= 1.4,P= 0.709 χ23= 1.0,P= 0.800 χ23= 5.9,P= 0.117 χ23= 2.4,P= 0.498
Ne 36,498 1,426,232 564 349
*Significant at the 0.05 level, two-sided test
aThese estimates are based on logistic regression models adjusted for age, gender, and low/lower-middle income countries
bThese estimates are based on survival models adjusted for age-cohorts, gender, person-years, and low/lower-middle income countries c
These estimates are based on logistic regression models adjusted for time since SAD onset, age of SAD onset, gender, and low/lower-middle income countries
dChi-square test exploring significant differences between blocks of socio-demographic variables
eDenominatorN: 36,498 = total sample; 1,426,232 = number of person-years in the survival model; 564 = number of lifetime cases of SAD; 349 = number of
12-month cases of SAD
Appendix 3
Table 10Bivariate associations between socio-demographics correlates and DSM-IV SAD (upper-middle income countries)
Correlates 30-day SADa Lifetime risk of
SADb 12-month SAD among lifetimecasesc 30-day SAD among 12-monthcasesc
OR (95% CI) OR (95% CI) OR (95% CI) OR (95% CI)
Age-cohort
18–29 2.0* (1.2–3.1) 3.9* (2.7–5.5)
30–44 2.1* (1.3–3.3) 2.9* (2.1–4.0)
45–59 1.9* (1.2–3.1) 2.1* (1.5–3.1)
60+ 1.0 1.0
Age-cohort differenced χ23= 9.8*,P= 0.021 χ23= 70.3*,P< 0.001
Age of onset
Early 1.0 (0.6–2.0) 0.5* (0.3–1.0)
Early-average 0.8 (0.5–1.4) 0.6 (0.3–1.1)
Late-average 0.9 (0.5–1.5) 1.0 (0.6–1.7)
Late 1.0 1.0
Age of onset differenced χ23= 1.0,P= 0.810 χ23= 6.4,P= 0.092
Time since onset (continuous) 0.99 (0.98–1.01) 1.02* (1.00–1.03)
χ21= 1.0,P= 0.309 χ21= 5.8*,P= 0.016
Gender
Female 2.0* (1.6–2.6) 1.5* (1.3–1.8) 1.6* (1.1–2.4) 1.6* (1.0–2.3)
Male 1.0 1.0 1.0 1.0
Gender differenced χ21= 29.5*,P< 0.001 χ21= 19.6*,P< 0.001 χ21= 4.7*,P= 0.030 χ21= 4.5*,P= 0.034
Employment status
Student 1.8 (1.0–3.3) 1.4 (0.9–2.1) 0.6 (0.3–1.5) – –
Homemaker 1.3 (1.0–1.8) 1.1 (0.8–1.3) 1.4 (0.8–2.3) 1.8* (1.1–3.1)
Retired 0.4* (0.2–0.9) 0.7 (0.5–1.0) 1.0 (0.4–2.7) 0.4 (0.1–1.3)
Other 1.4 (1.0–2.0) 1.3 (1.0–1.6) 1.0 (0.6–1.8) 1.2 (0.7–2.1)
Employed 1.0 1.0 1.0 1.0
Employment status differenced χ24= 15.8*,P= 0.003 χ24= 7.8,P= 0.101 χ24= 3.9,P= 0.414 χ24= 18.7*,P= 0.001
Marital status
Never married 1.0 (0.7–1.3) 1.3* (1.0–1.7) 1.0 (0.6–1.6) 0.8 (0.5–1.2)
Divorced/separated/widowed 1.1 (0.8–1.6) 1.3* (1.0–1.7) 1.0 (0.6–1.7) 0.8 (0.4–1.4)
Currently married 1.0 1.0 1.0 1.0
Marital status differenced χ22= 0.4,P= 0.815 χ22= 8.4*,P= 0.015 χ22= 0.0,P= 0.996 χ22= 1.5,P= 0.484
Education level
No education 1.4 (0.7–2.9) 0.7 (0.4–1.2) – – 2.1 (0.6–7.4)
Some primary 1.7* (1.1–2.8) 0.9 (0.7–1.3) 3.8* (2.0–7.3) 2.2 (0.9–5.3)
Primary finished 1.6 (1.0–2.6) 1.1 (0.8–1.6) 2.4* (1.1–5.1) 1.3 (0.5–3.3)
Some secondary 1.4 (0.9–2.2) 1.2 (0.9–1.6) 1.3 (0.7–2.6) 1.2 (0.6–2.4)
Secondary finished 1.0 (0.6–1.6) 0.9 (0.7–1.2) 1.1 (0.6–2.0) 1.4 (0.7–2.7)
Some college 1.0 (0.6–1.7) 1.1 (0.8–1.5) 1.5 (0.6–3.8) 0.7 (0.3–1.6)
College finished 1.0 1.0 1.0 1.0
Appendix 4
Table 10Bivariate associations between socio-demographics correlates and DSM-IV SAD (upper-middle income countries)
(Continued)
Household income
Low 1.2 (0.8–1.7) 1.0 (0.8–1.2) 0.9 (0.5–1.6) 1.6 (0.8–3.1)
Low-average 1.2 (0.8–1.8) 1.0 (0.8–1.3) 1.2 (0.7–2.0) 1.6 (0.9–2.8)
High-average 1.2 (0.9–1.6) 0.8 (0.7–1.1) 1.3 (0.7–2.3) 2.0* (1.2–3.5)
High 1.0 1.0 1.0 1.0
Household income differenced
χ23= 1.7,P= 0.649 χ23= 3.1,P= 0.384 χ23= 2.0,P= 0.580 χ23= 6.7,P= 0.082
Ne 28,927 1,206,689 834 601
*Significant at the 0.05 level, two-sided test
aThese estimates are based on logistic regression models adjusted for age, gender, and upper-middle income countries
bThese estimates are based on survival models adjusted for age-cohorts, gender, person-years, and upper-middle income countries c
These estimates are based on logistic regression models adjusted for time since SAD onset, age of SAD onset, gender, and upper-middle income countries
dChi-square test exploring significant differences between blocks of socio-demographic variables
eDenominatorN: 28,927 = total sample; 1,206,689 = number of person-years in the survival model; 834 = number of lifetime cases of SAD; 601 = number of
12-month cases of SAD
A dash was inserted for low cell counts (<5 cases)
Table 11Bivariate associations between socio-demographics correlates and DSM-IV SAD (high income countries)
Correlates 30-day SADa Lifetime SADb 12-month SAD among lifetime
casesc 30-day SAD among 12-monthcasesc
OR (95% CI) OR (95% CI) OR (95% CI) OR (95% CI)
Age-cohort
18–29 3.3* (2.7–4.2) 3.3* (3.0–3.8)
30–44 2.8* (2.3–3.5) 2.8* (2.5–3.2)
45–59 2.5* (2.0–3.2) 2.3* (2.1–2.7)
60+ 1.0 1.0
Age-cohort differenced χ23= 119.5*,P<
0.001
χ23= 414.6*,P<
0.001
Age of onset
Early 1.5* (1.1–1.9) 1.0 (0.8–1.4)
Early-average 1.5* (1.2–1.9) 0.9 (0.7–1.3)
Late-average 1.2 (0.9–1.4) 0.9 (0.7–1.1)
Late 1.0 1.0
Age of onset differenced
χ23= 13.4*,P= 0.004 χ23= 1.8,P= 0.615
Time since onset (Continuous) 0.98* (0.97–0.98) 1.01 (1.00–1.01)
χ21= 57.0*,P< 0.001 χ21= 2.9,P= 0.087
Gender
Female 1.6* (1.4–1.8) 1.3* (1.2–1.4) 1.3* (1.1–1.5) 1.2 (1.0–1.4)
Male 1.0 1.0 1.0 1.0
Gender differenced
χ21= 38.8*,P< 0.001 χ21= 44.7*,P< 0.001 χ21= 8.5*,P= 0.004 χ21= 2.8,P= 0.097
Employment status
Student 1.3 (1.0–1.8) 1.1 (0.9–1.4) 1.2 (0.8–1.8) 1.5 (1.0–2.3)
Homemaker 1.4* (1.2–1.8) 1.2* (1.1–1.4) 1.3* (1.0–1.7) 1.3 (0.9–1.8)
Retired 0.7* (0.5–1.0) 0.8* (0.7–1.0) 1.1 (0.8–1.5) 1.1 (0.7–1.6)
Other 2.2* (1.8–2.7) 1.6* (1.5–1.9) 2.3* (1.7–3.1) 1.0 (0.7–1.4)
Acknowledgements
The WHO World Mental Health Survey Collaborators are Sergio Aguilar-Gaxiola, M.D., Ph.D., Ali Al-Hamzawi, M.D., Mohammed Salih Al-Kaisy, M.D., Jordi Alonso, M.D., Ph.D., Laura Helena Andrade, M.D., Ph.D., Corina Benjet, Ph.D., Guilherme Borges, Sc.D., Evelyn J. Bromet, Ph.D., Ronny Bruffaerts, Ph.D., Brendan Bunting, Ph.D., Jose Miguel Caldas de Almeida, M.D., Ph.D., Graca Cardoso, M.D., Ph.D., Alfredo H. Cia, M.D., Somnath Chatterji, M.D., Louisa Degenhardt, Ph.D., Giovanni de Girolamo, M.D., Peter de Jonge, Ph.D., Koen Demyttenaere, M.D., Ph.D., John Fayyad, M.D., Silvia Florescu, M.D., Ph.D., Oye Gureje, Ph.D., D.Sc., FRC.Psych., Josep Maria Haro, M.D., Ph.D., Yanling He, M.D., Hristo Hinkov, M.D., Chi-yi Hu, Ph.D., M.D., Yueqin Huang, M.D., M.PH., Ph.D., Aimee Nasser Karam, Ph.D., Elie G. Karam, M.D., Norito Kawakami, M.D., D.MSc, Ronald C. Kessler, Ph.D., Andrzej Kiejna, M.D., Ph.D., Viviane Kovess-Masfety, M.D., Ph.D., Sing Lee, M.B., B.S., Jean-Pierre Lepine, M.D., Daphna Levinson, Ph.D., John McGrath, Ph.D., Maria Elena Medina-Mora, Ph.D., Jacek Moskalewicz, Dr.PH., Fernando Navarro-Mateu, M.D., Ph.D., Beth-Ellen Pennell, M.A., Marina Piazza, M.PH., Sc.D., Jose Posada-Villa, M.D., Kate M. Scott, Ph.D., Tim Slade, Ph.D., Juan Carlos Stagnaro, M.D., Ph.D., Dan J. Stein, FRC.PC., Ph.D., Nezar Taib, M.S., Margreet ten Have, Ph.D., Yolanda Torres, M.PH., Maria Carmen Viana, M.D., Ph.D., Harvey Whiteford, Ph.D., David R. Williams, M.P.H., Ph.D., Bogdan Wojtyniak, Sc.D.
Funding
This work was carried out in conjunction with the World Health Organization World Mental Health (WMH) Survey Initiative which is supported by the National Institute of Mental Health (NIMH; R01 MH070884), the John D. and Catherine T. MacArthur Foundation, the Pfizer Foundation, the US Public Health Service
(R13-MH066849, R01-MH069864, and R01 DA016558), the Fogarty International Center (FIRCA R03-TW006481), the Pan American Health Organization, Eli Lilly and Company, Ortho-McNeil Pharmaceutical, GlaxoSmithKline, and Bristol-Myers Squibb. We thank the staff of the WMH Data Collection and Data Analysis Coordination Centers for assistance with instrumentation, fieldwork, and consultation on data analysis. None of the funders had any role in the design, analysis, interpretation of results, or preparation of this paper. The views and opinions expressed in this report are those of the authors and should not be construed to represent the views or policies of the World Health Organization, or other sponsoring organizations, agencies, or governments. A complete list of all within-country and cross-national WMH publications can be found at http:// www.hcp.med.harvard.edu/wmh/.
The 2007 Australian National Survey of Mental Health and Wellbeing is funded by the Australian Government Department of Health and Ageing. The São Paulo Megacity Mental Health Survey is supported by the State of São Paulo Research Foundation (FAPESP) Thematic Project Grant 03/00204-3. The Bulgarian Epidemiological Study of common mental disorders EPIBUL is supported by the Ministry of Health and the National Center for Public Health Protection. The Chinese World Mental Health Survey Initiative is supported by the Pfizer Foundation. The Shenzhen Mental Health Survey is supported by the Shenzhen Bureau of Health and the Shenzhen Bureau of Science, Technology, and Information. The Colombian National Study of Mental Health (NSMH) is supported by the Ministry of Social Protection. The Mental Health Study Medellin-Colombia was carried out and supported jointly by the Center for Excellence on Research in Mental Health (CES
Table 11Bivariate associations between socio-demographics correlates and DSM-IV SAD (high income countries)(Continued)
Employment status differenced
χ24= 81.7*,P< 0.001 χ24= 84.1*,P< 0.001 χ24= 34.4*,P< 0.001 χ24= 5.3,P= 0.258
Marital status
Never married 1.3* (1.1–1.6) 1.4* (1.3–1.6) 1.5* (1.2–1.8) 1.0 (0.8–1.3)
Divorced/separated/widowed 1.6* (1.3–2.0) 1.3* (1.2–1.5) 1.5* (1.2–1.8) 1.1 (0.9–1.4)
Currently married 1.0 1.0 1.0 1.0
Marital status differenced χ22= 30.0*,P< 0.001 χ22= 63.3*,P< 0.001 χ22= 26.0*,P< 0.001 χ22= 0.7,P= 0.709
Education level
No education – – – – – – – –
Some primary 1.9* (1.1–3.1) 1.2 (1.0–1.6) 2.9* (1.7–5.0) 1.5 (0.7–3.1)
Primary finished 1.3 (0.8–1.9) 1.2 (1.0–1.5) 1.7* (1.0–2.9) 0.9 (0.5–1.5)
Some secondary 1.4* (1.1–1.8) 1.2* (1.1–1.4) 1.7* (1.3–2.1) 1.0 (0.7–1.4)
Secondary finished 1.0 (0.8–1.2) 1.1 (1.0–1.2) 1.3* (1.1–1.6) 0.8 (0.6–1.0)
Some college 1.1 (0.9–1.4) 1.2* (1.0–1.3) 1.3* (1.0–1.7) 0.8 (0.6–1.1)
College finished 1.0 1.0 1.0 1.0
Education level differenced
χ23= 17.2*,P= 0.009 χ23= 15.6*,P= 0.016 χ23= 29.4*,P< 0.001 χ23= 7.6,P= 0.268
Household income
Low 1.6* (1.3–2.0) 1.2* (1.1–1.4) 1.8* (1.4–2.2) 1.3 (1.0–1.8)
Low-average 1.3* (1.0–1.6) 1.0 (0.9–1.2) 1.4* (1.1–1.7) 1.3 (1.0–1.8)
High-average 1.1 (0.9–1.4) 1.1 (1.0–1.2) 1.1 (0.9–1.4) 1.0 (0.8–1.4)
High 1.0 1.0 1.0 1.0
Household income differenced
χ23= 25.1*,P< 0.001 χ23= 15.9*,P= 0.001 χ23= 32.7*,P< 0.001 χ23= 5.7,P= 0.126
Ne 76,980 3,448,640 4360 2510
*Significant at the 0.05 level, two-sided test
a
These estimates are based on logistic regression models adjusted for age, gender, and high income countries
bThese estimates are based on survival models adjusted for age-cohorts, gender, person-years, and high income countries
cThese estimates are based on logistic regression models adjusted for time since SAD onset, age of SAD onset, gender, and high income countries dChi-square test exploring significant differences between blocks of socio-demographic variables
e
DenominatorN: 76,980 = total sample; 3,448,640 = number of person-years in the survival model; 4360 = number of lifetime cases of SAD; 2510 = number of 12-month cases of SAD