D
D
development
of
an
indicator
of
propensity
to
energy
commercial
losses
using
geospatial
statistical
techniques
and
socio
-
economic
data
:
the
case
of
aes
eletropaulo
Desenvolvimento De inDicaDor De propensão à perDa comercial De energia utilizanDo técnicas De estatística espacial e DaDos socioeconômicos: o caso Da aes eletropaulo
EDUARDO DE REZENDE FRANCISCO
Doutorando em Administração de Empresas pela Escola de Administração de Empresas de São Paulo, Fundação Getulio Vargas (FGV). Especialista de Negócios do Departamento de Gerência de Estratégias de Marketing da Eletropaulo Metropolitana Eletricidade de São Paulo S.A. Rua Tabatinguera, 164, 6º andar, Sé – São Paulo – SP – Brasil – CEP 01020-901
E-mail: [email protected]
EDUARDO BORTOTTI FAGUNDES
MBA em Gestão Empresarial pela Escola de Administração de Empresas de São Paulo, Fundação Getulio Vargas (FGV). Analista de Perdas do Departamento de Projeto de Pesquisas da Eletropaulo Metropolitana Eletricidade de São Paulo S.A. Rua 25 de Janeiro, 320, Luz – São Paulo – SP – Brasil – CEP 01103-000
E-mail: [email protected]
MATEUS CANNIATTI PONCHIO
Doutor em Administração pela Escola de Administração de Empresas de São Paulo da Fundação Getulio Vargas (FGV). Professor do Programa de Pós-Graduação Stricto Sensu da Escola Superior de Propaganda e Marketing (ESPM). Rua Dr. Álvaro Alvim, 123, Vila Mariana – São Paulo – SP – Brasil – CEP 04018-010
E-mail: [email protected]
FELIPE ZAMBALDI
Doutor em Administração pela Escola de Administração de Empresas de São Paulo da Fundação Getulio Vargas (FGV). Professor da Escola de Administração de Empresas de São Paulo da Fundação Getulio Vargas. Rua Tamandaré, 688, Liberdade – São Paulo – SP – Brasil – CEP 01525-000
179
A B S T R A C T
Given the growing importance of integrating marketing and operations indi-cators to enhance business performance, and the availability of sophisticated geospatial statistical techniques, this paper draws on these concepts to develop an indicator of propensity to energy commercial losses. Loss management is a strategic topic among energy distribution companies, in particular for AES Eletropaulo. In such context, this work’s objectives are: (i) to appropriate spatial auto-regressive models and geographically weighted regression (GWR) in mea-suring the cultural influence of neighborhood in customer behavior in the ener-gy fraud act; (ii) to replace slum coverage areas by a regional social vulnerability index; and (iii) to associate energy loss with customer satisfaction indicators, in a spatial-temporal approach. Spatial regression techniques are revised, followed by a discussion on social vulnerability and customer satisfaction indicators. Ope-rational data obtained from AES Eletropaulo’s geographical information systems were combined with secondary data in order to generate predictive regression models, having energy loss as the response variable. Results show that the incor-poration of market and social oriented data about customers substantially contri-bute to explicate energy loss – the coefficient of determination in the regression models rose from 17.76% to 63.29% when the simpler model was compared to the more complex one. Suggestions are made for future work and opportunities for the replication of the methodology in comparable contexts are discussed.
K E Y W O R D S
Operations indicators; Energy distribution; Loss management; Geographically weighted regression; Social vulnerability.
R E S U M O
sofisti-180
cadas técnicas de estatística espacial, este trabalho desenvolve um indicador de propensão a perdas comerciais de energia. Gestão de perdas é um tema estraté-gico para as empresas de distribuição de energia, em particular para a AES Ele-tropaulo. Nesse contexto, os objetivos deste trabalho são: (i) apropriar modelos espaciais autorregressivos e a geographically weighted regression (GWR – regressão ponderada geograficamente) para medir a influência cultural da vizinhança no comportamento do cliente no ato da fraude de energia; (ii) substituir as áreas de cobertura de favela por um índice regional de vulnerabilidade social; e (iii) asso-ciar a perda de energia com indicadores de satisfação de clientes, em uma abor-dagem espaço-temporal. Técnicas de regressão espacial são revisadas, seguidas por uma discussão sobre a vulnerabilidade social e os indicadores de satisfação do cliente. Os dados operacionais obtidos por meio de sistemas de informação geográfica da AES Eletropaulo foram combinados com dados secundários, a fim de gerar modelos preditivos de regressão, com a perda de energia como variá-vel resposta. Os resultados mostram que a incorporação de dados sociais e de mercado sobre os clientes contribuem substancialmente para explicar a perda de energia – o coeficiente de determinação dos modelos de regressão aumentou de 17,76% para 63,29%, quando comparados o modelo mais simples e o mais complexo. São apresentadas sugestões para trabalhos futuros e discutidas opor-tunidades para a replicação da metodologia em contextos comparáveis.
PA L AV R A S - C H AV E
Indicadores de operações; Distribuição de energia; Gestão de perdas; G eographi-cally weighted regression; Vulnerabilidade social.
1
I N T R O D U C T I O N
Every year, AES Eletropaulo, one of the most important Brazilian electrici-ty distribution companies, fails to bill 2,388 GWh derived from non-technical losses, an amount of energy that is greater than the residential consumption of a city with a population of over 2.3 million people. According to the Brazilian Governmental Energy Agency (Agência Nacional de Energia Elétrica – Aneel), the annual commercial energy loss in the Brazilian energy distribution sector was about R$ 5 billion in 2007, approximately 13.6% of all energy produced in Brazil during that period (ANEEL, 2009).
ano-181
malies, failures in internal billing processes, irregular connections, or cut-off clients directly connected to the grid. Loss management requires a joint effort for its control and for the definition of strategies that are effective to mitigate their impact on the financial results of the company.
Sophisticated statistical methods have been proposed in the operations management field of study as an alternative to traditional ones. In another con-text, for instance, Brito, Pignanelli and Csillag (2008) showed the benefits of multilevel modeling when compared to traditional statistical methods to inves-tigate the relationship between quality management and financial performance. In this paper, spatial modeling and geostatistical analysis are seen as key ele-ments in planning the development, management and operation of energy los-ses prevention. The effectiveness, economy and reliability depend on the correct choice of dimensions (categories of variables) used in its manipulation.
Previous studies (FRANCISCO, 2006; FRANCISCO; FAGUNDES, 2006a, 2006b; FRANCISCO et al., 2007a, 2007b) state that the consumption of electric energy is a very good proxy of household income in certain conditions; such results benefited from geospatial statistical techniques. In this paper, similar techniques will be explored to measure energy losses, understood as the differen-ce between bought (income) and sold (outcome – sum of consumption) energy. This information exists for each Transforming Distribution Station (ETD) and its coverage area.
It is expected that the use of sophisticated techniques to support tactical and operational management will contribute for a better financial return through actions oriented towards loss reduction. Geographical analysis tools bring about this contribution, throughout diverse information levels of manipulation. The geostatistical techniques contribute with evaluation and quantification of geogra-phical influence of this phenomenon.
This paper is organized as follows: in the next section, the objectives are presented, followed by a brief presentation of the main concepts dealt with; the methodology is then described. Subsequently, the results are depicted and, in the last section, concluding remarks are offered.
2
O B J E C T I V E S
182
source for demographic and behavioral clusters (decision tree analyses) for com-mercial losses, strategic support for metering maintenance and replacement process.
The CLPI, however, does not take into account customer satisfaction indica-tors or social vulnerability data. Customer satisfaction indicaindica-tors have a funda-mental importance for AES Eletropaulo’s strategy to achieve the position of best Brazilian energy distribution company. For instance, a set of customer satisfac-tion indicators computed by Associasatisfac-tion of Brazilian Power Distribusatisfac-tion Com-panies (Associação Brasileira de Distribuidores de Energia Elétrica – Abradee, 2009) account for one quarter of the global evaluation of Brazilian electric ener-gy distribution companies that are elected to receive a performance award (the Abradee’s Prize). Social responsibility governance, on the other hand, gained strategic importance for energy companies in the last three years. The knowled-ge about the “bottom of pyramid” customers is a subsidy for actions related to income generation, citizenship, illegal connections and efficient use of energy.
It has been suggested that manufacturing and marketing integration and managerial priorities influence positively business performance (PAIVA, 2008). In this context, the objectives of this paper are to improve the CLPI in three perspectives:
a) appropriation of geostatistical techniques (spatial auto-regressive models and geographically weighted regression) in order to measure the cultural influen-ce of neighborhood in customer behavior in the energy fraud act;
b) replacement of slum coverage areas by a regional social vulnerability index (IPVS); and
c) association of this indicator, in its formative conception, with the Customer Satisfaction survey indicators, published by Abradee, in a spatial-temporal approach.
3
C O N C E P T S R E V I E W
In this section, spatial regression techniques are revised, followed by a dis-cussion on social vulnerability and customer satisfaction indicators.
3 . 1
S PAT I A L R E G R E S S I O N T E C H N I Q U E S183
social sciences, and the subsequent improvements that spatial statistics allow in the interpretation, measurement of relationships, and prediction. As pointed out by Bradlow et al. (2005), by generalizing the notion of a map to include demo-graphic and psychometric representations, spatial models can capture a variety of effects (spatial lags, spatial autocorrelation, and spatial drift) that affect firm or consumer decision behavior.
In a traditional linear regression, we assume that the relationship modeled holds everywhere in the study area, that is, the regression parameters are consi-dered “whole-map” statistics. In many situations, this is not correct, as mapping residuals may reveal. An alternative to incorporate spatial effects in econometric models, according to Griffith (1987), is to specify an auto-regressive model with the dependent’s variable autocorrelation as a statistic parameter; the rational is to include a spatial lag in the regression as an independent variable calculated by means of a matrix containing the distances among the different regions as coefficients of contiguity (ANSELIN, 1988). That option is the basis for what is known as spatial auto regression (SAR) techniques.
Alternatively, and motivated by computational development, geographically weighted regression (GWR), a term introduced by Fotheringham, Brunsdon, and Charlton (2002) to describe a family of regression models in which the coefficients β are allowed to vary spatially, also takes advantage of data from locations near the focal location as they are informative about the relationship between the independent and dependent variables in the focal location. When calculating the estimates for a focal location, GWR gives more weight to data from locations that are closer to it than to those that are distant (MITTAL; KAMAKURA; GOVIND, 2004). What makes GWR different from SAR techni-ques, however, is the fact that GWR permits parameter estimates to vary locally; regression coefficients are determined by examining the set of points within a well-defined neighborhood of each point, using a weighting scheme (normally, bi-square or Gaussian).
A bandwidth that defines the neighborhood is the key factor; it may be defined manually or alternatively by some form of adaptive method such as the minimization of the Akaike Information Criterion (AIC) (FOTHERINGHAM; BRUNSDON; CHARLTON, 2002; SMITH; GOODCHILD; LONGLEY, 2007).
3 . 2
S O C I A L V U L N E R A B I L I T Y184
translated by the authors). This definition is coherent with others, such as that of Kaztman (1999) and of State Data Analysis System Foundation (Sistema Esta-dual de Análise de Dados – Seade, 2004).
In a study to characterize the social vulnerability situation in different regions in the State of São Paulo, in addition to the socio-economic variables of income and educational level that are classically used in similar works, Seade (2004) used variables that indicate the family life cycle (such as the presence of small children, adolescents, female family heads or young family heads in hou-seholds) and housing conditions (households with urban services such as being connected to the water and sewage networks and trash collection). This study (Seade, 2004) gave rise to the Paulista Index of Social Vulnerability – IPVS, pre-sented in the following section.
3 . 2 . 1
Th e Pa u l i s t a I n d e x o f S o c i a l Vu l n e r a b i l i t y – I P V SThe objective of Seade’s (2004) study was to allocate social vulnerability marks to each of the sectors in the census that comprise the State of São Paulo.
Starting with the database taken from the Demographic Census (Instituto Brasileiro de Geografia – IBGE, 2000) of people living in the State of São Paulo, they used factor analysis procedures with the aim of exploring the underlying structures in the universe of variables studied. The analyses revealed two factors, called socio-economic and family life cycle (Seade, 2004):
a) Factor 1 – Socio-economic – related to the income and the level of education of the person responsible for the household. Low values in this factor are indicative of low income and / or little education;
b) Factor 2 – Family Life Cycle – expresses the family life cycle – age of those responsible for the household, number of children and others aspects. Low values in this factor are indicative of young families.
185 exhibit 1
groups forming the paulista inDex of social vulnerability – ipvs FACTOR 1 – FACTOR 2 – FAMILY LIFE CYCLE
SOCIO-ECONOMIC YOUNG FAMILIES ADULT FAMILIES AGED FAMILIES
Low High vulnerability (group 5) Very high vulnerability
(group 6)
Medium
Very low vulnerability (group 2)
Low vulnerability (group 3)
Medium vulnerability (group 4)
High
Very high No vulnerability (group 1)
Source: Adapted from Seade (2004, p. 27).
The granular unit of Seade’s study was the sector that had taken part in the census. Specifically for the city of São Paulo, the resulting social vulnerability map was as follows.
figure 1
map of the social vulnerability in the city of são paulo
186
This result is extremely rich in information, both for public policy purposes as well as for marketing purposes. In this work, information regarding social vul-nerability among AES Eletropaulo’s customers will be utilized in order to enhan-ce the accuracy of an energy loss estimator.
3 . 3
A B R A D E E ’ S C U S TO M E R S AT I S FAC T I O N S U R V E YAbradee coordinates the Abradee’s Survey of Residential Customer Satisfac-tion every year since 1999, applied simultaneously for many distribuSatisfac-tion com-panies (40 in 2004, 43 in 2005, 48 in 2006, 44 in 2007, 40 in 2008) (Abradee, 2005, 2007, 2008). Its main objective is to evaluate customer satisfaction by measuring service quality perceived attributes. It also allows the ranking of com-panies per category.
It is a household survey, based on a stratified probabilistic sample (per municipality, district and census sector), which guarantees the representative-ness of the distribution companies population. In addition, interviews are made for selected households, with the target person being the head of family (Abra-dee, 2003).
Forty-three attributes of perceived quality and price are collected, grouped in eight areas (Idars): energy supply; information and communication; energy bill; customer care; image; price; public lighting; and social responsibility. The average of the five first quality areas, weighted by customer declared importance of each area, originates the ISQP (Perceived Quality Satisfaction Indicator), the main index of that survey. In addition, two general satisfaction indexes (IAC and ISG), and some demographic aspects are collected: household income, head of family’s age and educational level, monthly billed electricity consumption of the household and some others (Abradee, 2008).
After the survey period, a database with all variables for all respondents is published by Abradee for each distribution company. The most detailed location information of the household collected in the interview is the district where the household is located (addresses, postal codes or census sectors were not sup-plied) (FRANCISCO; WHIGHAM; MOORE, 2007). It allows the generation of indexes by district and municipality, besides regional indicators commonly published, as illustrated by Figure 2.
187 figure 2
isQp per mistrict anD municipality using 2008 abraDee’s survey
Source: Prepared by the authors.
4
M E T H O D O L O G Y
Understanding the spatial distribution of data derived from phenomena occurring over a certain geographical area constitutes a challenge for the clari-fication of core issues in several areas of public and corporate administration, such as health, urban dynamics, environment, marketing and asset manage-ment. Such studies have become increasingly more common, due to the availa-bility of Geographical Information Systems (GIS), and also due to the need for clarification of the spatial distribution of common problems and socio-economi-cal interaction variables that the traditional and classisocio-economi-cal models usually do not address. Geostatistics is a field of regional science that approaches the theme of dependence and spatial heterogeneity, critical aspects in any study on regional economy. These characteristics can invalidate the use of conventional econome-tric techniques. Spatial quantitative methods are a special case of overall sta-tistical focus and, therefore, require a set of different methods and techniques than those utilized in conventional statistics. Companies that have geographical information as essential to their business benefit from the application of those techniques.
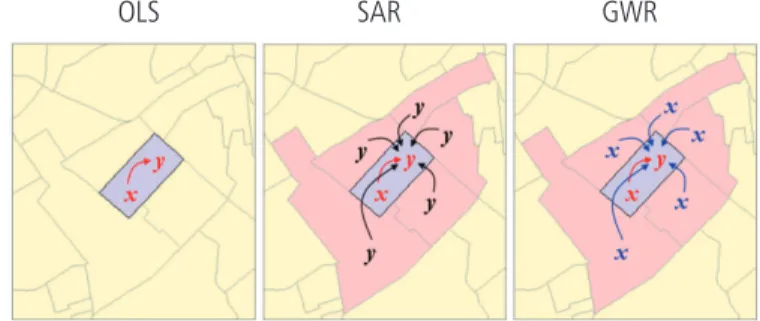
In this section, we present the SAR and GWR techniques which were applied in the study and their characteristics, comparing them to the use of OLS (ordi-nary least square) techniques. Then, we demonstrate the process employed to improve an indicator of electricity commercial losses to be explained by means of the applied regressions.
PERCENTAGE OF SATISFIED CUSTOMERS 12 REGIONS
SATISFACTION AVERAGE 98 AREAS (DISTRICTS OR MUNICIPALITIES)
0 – 5% 1 – 1.5
188
4 . 1
R E G R E S S I O N T E C H N I Q U E S A P P L I E D I N T H I S S T U DYTwo geostatistics techniques used were: spatial auto-regression (SAR) and geographically weighted regression (GWR). They are exploratory techniques for spatial data analysis.
The SAR technique remount to the 1950s and is traditionally used in spatial statistics (SMITH; GOODCHILD; LONGLEY, 2007). Spatial auto-regressive (SAR) models usually adopt neighborhood matrices (W) with distance weights (and the same dependent term y to estimate y, in an auto-regressive rWy term), which are internally based on the distance between the points or the centroids of the polygons involved in the predicting model. Equations 1 (multivariate linear regression, or ordinary least square regression) and 2 (SAR) show how the auto-regressive term is incorporated.
OLS: y = βΧ + ε (1) SAR: y = rWy + βΧ + ε (2)
where y is the dependent variable; Χ is the vector of independent variables; β is the vector of coefficients and ε is the estimation error (allegedly normal).
Geographically weighted regression (GWR) was introduced by Fotherin-gham, Brunsdon and Charlton (2002) to describe a family of regression models in which the coefficients, β, are allowed to vary spatially.
In a traditional linear regression we assume that the relationship we are modeling holds everywhere in the study area – that is, the regression parameters are "whole-map" statistics (it is also valid for SAR). In many situations this is not necessarily the case, as mapping the residuals (the difference between the observed and predicted data) may reveal. Many different solutions have been proposed for dealing with spatial variation in the relationship. GWR provides an easily grasped means of modeling such relationships, with local variations of β coefficients, as shown in Equation 3.
GWR: y(g) = β(g)Χ + ε (3)
189
The coefficients β(g) are determined by examining the set of points within a well-defined neighborhood of each of the sample points, using a weighting scheme (normally, bi-square or Gaussian). The bandwidth that defines the neighborhood is the key factor; it may be defined manually or alternatively by some form of adaptive method such as the minimization of the Akaike Information Criterion (AIC) (FOTHERINGHAM; BRUNSDON; CHARLTON, 2002; FRANCISCO; WHIGHAM; MOORE, 2007; SMITH; GOODCHILD; LONGLEY, 2007).
Figure 3 shows the differences between the three techniques of regressions applied respectively to the equations (1), (2) and (3).
figure 3
Differences between orDinary linear regression (ols), spatial auto-regression (sar) anD geographically
weighteD regression (gwr)
OLS SAR GWR
Source: Prepared by the authors.
4 . 2
I M P R OV E M E N T O F C O M M E R C I A L L O S S E S P OT E N T I A L I N D I C ATO R190
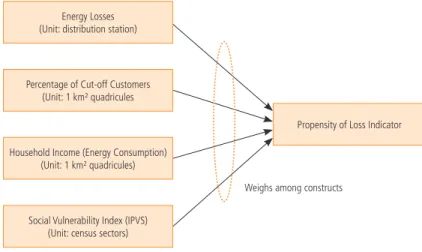
figure 4
formative explanatory variables (constructs) of the commercial losses potential inDicator
Source: Prepared by the authors.
Figure 5 brings a summary of the steps of the creation of this indicator.
figure 5
builDing steps of the commercial losses potential inDicator
Source: Prepared by the authors.
Propensity of Loss Indicator
Weighs among constructs
Social Vulnerability Index (IPVS) (Unit: census sectors) Percentage of Cut-off Customers
(Unit: 1 km² quadricules
Household Income (Energy Consumption) (Unit: 1 km² quadricules)
Energy Losses (Unit: distribution station)
Primary grid Coverage of each distribution station
Losses (%) per distribution station
Percentage of cut-off customers
Average of household income (electricity consumption)
IPVS (Paulista Social Vulnerability Index)
191
The methodology consisted, basically, of the following steps:
a) mapping of the primary grid of all AES Eletropaulo circuits and association of each grid segment to the Transforming Distribution Station (ETD) that feeds it; b) establishment of the coverage area of each ETD, through the geostatistical
technique of Thiessen polygons, from the proximity of each geographical site to the grid segments;
c) mapping of the geographic density of cut-off customers (using a mesh of one square kilometer);
d) mapping of the concentration of electricity residential consumption, as proxy of household income and association to the same area units of the density of cut-off clients (using a mesh of one square kilometer);
e) mapping of Brazilian census sectors using the IPVS;
f) spatial overlay (spatial junction) between geographical layers obtained in steps (b), (c), (d) and (e);
g) weighting among the four information dimensions associated to each area unit, for the generation of the Commercial Loss Potential Indicator.
4 . 3
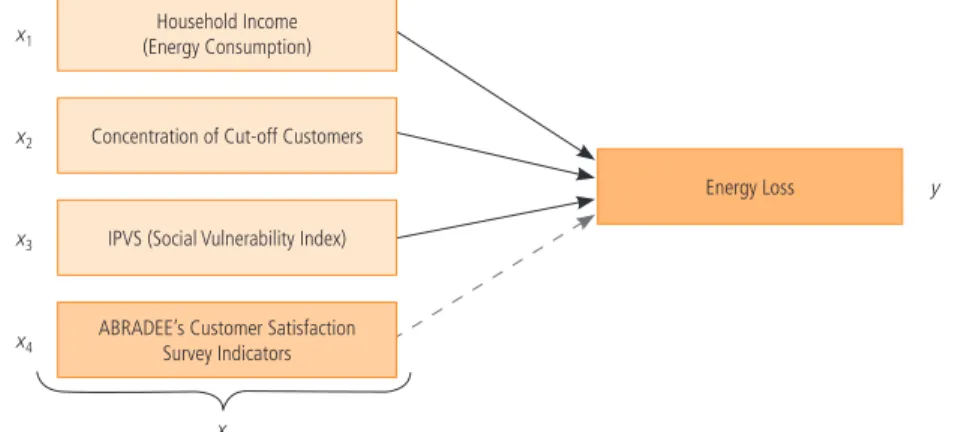
P R E D I C T I V E M O D E L S O F E N E R G Y L O S S E SFigure 6 describes the independent variables (X) used in the explanation of Energy Loss (y) variability. The improvement of the original model, crea-ted in 2006 (FRANCISCO; FAGUNDES, 2006b; FRANCISCO; WHIGHAM; MOORE, 2007), is in the substitution of slum coverage areas by IPVS and also in the incorporation of perceived quality indicators (attributes and general indexes) obtained from the ABRADEE’s Customer Satisfaction Survey.
figure 6
preDictive moDels of energy losses
Source: Prepared by the authors.
Energy Loss
x1
ABRADEE’s Customer Satisfaction Survey Indicators Concentration of Cut-off Customers
IPVS (Social Vulnerability Index) Household Income (Energy Consumption)
x2
x3
x4
y
192
The traditional and spatial regression techniques were applied in an explora-tory manner for the whole AES Eletropaulo coverage area and for the city of São Paulo, according to availability of information of explanatory variables.
5
R E S U LT S
The use of ABRADEE’s Survey indicators was initiated with the investiga-tion of direct associainvestiga-tion (simple and spatial) between customer satisfacinvestiga-tion and energy loss. In such a context, we decompose (weighted per area) energy losses values for each sampled municipality and district.
Table 1 shows results for diverse tested models. Association is relatively high considering GWR technique, highlighting ISQP and information and communi-cation quality area (Idar).
table 1
comparison between explanatory moDels of customer satisfaction from energy loss DEPENDENT VARIABLE k OLS MODEL R2 GWR MODEL R2
ISQP 18 3.63% 44.18%
ISG 18 2.18% 33.88%
Idar Info & Comm 18 0.32% 50.43%
“Fraud Combat” Attribute 18 0.36% 26.48%
notes: n = 98 districts or municipalities sampled; k = 18 is the number of neighbors considered for each local sample in GWR technique (suggested value by AIC minimization).
Source: Prepared by the authors.
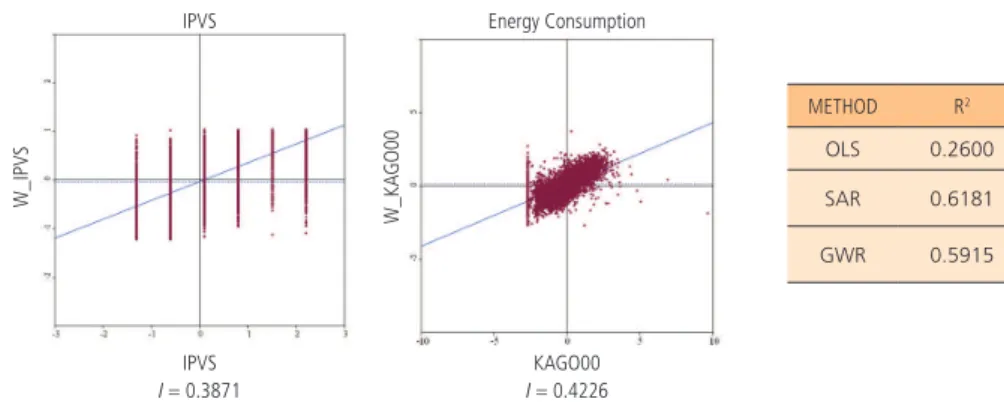
193 figure 7
results of spatial exploration anD regression moDels of ipvs (social vulnerability inDex) from energy
consumption
METHOD R2
OLS 0.2600
SAR 0.6181
GWR 0.5915
Source: Prepared by the authors.
Results highlight an expressive and important improvement of explanation power (R2) of IPVS from electric energy consumption. About 60% of the social
vulnerability in São Paulo municipality can be explained by electricity habits. Moran’s I results (a standard spatial correlation indicator) show a significant auto-correlation between the two constructs that validates the spatial variability model applied and promotes energy consumption as an economic and social indicator.
Figure 8 shows 3D maps of spatial distribution of ISQP (satisfaction avera-ge, in a 1-10 scale) and IPVS in São Paulo municipality.
figure 8
maps (croQuis): 2008 abraDee’s isQp anD ipvs
Source: Prepared by the authors.
ISQP 5,74 – 6,32 6,33 – 7,09 7,10 – 7,46 7,47 – 7,68 7,69 – 7,96 7,97 – 8,23 8,24 – 8,42 8,43 – 8,64 8,65 – 9,00 9,01 – 9,66
None Very Low Low Medium High Very High Spatial Auto-Correlation Indicator (Moran’s I)
IPVS Energy Consumption
IPVS KAGO00
I = 0.3871 I = 0.4226
W_IPVS
W_KA
194
In the main result set of analyses, spatial overlay of four constructs (see Figure 6), and Abradee’s survey indicators, originates a geographic layer with 41,277 polygons. Table 2 compares results from the original project (FRANCISCO; FAGUNDES, 2006a, 2006b; FRANCISCO; WHIGHAM; MOORE, 2007) with findings of this analysis (considering IPVS and customer satisfaction indexes).
table 2
comparison between energy losses explanation moDels (n = 41,277)
INDEPENDENT VARIABLES
COEFFICIENT OF DETERMINATION ( R2 )
OLS SAR GWR
Model 0 (2006): Income (Energy),
%3and4, Slums, ETD Losses 11.13% 32.08%
Model 1: Income (Energy), %3and4,
IPVS, ETD Losses 15.15% 38.82% 57.92%
Model 2: Income (Energy), %3anc4,
IPVS, ETD Losses, ISQP 17.76% 39.71% 63.29%
Source: Prepared by the authors.
The 2006 model (FRANCISCO; FAGUNDES, 2006a, 2006b) had a 32.1% explanation power (R2) considering SAR technique. Improving it with GWR
tech-nique, IPVS and ISQP customer satisfaction indexes, R2 increased to about 60%,
which increases the importance of this indicator and raises the condition for these analyses to a socio-economical and demographic perspective in fact (FRANCIS-CO et al., 2007a). The strong association between IPVS and energy consumption and between energy loss and ISQP (Table 1) corroborate this finding.
6
C O N C L U D I N G R E M A R K S
195
Since the information utilized is internal and under AES Eletropaulo mana-gement, this methodology can be easily implemented and maintained. The innovation is in the integration of technical information, heterogeneous and no-integrated at first, such as total loss per transforming distribution station, and commercial information, such as average billed power consumption and the status (cut-off versus non-cut-off) of each consumer unit. Such integration is enabled by geographic information systems, and the generation of the indicator is made by the determination of geostatistical techniques, still of very limited application, and thus, pioneer in the power distribution industry. Actually, the incorporation of geographic data was proven to improve electricity loss detection, because it allowed for the quantification of contextual local effects, which are relevant to the field of operations management due to the existence of regional interdependence among the studied phenomenon.
Results show this innovation is primordial for establishing better perfor-mance in energy loss reduction and for supporting social responsibility and cul-tural programs. AES Eletropaulo diminished its commercial loss in 0.8 percen-tage points from 2007 to 2008’s first quarters.
Additionally, the inclusion of socio-demographic indicators by means of a vulnerability index in substitution of the rough information about the local pre-sence of slums was revealed to improve the explanation for electricity losses. In fact, the association found between vulnerability, electricity consumption and energy loss suggest that electricity consumption and fraud are not only econo-mic phenomena, but also socially determined. That may reinforce the need for special policies, both from the public and the private sector, to foster customer’s welfare and reduction of fraud levels by means of regionally driven initiatives.
Coherently, the inclusion of an attitudinal indicator of satisfaction to explain losses also proved to be significant. In such a context, distributors can be moti-vated to face satisfaction not only as means to attract and retain customers, but also do reduce loss. Based on the findings of this study, loss can be considered to have social and market dimensions and processes to prevent it incorporate complementary operational and marketing orientations.
196
As an opportunity, distributors may develop knowhow and data in order to improve their operational tactics for fraud prevention and market penetration, and even offer those skills to other sectors. However, the specificity of data requi-red in this study may imply that this analysis is costly to reproduce. Also, the use of more granular data would result in more precise estimates than the current application with regionally aggregated data. However, with suitable adjustments regarding data availability, there is opportunity to expand this study to costly efficient designs and broader contexts. Hence this work is both novel and new in the energy distribution industry, and should be improved and incorporated in a larger set of optimization processes and in similar service and utility companies.
R E F E R E N C E S
AGÊNCIA NACIONAL DE ENERGIA ELÉTRICA (Aneel). Biblioteca virtual. Disponível em: <http://www.seade.gov.br>. Acesso em: 12 mar. 2009.
ANSELIN, L. Spatial econometrics: methods and models. Dordrecht, The Netherlands: Kluwer Aca-demic Publishers, 1988. 284 p.
ASSOCIAÇÃO BRASILEIRA DOS DISTRIBUIDORES DE ENERGIA ELÉTRICA (Abradee). Pes-quisa ABRADEE da satisfação do cliente residencial 2003 – Relatório comparativo Eletropaulo. Rio de Janeiro, Brazil: 2003.
______. Pesquisa Abradee da satisfação do cliente residencial 2005 – Relatório comparativo Eletropaulo. Rio de Janeiro, Brazil: 2005.
______. Pesquisa Abradee da satisfação do cliente residencial 2007 – Relatório comparativo Eletropaulo. Rio de Janeiro, Brazil: 2007.
______. Pesquisa Abradee da satisfação do cliente residencial 2008 – Relatório comparativo Eletropaulo. Rio de Janeiro, Brazil: 2008.
______. Prêmio Abradee 2009 – Relatório descritivo. Rio de Janeiro, Brazil: 2009.
BRADLOW, E. T. et al. Spatial Models in marketing, Marketing Letters, v. 16, n. 3-4, December, p. 267-78, 2005.
BRITO, L. A. L.; PIGNANELLI, A.; CSILLAG, J. M. Does quality management improve performan-ce? A longitudinal multilevel approach. In: ENCONTRO ANUAL DA ASSOCIAÇÃO NACIONAL DOS PROGRAMAS DE PÓS-GRADUAÇÃO EM ADMINISTRAÇÃO, 32., 2008, Rio de Janeiro.
Anais… Rio de Janeiro: Anpad, 2008. p. 1-16. 1 CD-ROM.
FILGUEIRA, C.; PERI, A. América Latina: los rostros de la pobreza y sus causas determinantes. Santiago de Chile: Naciones Unidas, 2004. (Población y Desarrollo, n. 54/2004).
FOTHERINGHAM, S.; BRUNSDON, C.; CHARLTON, M. Geographically weighted regression: the analysis of spatially varying relationships. Hoboken, New Jersey: Wiley, 2002. 282 p.
197
FRANCISCO, E. de R.; FAGUNDES, E. B. Geostatistical study between social-economical variables and power losses. In: CONGRESS OF OPERATIONAL EXCELLENCE AND INNOVATION OF AES LATIN AMERICA, 1., 2006, São Paulo, Brazil. Anais… São Paulo: AES Latin America e Africa, 2006a.
______. Estudo geoestatístico entre variáveis sócio-econômicas e perdas de energia. In: JORNADA TÉCNICA AES ELETROPAULO E AES SUL, 1, 2006, São Paulo, Brazil. Anais… São Paulo: AES Brasil, 2006b.
FRANCISCO, E. de R.; WHIGHAM, P.; MOORE, A. Point allocation inside polygons and GWR: an experimental analysis with survey data. In: ANNUAL COLLOQUIUM OF THE SPATIAL INFOR-MATION RESEARCH CENTRE (SIRC), 19., 2007, Dunedin, New Zealand. Anais… Dunedin, New Zealand: University of Otago, 2007.
FRANCISCO, E. de R. et al. Fraud and energy losses: a geostatistical analysis. In: NERI CON-FERENCE 2007 – NATIONAL ENERGY RESEARCH INSTITUTE, 1. 2007, Auckland, New Zea-land. Anais… Auckland, New Zealand, 2007a.
______. Electricity consumption as a predictor of household income: a spatial statistics approach. In: DAVIS, C. A.; MONTEIRO, A. M. (Org.). Advances in geoinformatics, Heidelberg: Editora Springer, 2007b. p. 24, 315 p.
GRIFFITH, D. A. Spatial autocorrelation – a primer. Washington: Association of American Geogra-phers, 1987. 87 p.
INSTITUTO BRASILEIRO DE GEOGRAFIA E ESTATÍSTICA (IBGE). Censo demográfico 2000: características gerais da população. Rio de Janeiro: IBGE, 2000. 178 p.
______. Pesquisa nacional por amostra de domicílios 2004. Rio de Janeiro, Brazil: Abradee, 2004. KAZTMAN, R. (Coord.). Activos y estructuras de oportunidades: estudios sobre las raíces de la vulne-rabilidad social en Uruguay. Montevideo: Cepal, 1999. 357 p.
MITTAL, V.; KAMAKURA, W. A.; GOVIND, R. Geographic patterns in customer service and satis-faction: an empirical investigation, Journal of Marketing, Birminghan, v. 68, n. 3, p. 48-62, 2004. PAIVA, E. L. Manufacturing and marketing integration from a cumulative capabilities perspec-tive. In: ENCONTRO ANUAL DA ASSOCIAÇÃO NACIONAL DOS PROGRAMAS DE PÓS-GRADUAÇÃO EM ADMINISTRAÇÃO, 32., 2008, Rio de Janeiro. Anais... Rio de Janeiro: Anpad, 2008. p. 1-16. 1 CD-ROM.
SISTEMA ESTADUAL DE ANáLISE DE DADOS (Seade). Metodologia. In: ______. Índice paulista de vulnerabilidade social: espaços e dimensões da pobreza nos municípios do Estado de São Paulo. São Paulo: Seade, 2004.