Braz. J. Biol., 67(2): 355-361, 2007 355
Relationships among growth and different NOR phenotypes
in a specific stock of rainbow trout (
Oncorhynchus mykiss
)
Porto-Foresti, F.
a*, Oliveira, C.
b, Tabata, YA.
c, Rigolino, MG.
cand Foresti, F.
b aDepartamento Ciências Biológicas, Faculdade de Ciências,Universidade Estadual Paulista – UNESP, Campus de Bauru, CEP 17033-360, Bauru, SP, Brazil bDepartamento de Morfologia, Instituto de Biociências,
Universidade Estadual Paulista – UNESP, Campus de Botucatu, CEP 18618-000, Botucatu, SP, Brazil cAgência Paulista de Tecnologia dos Agronegócios, Regional Vale do Paraíba,
Estação Experimental de Salmonicultura, Campos do Jordão, SP, Brazil *e-mail: [email protected]
Received May 16, 2005 – Accepted September 16, 2005 – Distributed May 31, 2007 (With 3 figures)
Abstract
Growth is one of the most important aspects in the genetic improvement of cultured fish species. Consequently, genetic parameters related to this feature and their response to selection have been the focus of most research in this area. Such research indicates that, in general, there is enough additive genetic variance related to growth, justifying the use of selection. Based on the usefulness of cytogenetic and molecular markers in the fish culture, the aim of the present work was to analyze the possible relationships among cytogenetic characteristics, specifically the NOR phenotypes, and the increase in length and weight in specimens of the rainbow trout (Oncorhynchus mykiss), resultant from directed mating
between homozygous females and heterozygous males according to their NOR phenotypic patterns. The equations of the relationship between length and weight of the analyzed specimens followed the model Wt = a Ltb, showing b values higher than 3, determinant of a positive allometric growth. The results showed that the different NOR phenotypes were not related with the growth values for length and weight in any statistical test.
Keywords: aquaculture, Oncorhynchus mykiss, chromosome, nucleolar organizer regions (NORs).
Relação entre os diferentes padrões fenotípicos da NOR
e crescimento em truta arco-íris (
Oncorhynchus mykiss
)
Resumo
O crescimento é um dos mais importantes aspectos considerados no melhoramento genético de espécies de peixes cultivadas. Conseqüentemente, a ênfase das pesquisas na área tem sido avaliar os parâmetros genéticos relacionados com esta característica e sua resposta à seleção. Essas pesquisas indicam, em geral, haver variância genética aditiva suficiente para justificar o uso da seleção. Considerando que a utilização de marcadores citogenéticos ou moleculares pode ser de grande valia para a piscicultura, o presente trabalho teve como objetivo analisar a possível relação entre as características citogenéticas, de modo específico os padrões fenotípicos das NORs e o crescimento em comprimento e em peso dos exemplares de trutas arco-íris (Oncorhynchus mykiss) resultantes de acasalamentos dirigidos entre
fêmeas homozigotas e machos heterozigotos, conforme caracterização do padrão fenotípico da NOR. As equações da relação comprimento e peso dos indivíduos analisados seguiram o modelo onde Wt = a Ltb, mostrando valores de b maiores que 3, determinante de um crescimento do tipo alométrico positivo. Os resultados mostraram que os padrões fenotípicos da NOR dos indivíduos homozigotos e dos heterozigotos não apresentaram diferenças estatisticamente significativas entre seus valores de crescimento em comprimento ou peso.
Palavras-chave: aquicultura, Oncorhynchus mykiss, cromossomos, região organizadora nucleolar (RONs).
1. Introduction
The nucleolar organizer regions (NORs) are the chromosome segments where the 18S, 5.8S and 28S ribosomal genes are found. The transcription of these genes has been detected by staining the chromosomes with silver nitrate (Miller et al., 1976; Howell and Black, 1980). The silver nitrate staining reveals only active
NORs, since it stains a set of acidic proteins related to the process of ribosomal production and not the ribos-omal DNA (Miller et al., 1976).
Porto-Foresti, F. et al.
Braz. J. Biol., 67(2): 355-361, 2007 356
cific for several groups (Venere and Galetti Jr., 1989; Moreira-Filho and Bertollo, 1991; Maistro et al., 1998). This feature has been successfully used for the establishment of relationship hypothesis among some fish groups (Amemiya and Gold, 1988; Martinez et al., 1993). Examples of the variability of the NORs patterns in fishes have been frequently reported, regard-ing the number (Miyazawa and Galetti Jr., 1994), loca-tion (Gold et al., 1990; Feldberg et al., 1992) and size (Foresti et al., 1981; Moreira-Filho et al., 1984; Martínez et al., 1991).
Studies carried out in the rainbow trout (Oncorhynchus mykiss) indicated that the NORs are located at a
subter-minal position on the short arms of a submetacentric pair of chromosomes (Schmid et al., 1982; Phillips and Ihssen, 1985; Mayr et al., 1986; Ueda and Kobayashi, 1988; Lloyd and Thorgaard, 1988). However, analy-ses performed on specimens from a reared stock at the Estação Experimental de Salmonicultura (EES) in Campos do Jordão in the state of São Paulo, showed that the nucleolar organizer regions were located at sub-terminal position on the long arms of a submetacentric chromosomal pair. Moreover, amongst the 19 specimens analyzed, 13 showed two chromosomes of similar size displaying two different NOR phenotypes: one with a single NOR (condition N1) and another with two con-secutive NORs (condition N2) stained by silver nitrate (Oliveira et al., 1996).
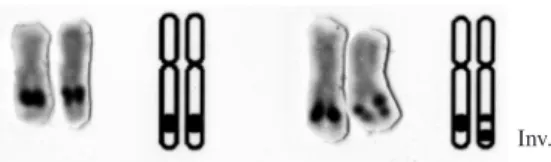
After the analysis of 88 specimens of rainbow trout from the EES stock of Campos do Jordão, Porto-Foresti et al. (2004) confirmed the location of NORs on the long arms of a submetacentric pair of chromosomes, as described before by Oliveira et al. (1996). In the same work, the preliminary observations of Oliveira et al. (1996) were also confirmed, i.e., the presence of both NOR phenotypes (condition N1 and condition N2). The data also confirmed that the differences in the NOR po-sitions were due to the occurrence of a pericentric in-version on the NOR-bearing chromosomes pair and not to the condensation of the chromosomes. Specimens displaying the phenotype pattern N1N1 and N1N2 (Figure 1) were identified, but individuals with the N2N2 phenotype were not found among the individuals ana-lyzed in that stock, suggesting that the homozygous con-dition for double NORs might be lethal.
Growth is one of the most important features consid-ered for genetic improvement purposes of cultured fish species (Gjedrem, 1997; Gjerde, 1986). Consequently, the genetic parameters related to this feature and their re-sponse to selection constitute the focus of most research in this area. Such research indicates that, in general, there is enough additive genetic variance related to growth, justifying the use of selection in fishes (Hershberger et al., 1992).
Taking into account that cytogenetical markers can be useful in fish culture, the present work aimed to analyze the possible relationships among cytogenetic characteristics regarding to NOR phenotypic patterns and growth (length and weight) in specimens obtained after managed mating in a rainbow trout stock reared at Campos do Jordão (São Paulo state, Brazil), to provide guidelines for a better zootechnical management of this species.
2. Materials and Methods
2.1. Experimental set
Six females and six males at reproductive stage were selected from two year-old individuals of rainbow trout broodstock reared at Campos do Jordão (SP, Brazil). The collection of gametes was performed by abdominal pres-sure of males and females after anesthesia in benzocaine solution (100 mg.L-1) and the NOR phenotype of these animals was analyzed. The gametes collected from each animal were divided into six fractions and mating was conducted assuring that the parental line would repre-sent crossings involving each male with all the females (6 x 6 squedule), resulting in 36 samples. Only mating
between homozygous (N1N1) and heterozygous (N1N2) individuals were considered, in order to obtain an off-spring composed of 1:1 homozygous and heterozygous individuals.
Such procedure was repeated twice, and the samples obtained from two homozygous (N1N1) females (female J and female N) were selected, resulting in two offspring sets, identified as A (fertilized with semen of 4 het-erozygous males) and B (fertilized by 4 hethet-erozygous males), both maintained at the same culture conditions.
Eight months after fertilization, 60 animals were randomly sampled and identified with magnetic tags and maintained in separate sets for growth analysis. Biometric analysis (Wt = total weight in grammas and Lt = total length in cm) was carried out in all specimens every three months, during a period of 20 months, to evaluate possible growth difference rates among indi-viduals bearing different NOR phenotypes. The biomass weight was calculated monthly to ensure adequate food supply. The feeding rate varied from 2.5 to 1% of bio-mass/day, decreasing according to the increase of animal weight.
2.2. Cytogenetic analysis
Inv.
Genetic growth in rainbow trout
Braz. J. Biol., 67(2): 355-361, 2007 357
Chromosome preparations were performed from kid-ney cells after stimulation for mitotic activity (Lozano et al., 1988), at the end of the biometric studies, using in vitro short treatment with colchicines (Foresti et al., 1993). Fifty-six specimens were analyzed, 40 from set A and 16 of set B. The nucleolar organizer regions (NORs) were identified according to the method described by Howell and Black (1980).
2.3. Growth analysis
The Student’s t-test was applied to evaluate possible significant growth differences among the animals bear-ing distinct NOR phenotypes, considerbear-ing the growth curves for weight and length in relation to age in days, as well as the curves obtained by the relationship between total length (Lt) and total weight (Wt), in heterozygous and homozygous individuals from each set separately and from grouped sets. The empirical values of total growth and total length were plotted onto a dispersion graph, adopting the adjusted mathematic expression, fol-lowing the model Wt = a Ltb, where a is the condition feature and b represents growth fish performance. The determination coefficient (R2) of data converted to loga-rithms (ln) (Santos, 1978) was also obtained.
3. Results and Discussion
3.1. Cytogenetical analysis
The cytogenetical data showed 24 specimens bear-ing the homozygous NOR phenotype (N1N1) and 32 specimens bearing the heterozygous NOR phenotype (N1N2) (Figure 1). The lack of individuals bearing the homozygous N2N2 NOR phenotype was confirmed, as previously described by Oliveira et al. (1996) and also in the offspring obtained in N1N2XN1N2 crosses (Porto-Foresti et al., 2004).
3.2. Growth analysis
The growth data were based on weight and length values obtained from individuals of eight samplings from the sets A and B, separated according to N1N1 and N1N2 NOR phenotypes, as shown in Tables 1 and 2.
The Student’s t-test applied to analyze the length (Lt)
and weight (Wt) curves in relation to age in days, as well as the Wt x Lt curves in individuals from the sets A and
B, characterized as homozygous and heterozygous, re-spectively, did not reveal significant differences between both phenotypes, as showed in Table 3.
The growth data were analyzed separately for each phenotypic pattern, providing mean and standard-de-viation values for length and weight (Table 4). These data were plotted for the establishment of the correla-tion among NOR phenotypes and values of length and weight from the individuals (Figures 2a and 2b). The specimens lacking biometric information were discarded in the analysis.
The relationships between total weight and total length for the homozygous and heterozygous
individu-als, are represented in Figure 3. The t-test was not per-formed over a values because the regression constants were found to be similar.
Concerning the equation of the relationship between length and weight (Wt = a Ltb), b values were 3.2157 in the
0 500 1000 1500 2000 2500
10 20 30 40 50 60
Lt (cm)
Wt (g)
Homozygous Heterozygous
Figure 3. Graphic representation of the relationship be-tween total weight (Wt) and total length (Lt) and the ad-justed curve in specimens of rainbow trout (Oncorhynchus mykiss), homozygous (N1N1) and heterozygous (N1N2) for the NOR phenotype.
1 2000 Wt (g) 1800 1600 1400 1200 1000 800 600 400 200 0
2 3 4
Biometry
5 6 7 8
a 1 Lt (cm) 10 20 30 40 50 60 0
2 3 4
Biometry
5 6 7 8
b
Heterozygous Homozygous
Porto-F
oresti, F
. et al.
Br
az. J
. Biol., 67(2): 355-361, 2007
358
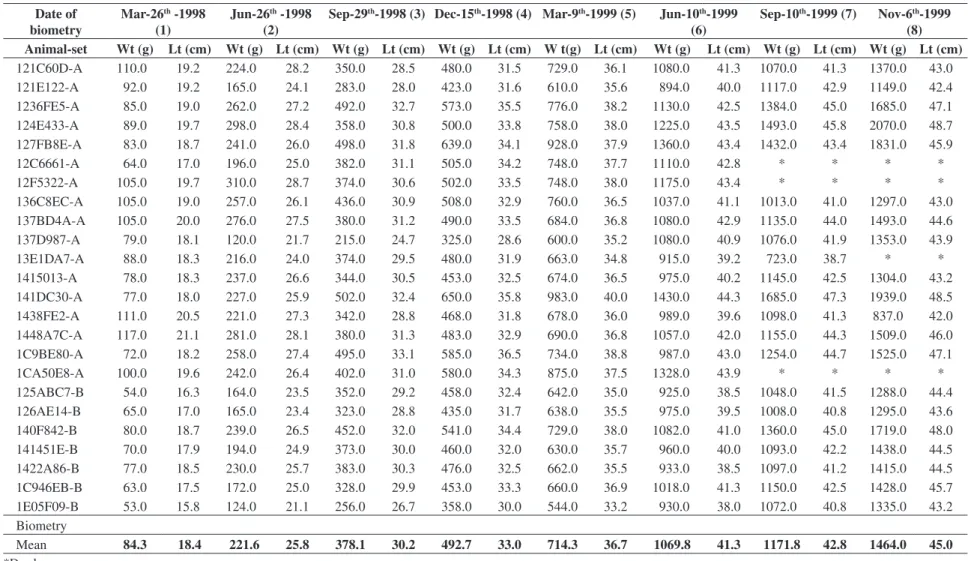
Table 1. Values obtained from the biometric analysis of 24 specimens of rainbow trout (Oncorhynchus mykiss), homozygous (N1N1) for the NOR phenotype. Wt = weight; and Lt = length.
Date of biometry
Mar-26th -1998
(1)
Jun-26th -1998
(2)
Sep-29th-1998 (3) Dec-15th-1998 (4) Mar-9th-1999 (5) Jun-10th-1999
(6)
Sep-10th-1999 (7) Nov-6th-1999
(8)
Animal-set Wt (g) Lt (cm) Wt (g) Lt (cm) Wt (g) Lt (cm) Wt (g) Lt (cm) W t(g) Lt (cm) Wt (g) Lt (cm) Wt (g) Lt (cm) Wt (g) Lt (cm)
121C60D-A 110.0 19.2 224.0 28.2 350.0 28.5 480.0 31.5 729.0 36.1 1080.0 41.3 1070.0 41.3 1370.0 43.0
121E122-A 92.0 19.2 165.0 24.1 283.0 28.0 423.0 31.6 610.0 35.6 894.0 40.0 1117.0 42.9 1149.0 42.4
1236FE5-A 85.0 19.0 262.0 27.2 492.0 32.7 573.0 35.5 776.0 38.2 1130.0 42.5 1384.0 45.0 1685.0 47.1
124E433-A 89.0 19.7 298.0 28.4 358.0 30.8 500.0 33.8 758.0 38.0 1225.0 43.5 1493.0 45.8 2070.0 48.7
127FB8E-A 83.0 18.7 241.0 26.0 498.0 31.8 639.0 34.1 928.0 37.9 1360.0 43.4 1432.0 43.4 1831.0 45.9
12C6661-A 64.0 17.0 196.0 25.0 382.0 31.1 505.0 34.2 748.0 37.7 1110.0 42.8 * * * *
12F5322-A 105.0 19.7 310.0 28.7 374.0 30.6 502.0 33.5 748.0 38.0 1175.0 43.4 * * * *
136C8EC-A 105.0 19.0 257.0 26.1 436.0 30.9 508.0 32.9 760.0 36.5 1037.0 41.1 1013.0 41.0 1297.0 43.0
137BD4A-A 105.0 20.0 276.0 27.5 380.0 31.2 490.0 33.5 684.0 36.8 1080.0 42.9 1135.0 44.0 1493.0 44.6
137D987-A 79.0 18.1 120.0 21.7 215.0 24.7 325.0 28.6 600.0 35.2 1080.0 40.9 1076.0 41.9 1353.0 43.9
13E1DA7-A 88.0 18.3 216.0 24.0 374.0 29.5 480.0 31.9 663.0 34.8 915.0 39.2 723.0 38.7 * *
1415013-A 78.0 18.3 237.0 26.6 344.0 30.5 453.0 32.5 674.0 36.5 975.0 40.2 1145.0 42.5 1304.0 43.2
141DC30-A 77.0 18.0 227.0 25.9 502.0 32.4 650.0 35.8 983.0 40.0 1430.0 44.3 1685.0 47.3 1939.0 48.5
1438FE2-A 111.0 20.5 221.0 27.3 342.0 28.8 468.0 31.8 678.0 36.0 989.0 39.6 1098.0 41.3 837.0 42.0
1448A7C-A 117.0 21.1 281.0 28.1 380.0 31.3 483.0 32.9 690.0 36.8 1057.0 42.0 1155.0 44.3 1509.0 46.0
1C9BE80-A 72.0 18.2 258.0 27.4 495.0 33.1 585.0 36.5 734.0 38.8 987.0 43.0 1254.0 44.7 1525.0 47.1
1CA50E8-A 100.0 19.6 242.0 26.4 402.0 31.0 580.0 34.3 875.0 37.5 1328.0 43.9 * * * *
125ABC7-B 54.0 16.3 164.0 23.5 352.0 29.2 458.0 32.4 642.0 35.0 925.0 38.5 1048.0 41.5 1288.0 44.4
126AE14-B 65.0 17.0 165.0 23.4 323.0 28.8 435.0 31.7 638.0 35.5 975.0 39.5 1008.0 40.8 1295.0 43.6
140F842-B 80.0 18.7 239.0 26.5 452.0 32.0 541.0 34.4 729.0 38.0 1082.0 41.0 1360.0 45.0 1719.0 48.0
141451E-B 70.0 17.9 194.0 24.9 373.0 30.0 460.0 32.0 630.0 35.7 960.0 40.0 1093.0 42.2 1438.0 44.5
1422A86-B 77.0 18.5 230.0 25.7 383.0 30.3 476.0 32.5 662.0 35.5 933.0 38.5 1097.0 41.2 1415.0 44.5
1C946EB-B 63.0 17.5 172.0 25.0 328.0 29.9 453.0 33.3 660.0 36.9 1018.0 41.3 1150.0 42.5 1428.0 45.7
1E05F09-B 53.0 15.8 124.0 21.1 256.0 26.7 358.0 30.0 544.0 33.2 930.0 38.0 1072.0 40.8 1335.0 43.2
Biometry
Mean 84.3 18.4 221.6 25.8 378.1 30.2 492.7 33.0 714.3 36.7 1069.8 41.3 1171.8 42.8 1464.0 45.0
Genetic gro
wth in rainbo
w trout
Br
az. J
. Biol., 67(2): 355-361, 2007
359
Table 2. Values obtained from the biometric analysis of 32 specimens of rainbow trout (Oncorhynchus mykiss), heterozygous (N1N2) for the NOR phenotype. Wt = weight; and Lt = length.
Date of biometry
Mar-26th-1998
(1)
Jun-26th-1998
(2)
Sep-29th-1998
(3)
Dec-15th-1998
(4)
Mar-9th-1999
(5)
Jun-10th-1999
(6)
Sep-10th-1999
(7)
Nov-6th-1999
(8)
Animal-set Wt (g) Lt (cm) Wt (g) Lt (cm) Wt (g) Lt (cm) Wt (g) Lt (cm) Wt (g) Lt (cm) Wt (g) Lt (cm) Wt (g) Lt (cm) Wt (g) Lt (cm)
121D7A7-A 131.0 21.0 342.0 29.0 580.0 34.5 743.0 36.9 1066.0 40.8 1422.0 46.0
121DCA1-A 118.0 20.9 229.0 25.8 396.0 30.5 496.0 33.0 636.0 36.5 740.0 35.8 843.0 39.0 1149.0 42.4
1236CED-A 98.0 19.7 188.0 25.5 352.0 30.0 472.0 33.6 670.0 37.0 1036.0 41.6 1249.0 44.0 1149.0 42.4
1230F10-A 96.0 19.2 210.0 25.6 365.0 30.9 497.0 33.7 667.0 36.5 958.0 41.3 1010.0 41.0 1149.0 42.4
123224D-A 95.0 19.5 211.0 26.1 362.0 31.5 472.0 33.5 632.0 36.2 912.0 40.2 1115.0 42.6 1149.0 42.4
12370F2-A 92.0 19.3 214.0 25.8 370.0 29.8 504.0 33.5 762.0 37.9 1173.0 42.5 1461.0 44.4 1519.0 46.4
124BBF4-A 80.0 18.8 257.0 27.4 323.0 29.3 465.0 32.4 740.0 37.8 1179.0 43.8 1137.0 43.9 1265.0 44.7
124BF54-A 98.0 20.5 236.0 28.2 363.0 32.4 493.0 34.7 760.0 39.4 1168.0 45.0 1545.0 48.6 2030.0 52.9
12504DB-A 107.0 20.1 238.0 26.4 212.0 26.7 272.0 27.4 420.0 30.8 650.0 34.3 * * * *
12C5B43-A 53.0 16.5 211.0 25.6 392.0 31.3 555.0 34.1 798.0 39.0 1282.0 45.1 * * * *
12E1FA8-A 88.0 19.0 226.0 25.8 319.0 29.0 426.0 31.5 632.0 36.0 958.0 40.9 1100.0 42.0 1361.0 44.0
12F52CO-A 95.0 19.7 189.0 25.7 354.0 31.0 472.0 34.3 669.0 38.0 1083.0 43.2 * * * *
13641D4-A 108.0 20.7 284.0 27.5 339.0 31.3 477.0 33.0 718.0 37.0 958.0 39.8 1035.0 41.5 1447.0 44.6
1368A7E-A 104.0 19.8 231.0 26.7 354.0 30.9 480.0 33.4 724.0 37.1 1083.0 41.8 1245.0 42.7 1646.0 45.9
137E1C2-A 94.0 19.3 237.0 26.3 476.0 32.5 598.0 35.9 787.0 39.0 1127.0 42.8 1428.0 45.0 1902.0 48.2
13828CF-A 130.0 21.7 278.0 27.7 272.0 28.2 * * * * * * * * * *
140FEE1-A 70.0 17.6 247.0 27.4 480.0 33.7 583.0 35.5 794.0 38.9 1169.0 43.0 1322.0 44.5 1764.0 48.6
1447CD0-A 93.0 19.3 83.0 20.5 * * * * * * * * * * * *
1448A1E-A 102.0 19.8 207.0 25.0 229.0 25.3 355.0 29.2 632.0 35.3 * * * * * *
144AE6B-A 113.0 19.4 264.0 26.6 447.0 30.7 517.0 33.6 795.0 37.8 1185.0 41.8 1380.0 44.6 1860.0 48.6
1452FD7-A 90.0 18.8 233.0 25.0 356.0 29.3 462.0 32.0 705.0 36.6 1095.0 42.0 1174.0 42.8 1460.0 44.2
1FB87A2-A 60.0 16.9 214.0 26.3 265.0 28.9 368.0 31.5 607.0 36.5 946.0 41.7 1126.0 43.8 1446.0 46.7
1FBD487-A 71.0 17.0 235.0 25.9 437.0 31.2 530.0 33.5 780.0 37.7 1340.0 42.9 * * * *
1FBD5F6-A 70.0 17.5 239.0 25.6 343.0 28.9 440.0 31.7 647.0 35.5 1005.0 39.5 1080.0 41.4 1225.0 42.0
12C5BE1-B 79.0 18.7 229.0 26.0 369.0 30.0 454.0 32.7 545.0 35.4 560.0 35.3 505.0 35.8 620.0 36.5
12C62C8-B 65.0 17.2 191.0 23.2 314.0 27.6 408.0 30.0 630.0 35.0 955.0 39.4 1048.0 40.4 1128.0 41.5
13E14EF-B 75.0 17.7 199.0 24.8 365.0 29.8 468.0 32.5 620.0 35.0 1014.0 39.2 1088.0 40.4 1330.0 43.3
141C5DE-B 54.0 16.7 146.0 23.5 292.0 28.2 405.0 31.4 617.0 35.4 890.0 38.8 1015.0 41.8 1289.0 44.4
1C34112-B 48.0 16.1 142.0 23.7 285.0 28.2 413.0 31.6 565.0 35.0 904.0 39.0 1034.0 41.8 1311.0 44.6
1C944E8-B 49.0 16.2 157.0 22.9 323.0 28.0 449.0 30.8 683.0 35.8 1105.0 40.0 1285.0 43.6 1654.0 46.8
1DBBEB2-B 76.0 18.0 219.0 25.3 351.0 29.2 436.0 31.3 625.0 33.8 810.0 37.0 1119.0 39.8 1167.0 41.5
1E06215-B 52.0 16.7 161.0 24.0 280.0 27.9 411.0 31.4 568.0 35.8 849.0 38.7 946.0 41.4 1268.0 44.0
Biometry
Mean 86.1 18.5 217.1 25.7 353.7 29.9 470.7 32.7 683.1 36.6 1019.2 40.8 1137.1 42.4 1387.0 44.5
Porto-Foresti, F. et al.
Braz. J. Biol., 67(2): 355-361, 2007 360
Table 3. T values obtained from the comparison between specimens of rainbow trout (Oncorhynchus mykiss), heterozygous (N1N2) and homozygous (N1N1) for the Nor phenotype, based on Lt curves (cm) x age in days, Wt (g) x age in days, and Wt (g) x Lt (cm). Lt = length; Wt = weight.
Student’s t-test
Decline Independent terms
Curves (T critical = 1.96) DF (T critical = 2.24) DF
Set A Lt x age 0.25663 291 0.01832 292
Wt x age 0.28177 0.96828
Lt x Wt 0.54438 1.05778
Set B Lt x age 0.37068 92 1.75028 93
Wt x age 0.73992 1.25551
Lt x Wt 0.21999 0.08951
DF = Degree of freedom.
Table 4. Mean, standard deviation, and minimum and maximum values of total length (Lt) and total weight (Wt) of the analyzed specimens of rainbow trout (Oncorhynchus mykiss), heterozygous (N1N2) and homozygous (N1N1) for the Nor phenotype.
Mean ± standard deviation Minimum Maximum
Lt (cm) Wt (g) Lt (cm) Wt (g) Lt (cm) Wt (g)
Homozygous 33.7 ± 8.6 675.3 ± 472.1 15.8 53.0 48.7 2070.0
Heterozygous 36.1 ± 8.6 752.2 ± 454.1 16.1 48.0 52.9 2030.0
homozygous and 3.212 in the heterozygous specimens. Thus these values are in agreement with the statement that b values should range from 2.0 to 4.0; and, if close to 3.0, they could be considered isometric (Weatherley and Gill, 1987; King 1995). Furthermore, these values revealed that the specimens presented a positive allom-etric growth, since b value was higher than 3, indicating that the weight was increased at a rate higher than that necessary to keep a constant body proportion.
The condition factor was similar in both analyzed sets, suggesting that individual identification by mag-netic tags worked as an efficient marking tool in this species, allowing to stock different lines of individuals in the same tank, represented by different NOR pheno-types, and eliminating possible differences due to envi-ronment or management processes.
Our growth data based on weight and length val-ues showed some apparent relationship with N1N1 or N2N2 NOR phenotypes. It can be stated that the absence of N2N2 NOR phenotype in this specific stock of rain-bow trout, probably due to a lethal effect of the double inverted NOR (Porto-Foresti et al., 2004), is the only situation already described about possible effects of the inversion. Besides, the occurrence of the inversion in a heterozygous condition seems to have no effect in the viability or in the development of individuals. A small deviation favoring the heterozygous condition observed in crosses involving N1N2 x N1N2 NOR phenotypes
(Porto-Foresti et al., 2004) is still to be investigated. Since the characteristics related to growth constitute an important feature for the genetic improvement of cul-tured aquatic species (Gjedrem, 1997; Gjerde, 1986), the present results demonstrate that the occurrence of a para-centric inversion involving a NOR-bearing chromosomal
segment, with the consequent origin of distinct NOR phenotypes, does not seem to present any interference in the growth performance of rainbow trout. The only effect caused by this rearrangement would be the inviability of individuals bearing the N2N2 phenotype, as previously demonstrated by Porto-Foresti et al. (2004).
Acknowledgments — The authors are grateful to R. Devidé and AL. Alves for technical assistance, to PM. Galetti Jr., O. Moreira Filho, N. Castagnoli, JF. Lui, for critical review of the original manuscript. F. Porto-Foresti was supported by a fellowship from the Fundação de Amparo à Pesquisa do Estado de São Paulo (FAPESP).
References
AMEMIYA, CT. and GOLD, JR., 1988. Chromosomal NORs as taxonomic and systematic characters in North American cyprinid fishes. Genetica, vol. 76, p. 81-90.
FELDBERG, E., PORTO, JIR. and BERTOLLO, LAC., 1992. Karyotype evolution in Curimatidae (Teleostei, Characiformes) for the Amazon region. I. Studies on the genera Curimata, Psectrogaster, Steindachnerina and Curimatella. Brazil. J. Genet., vol. 15, no. 2, p. 369-383.
FORESTI, F., ALMEIDA-TOLEDO, LF. and TOLEDO-FILHO, SA., 1981. Polymorphic nature of nucleous or-ganizer regions in fishes. Cytogenet. Cell Genet., vol. 31, p. 137-144.
FORESTI, F., OLIVEIRA, C. and ALMEIDA-TOLEDO, LF., 1993. A method for chromosome preparations from large speci-mens of fishes using in vitro short treatment with colchicine. Experientia, vol. 49, p. 810-813.
Genetic growth in rainbow trout
Braz. J. Biol., 67(2): 355-361, 2007 361
GJEDREM, T., 1997. Selective breeding to improve aquacul-ture production. World Aquaculture, vol. 28, p. 33-45. GOLD, JR., LI, YC., SHIPLEY, NS. and POWERS, PK., 1990. Improved methods for working with fish chromosomes with a review of metaphase chromosome banding. J. Fish Biol., vol. 37, p. 563-575.
HERSHBERGER, WK., 1992. Genetic variability in rainbow trout populations. Aquaculture, vol. 100, p. 51-71.
HOWELL, WM. and BLACK, DA., 1980. Controlled silver-staining of nucleolus organizer regions with a protective col-loidal developer: a 1-step method. Experientia, vol. 36, p. 1014-1015.
KING, M., 1995. Fisheries biology, assessment and manage-ment. Oxford: Fishing News Books, p. 341.
LLOYD, MA. and THORGAARD, GH., 1988. Restriction endo-nuclease banding of rainbow trout chromosomes. Chromosoma, vol. 96, p. 171-177.
LOZANO, R., REJON, CR. and REJON, MR., 1988. A method for increasing the number of mitoses available for cytogenet-ic analysis in rainbow trout. Stain Technology, vol.63, no. 6, p. 335-338.
MAISTRO, EL., OLIVEIRA, C. and FORESTI, F., 1998. Comparative cytogenetic and morfological analy-sis of Astyanax scabripinnis paranae (Pisces, Characidae, Tetragonopterinae). Genet. Mol. Biol., vol. 21, no. 2, p. 201-206.
MAYR, B., RAB, P. and KALAT, M., 1986. Localisation of NORs and counterstain-enhanced fluorescence studies in Salmo gairdneri and Salmo trutta (Pisces, Salmonidae). Theor. Appl. Genet., vol. 71, p. 703-707.
MARTÍNEZ, P., VINÃS, A., BOUSA, C., ARIAS, J., AMARO, R. and SANCHEZ, L., 1991. Cytogenetical characterization of hatchery stocks and natural populations of Sea and Brown Trout from northwestern Spain. Heredity, vol. 66, p. 9-17.
MARTÍNEZ, P., VINÃS, A., BOUZA, C., CASTRO, J. and SANCHEZ, L., 1993. Quantitative analysis of the variabil-ity of nucleolar organizer regions in Salmo trutta. Genome, vol. 36, p. 1119-1123.
MILLER, DA., DEV, VG., TANTRAVAHI, R. and MILLER, OJ., 1976. Supression of human nucleolus organizer activity in mouse-human somatic hybrid cells. Expl. Cell Res., vol. 101, p. 235-243.
MIYAZAWA, CS. and GALETTI JR., PM., 1994. First cytoge-netical studies in Characidium species (Pisces: Characiformes, Characidiinae). Cytologia, vol. 59, p. 73-79.
MOREIRA-FILHO, O., BERTOLLO, LAC. and GALLETI JR., P.M., 1984. Structure and variability of nucleolar organ-izer region in Parondotidae fish. Can. J. Genet. Cytol., vol. 26, no. 5, p. 564-568.
MOREIRA-FILHO, O. and BERTOLLO, LAC., 1991. Astyanax scabripinnis (Pisces, Characidae): a species complex. Brazil. J. Genet., vol. 14, no. 2, p. 331-357.
OLIVEIRA, C., FORESTI, F., RIGOLINO, MG. and TABATA, YA., 1996. Paracentric inversion involving a NOR-bearing chromosome of rainbow trout (Oncorhynchus mykiss): electron microscopy studies of the synaptonemal complex. Caryologia, vol. 49, p. 335-342.
PHILLIPS, R. and IHSSEN, PE., 1985. Chromosome banding in salmonid fish: nucleolar organizer regions in Salmo and Salvelinus. Can. J. Genet. Cytol., vol. 27, p. 433-440.
PORTO-FORESTI, F., OLIVEIRA C., GOMES EA., TABATA YA., RIGOLINO MG. and FORESTI F., 2004. Investigation of a lethal effect associated with a polymorphism involving the NOR-bearing chromosomes in rainbow trout (Oncorhynchus mykiss). Genet. Mol. Biol., vol. 27, no. 1, p. 51-54.
SANTOS, EP. Dinâmica de populações aplicada à pesca e pis-cicultura. São Paulo: HUCITEC, Ed. da Universidade de São Paulo, 1978, p. 129.
SCHMID, M., LOSER, C., SCHMIDTKE, J. and ENGEL, W., 1982. Evolutionary conservation of a common pattern of ac-tivity of nucleolous organizer during spermatogenesis in verte-brates. Chromosoma, vol. 86, p. 149-179.
UEDA, T. and KOBAYASHI, J., 1988. Disappearance of Ag-NORs originated from brown trout in the allotriploid female rainbow trout and male brown trout. Proc. Japan Acad., vol. 63b, p. 51-55.
VÊNERE, PC. and GALETTI JR., 1989. Chromosome evolution and phylogenetic relationships of some neotropical Characiformes of the family Curimatidae. Braz. J. Genet., vol. 12, no. 1, p. 17-25.