PADRÕES FITOGEOGRÁFICOS DA REGIÃO CENTRAL DO
DOMÍNIO ATLÂNTICO BRASILEIRO
Tese apresentada ao Programa de Pós-Graduação em Biologia Vegetal do Departamento de Botânica do Instituto de Ciências Biológicas da Universidade Federal de Minas Gerais, como requisito parcial à obtenção do título de Doutor em Biologia Vegetal.
Área de Concentração: Biodiversidade
PADRÕES FITOGEOGRÁFICOS DA REGIÃO CENTRAL DO
DOMÍNIO ATLÂNTICO BRASILEIRO
Tese apresentada ao Programa de Pós-Graduação em Biologia Vegetal do Departamento de Botânica do Instituto de Ciências Biológicas da Universidade Federal de Minas Gerais, como requisito parcial à obtenção do título de Doutor em Biologia Vegetal. Área de Concentração: Biodiversidade
Orientador: Dr. Ary Teixeira de Oliveira Filho Universidade Federal de Minas Gerais
Coorientador: Dr. Pedro V. Eisenlohr Universidade do Estado de Mato Grosso
Padrões fitogeográficos da região central do Domínio Atlântico brasileiro. [manuscrito] / Felipe Zamborlini Saiter. – 2015.
167 f. : il. ; 29,5 cm.
Orientador:. Ary Teixeira de Oliveira Filho. Coorientador: Pedro Vasconcellos Eisenlohr.
Tese (doutorado) – Universidade Federal de Minas Gerais, Departamento de Botânica.
1. Fitogeografia – Teses. 2. Floresta Atlântica – Teses. 3. Macroecologia – Teses. 4. Variação florística – Teses. 5. Gradiente ambiental – Teses. I. Oliveira Filho, Ary Teixeira de. II. Eisenlohr, Pedro Vasconcellos. III. Universidade Federal de Minas Gerais. Departamento de Botânica. IV. Título.
Doce. As árvores todas ligadas por lianas, e reunidas a uma densa vegetação secundária de palmeiras e arbustos, curvam-se para lado das águas, e estendem seus ramos sarmentosos sobre
o rio, como se desejosos de ar e de luz. A floresta forma uma densa muralha ao longo do rio, — tão densa que o olhar não penetra em sua sombra — e deve estar armado de forte
facão-de-mato quem queira nela penetrar. (Relato de Charles Frederick Hartt, geólogo canadense em expedição pelo leste do Brasil em 1865-1867).
Que delicioso dia! Mas o termo delicioso ainda é por demais fraco para exprimir os sentimentos do naturalista que pela primeira vez vagueia por uma floresta brasileira. A elegância das ervas, a novidade das plantas parasitas, a beleza das flores, o verde deslumbrante da folhagem, mas sobrepujando tudo, o vigor e o esplendor da vegetação encheram-me de admiração. Estranho
misto de ruídos e de silêncio reina por toda parte revestida de florestas. (Impressões do naturalista britânico Charles Darwin em seu primeiro contato com uma floresta tropical, na
Bahia, em 29 de fevereiro de 1832).
Agradecimentos
Ao meu orientador, Dr. Ary Teixeira de Oliveira Filho, por ter me motivado com seus “rascunhos mentais” e por ter sido um porto seguro nos momentos difíceis. Aprendi muito com ele, não só sobre a ecologia da vegetação.
Ao meu coorientador, Dr. Pedro V. Eisenlohr, pela dedicação e competência com a minha causa. Sempre esteve disponível para me ajudar, e por isso devo grande parte do meu crescimento acadêmico a ele.
A todos os professores do Programa de Pós-Graduação em Biologia Vegetal da UFMG, que de alguma forma contribuíram para minha formação.
Aos companheiros de pós-graduação “mais próximos”, amigos do Brasil inteiro, que acabaram por encher meu coração de alegrias: Aline Joseph, Ana Claudia, André Gasper, Bruno Falcão, Cristiane Sarmento, Edson, Eric, Filipe (Fifão), Jeferson, Juliana, Leandro, Leila, Marcelo, Maria José, Mariana Piacesi, Pedro Miranda, Raquel, Rozijane, Samuel Gomides, Suzana, Talita e Vanessa Leite.
Ao Instituto Federal do Espírito Santo – Campus Santa Teresa, onde exerço com muito orgulho a função de professor de botânica e biogeografia, e do qual sempre obtive apoio para a realização do curso de doutorado. Agradeço especialmente aos professores Luiz Marcari, Moacir Serafini, Lusinério Prezotti e Danielle Piontkovski, meus “superiores”, os quais não mediram esforços para que eu pudesse cumprir todas as etapas necessárias para o desenvolvimento da tese.
Carollo, Kimberly, Melissa e Dr. Scott Mori, pelas ricas oportunidades de trabalho voluntário oferecidas à minha esposa Welida.
Ao City College of New York, nas pessoas da Dra. Ana Carolina Carnaval e do Dr. Jason Lee Brown, pelo incentivo, apoio e paciência na condução do trabalho que deu origem ao primeiro capítulo da tese.
Aos amigos brasileiros na terra do Tio Sam, Alexandre, Dilma, Toni e Idalina, pela imensa solidariedade durante minha estadia em Harrison e Newark, no Estado de New Jersey.
Sumário
Resumo Geral...9
Introdução Geral...10
Capítulo I – Environmental and topographic correlates of floristic regions and tree species turnover in the Atlantic Forest hotspot...16
Abstract...18
Introduction...19
Materials and Methods...21
Results...23
Discussion...24
References...29
Capítulo II – Recognizing climatic seasonality and geographical location as causes of a latitudinal floristic gradient: implications for conservation of Restinga forests in the central part of the Atlantic forest...40
Abstract...42
Introduction...43
Materials and Methods...45
Results...48
Discussion...49
References...53
Capítulo III – From evergreen to deciduous tropical forests: how energy-water balance, temperature, and space influence the tree species composition in a high diversity region...67
Abstract...69
Introduction...70
Materials and Methods...72
Results...77
Discussion...78
References...84
Capítulo IV – Floristic units and their predictors unveiled in part of the Atlantic Forest hotspot: implications for conservation planning...100
Abstract...102
Introduction...103
Discussion...111
References...117
Capítulo V – A Floresta de Linhares no contexto fitogeográfico do leste do Brasil...134
Introdução...135
O ambiente de tabuleiros em Linhares...137
A semideciduidade ou a perenidade da Floresta de Linhares...138
As afinidades florísticas com a Hileia Baiana e a Amazônia...145
As afinidades florísticas com o Médio Vale do rio Doce e a Falha de Campos dos Goytacazes ...147
Índices de similaridade e a alta diversidade florística da Floresta de Linhares...149
Referências...152
Resumo Geral
A região central do Domínio Atlântico brasileiro se estende do Recôncavo Baiano ao rio Paraíba do Sul (12°-22° Sul). As florestas dessa região são caracterizadas por elevados níveis de diversidade florística e endemismo. Meu objetivo principal nesta tese foi investigar o papel de variáveis ambientais e espaciais na variação florística ao longo da região central do Domínio Atlântico brasileiro. Eu usei subconjuntos distintos de um extenso banco de dados para responder perguntas específicas relacionadas a esse objetivo. O banco de dados completo foi composto por 53.237 registros de ocorrência de 3.047 espécies arbóreas em 227 localidades e 49 variáveis geoclimáticas. Para cada um dos cinco capítulos eu escolhi um escopo analítico diferente considerando algumas das seguintes técnicas: análises de ordenação, de agrupamento, de autocorrelação espacial, ANOVA, e modelos de regressão linear e de dissimilaridade ecológica. Os capítulos foram integrados sob o tema geral de conservação de florestas. Eu indiquei mudanças climáticas como causas da quebra da Floresta Atlântica em dois blocos florísticos em torno da latitude 18°-19° S. Demonstrei que variações na sazonalidade do clima e na localização geográfica são, provavelmente, as principais causas do gradiente florístico latitudinal em restingas. Notei que a variação florística no leste da Bahia está relacionada a gradientes de balanço água-energia e de temperatura, e confirmei parcialmente a consistência de uma classificação das florestas dessa região de acordo com faixas altitudinais e regime de renovação foliar. Identifiquei seis unidades florísticas na bacia do rio Doce, onde a variação florística está fortemente relacionada a mudanças sazonais na precipitação e na temperatura. Por fim, revisei a controversa classificação da Floresta de Linhares e discuti o efeito de intercâmbios florísticos sobre a sua alta diversidade.
Introdução Geral
O conhecimento sobre padrões biogeográficos têm sido útil para o planejamento da conservação da biodiversidade em todo o mundo (Whittaker et al. 2005). Isso se deve à capacidade de biogeógrafos em mapear regiões de acordo com suas similaridades biológicas e ecológicas, gerando suporte para decisões mais sábias em relação às estratégias de conservação (Brooks 2010, Guisan et al. 2013).
No contexto do Domínio Atlântico brasileiro, a conservação de florestas tem sido influenciada pelas contribuições de estudos sobre a distribuição geográfica de espécies de plantas arbóreas e o papel de fatores ambientais sobre a variação florística (por exemplo, Oliveira-Filho & Fontes 2000, Oliveira-Filho et al. 2005, Bertoncello et al. 2011, Nettesheim et al. 2010, Santos et al. 2011, Scudeller et al. 2001). Tais estudos, entretanto, têm estabelecido padrões fitogeográficos gerais para a Floresta Atlântica com base em listas florísticas geradas, sobretudo, em regiões que contam com um maior número de inventários florestais, tal como em parte do sudeste do Brasil.
2010, Saiter et al. 2011).
Na região central do Domínio Atlântico, as florestas cobrem, de leste a oeste, trechos das planícies litorâneas arenosas (ou restingas), os sedimentos do Terciário (ou tabuleiros costeiros), as serras costeiras, as serras do interior e, por vezes, alguns vales úmidos da borda leste e do topo da Cadeia do Espinhaço, onde chegam a destoar da vegetação herbáceo-arbustivo dos campos rupestres. Nesse caminho, o relevo parte de uma condição plana e próxima ao nível do mar nas restingas, se eleva em algumas dezenas de metros (até cerca de 200 m) já sobre os tabuleiros costeiros, e passa à situação dissecada de colinas e montanhas, aumentando gradativamente a altitude até atingir a condição escarpada da borda leste da Serra do Espinhaço (> 1000 m) ou as zonas de transição com o Domínio da Caatinga (800-1000 m no planalto sul-baiano, ou menos que 600 m na bacia do rio Paraguaçu). Essa é apenas uma descrição simplificada do relevo na região, que se apresenta verdadeiramente mais complexo devido a um intricado conjunto geomorfológico marcado pelos vales dissecados por grandes rios como o Paraíba do Sul, o Doce, o Jequitinhonha e o Paraguaçu. Naturalmente, a complexidade geomorfológica se junta a fenômenos oceânicos e atmosféricos para determinar os padrões climáticos, sendo possível encontrar desde áreas muito úmidas, que recebem cerca de 2000 mm de chuva por ano, até áreas de clima semi-úmido a árido, onde a precipitação anual alcança apenas 800 mm. Áreas mais úmidas não necessariamente apresentam um montante de chuvas equilibradamente distribuído ao logo do ano, fato que, por sinal, pode ser constatado apenas na costa sul da Bahia.
espécies arbóreas e a algumas variáveis climáticas e geográficas. Em se tratando de florestas, existem mais dados sobre o componente arbóreo do que qualquer outro grupo de plantas. Em relação a dados ambientais, existem bases de dados confiáveis apenas para um seleto grupo de variáveis climáticas e geográficas, isto é, variáveis climáticas ligadas à disponibilidade de energia e de água e ao balanço água-energia, bem como a variáveis do campo geográfico, como altitude, distância para o oceano, latitude e longitude. As duas últimas, por sinal, eu utilizei, especificamente, em análises espaciais destinadas a compreender o efeito da distância entre sítios amostrais em suas relações florísticas, um padrão já reconhecido para a Floresta Atlântica (Oliveira-Filho & Fontes 2000, Scudeller et al. 2001).
Nesse contexto, dividi a presente tese em cinco capítulos. O leitor certamente procurará por uma conexão entre eles, mas devo alertar que, embora algumas conexões diretas sejam possíveis, o escopo geral da tese foi, na verdade, norteado pela fragmentação das ideias. Com exceção do primeiro capítulo, no qual eu e meus colaboradores apresentamos uma análise mais ampla sobre a fitogeografia da região central do Domínio Atlântico, os demais correspondem a recortes do banco de dados visando a investigação de hipóteses ou temas mais específicos dentro dessa grande região. De qualquer forma, eu e meus diferentes colaboradores adotamos um mesmo plano de fundo nos capítulos, o qual permitiu uma certa integração temática em torno da conservação de florestas na região central do Domínio Atlântico brasileiro.
os dados de restingas em separado no Capítulo II, o qual serviu para confirmar a existência de um gradiente latitudinal de composição florística nas planícies arenosas do Quaternário e relevar uma região com alta prioridade de conservação, o trecho Regência-Prado. No Capítulo III, investigamos as causas da variação florística em uma região megadiversa – o leste da Bahia – e confirmamos, em parte, a consistência florística de uma classificação de florestas seguindo critérios de faixas altitudinais e de regime de renovação foliar. Destinamos o espaço do Capítulo IV para uma investigação das causas da variação florística ao longo da bacia hidrográfica do rio Doce, sem dúvida a área detentora da maior quantidade de inventários florísticos em toda a região central do Domínio Atlântico. Tal condição permitiu o estabelecimento de sub-regiões úteis para o planejamento regional da conservação de florestas. Por fim, no Capítulo V apresentamos um trabalho de revisão sobre a situação da Floresta de Linhares no contexto fitogeográfico do leste do Brasil. Houve, nesse capítulo, a oportunidade de também discutir uma controvérsia histórica envolvendo a classificação dessa floresta (se semidecidual ou perenifólia) e a influência das conexões florísticas com outras regiões sobre a elevada diversidade florística ali encontrada.
Referências
Acevedo-Rodríguez, P. 2012. Alatococcus, a new genus of Sapindaceae from Espírito Santo, Brazil. PhytoKeys 10: 1-5.
Amorim AM, Fiaschi P, Thomas WW, Clifton BC, Carvalho AMV. 2005. The vascular plants of a forest fragment in southern Bahia, Brazil. Sida 21(3): 1726-1752.
Amorim AMA, Jardim JG, Lopes MMM, Fiaschi P, Borges RAX, Perdiz RO, Thomaz WW. 2009. Angiospermas em remanescentes de floresta montana no sul da Bahia, Brasil. Biota Neotropica 9: 313-348.
cloud forests and other forest subtypes amidst the Atlantic forests in south and southeast Brazil. Biodiversity and Conservation 20: 3413-3433.
Brooks T. 2010. Conservation planning and priorities. In: Sodhi NS, Ehrlich PL. Conservation Biology for all. Oxford University Press: New York, p. 181-198.
Delpetre PG. 1999. Riodocea (Rubiaceae, Gardenieae), a new genus from the Brazilian Atlantic forest. Brittonia, 51(1): 15-23.
Fiaschi P, Pirani JR. 2005. Four new species of Schefflera (Araliaceae) from Espírito Santo state, Brazil. Kew Bulletin 60(1): 77-85.
Germano Filho P, Peixoto AL, Jesus RM. 2000. Espécies vegetais descritas a partir de espécimes coletados na Reserva Florestal de Linhares, Espírito Santo, Brasil. Boletim do Museu de Biologia Prof. Mello Leitão (Nova Série): 11/12: 35-48.
Guisan A, Tingley R, Baumgartner JB et al. 2013. Predicting species distributions for conservation decisions. Ecology Letters, (2013) 16: 1424-1435.
Jesus RM, Rolim SG. 2005. Fitossociologia da Mata Atlântica de Tabuleiro. Boletim Técnico SIF 19: 1-149.
Nettesheim FC, Menezes LFT, Carvalho DC, Conde MMS, Araujo DSD. 2010. Influence of environmental variation on Atlantic Forest tree-shrub-layer phytogeography in southeast Brazil. Acta botânica brasilica 24(2): 369-377.
Oliveira-Filho AT, Fontes MAL. 2000. Patterns of floristic differentiation among Atlantic forests in southeastern Brazil and the influence of climate. Biotropica 32(4b): 793-810.
Oliveira-Filho AT, Tameirão-Neto E, Carvalho WAC et al. 2005. Análise florística do compartimento arbóreo de áreas de Floresta Atlântica sensu lato na região das bacias do leste (Bahia, Minas Gerais, Espírito Santo e Rio de Janeiro). Rodriguésia 56(87): 185-235.
Saiter FZ, Guilherme FAG, Thomaz LD, Wendt T. 2011. Tree changes in a mature rainforest with high diversity and endemism on the Brazilian coast. Biodiversity and Conservation 20: 1921-1949.
Santos, M. F.; Serafim, H.; Sano, P. T. 2011. An analysis of species distribution patterns in the Atlantic Forests of Southeastern Brazil. Edinburgh Journal of Botany 68(3): 373-400.
Scudeller VV, Martins FR, Shepherd GJ. 2001. Distribution and abundance of arboreal species in the Atlantic ombrophilous dense forest in southeastern Brazil. Plant Ecology 152: 185-199. Sobral M. 2010. Ten new Myrtaceae from eastern and northeastern Brazil. Journal of the Botanical Research Institute of Texas 4: 133-158.
Thomas WW, Carvalho AMV, Amorim AMA, Garrison J, Arbeláez AL. 1998. Plant endemism in two forests in southern Bahia, Brazil. Biodiversity and Conservation 7: 311-322.
Thomas WW, Carvalho AMV, Amorim AMA, Garrison J, Santos TS. 2008. Diversity of Woody Plants in the Atlantic Coastal Forest of Southern Bahia, Brazil. Memoirs of the New York Botanical Garden 100: 21-66.
Wendt T, Coser TS, Boudet-Fernandes H, Martinelli G. 2010. Bromeliaceae do município de Santa Teresa, Espírito Santo: lista de espécies, distribuição, conservação e comentários taxonômicos. Boletim do Museu de Biologia Prof. Mello Leitão (Nova Série) 27: 21-53.
Capítulo I –
Environmental and topographic correlates of floristic
regions and tree species turnover in the Atlantic Forest hotspot
Felipe Zamborlini Saiter, Jason Lee Brown, William Wayt Thomas, Ary Teixeira
de Oliveira-Filho & Ana Carolina Carnaval
Original Article (5,362 words)
Environmental and topographic correlates of floristic regions and plant turnover in the Atlantic Forest hotspot
Felipe Z. Saiter1,4,*, Jason L. Brown2, William Wayt Thomas3, Ary T. de Oliveira-Filho4, and Ana
Carolina Carnaval2
1Instituto Federal do Espírito Santo, Santa Teresa, ES, 29650-000, Brazil.
2Department of Biology, City College of New York and the Graduate Center of CUNY, New
York, NY 10031, USA.
3The New York Botanical Garden, Bronx, NY 10458-5126, USA.
4Departamento de Botânica, Universidade Federal de Minas Gerais, Belo Horizonte, MG,
31270-901, Brazil.
*Correspondence: Felipe Z. Saiter, Instituto Federal do Espírito Santo, Santa Teresa, ES,
29650-000, Brazil.
E-mail: fsaiter@ifes.edu.br
ABSTRACT
Aim: Using a comprehensive floristic database (2,616 species, 36,004 occurrence records from 128 unique localities), we model species turnover along the central corridor of the Atlantic Forest hotspot to i) test whether local rivers, particularly the Rio Doce, are associated with marked biogeographic breaks, and ii) investigate how regional compositional changes correlate with geo-climatic variables.
Location: The central part of the Atlantic Forest in eastern Brazil (12°-22° S latitude).
Methods: We combine occurrence and geo-climatic data in a Generalized Dissimilarity Model, obtaining a continuous prediction of species turnover across space and identifying 12 significant geo-climatic predictors of community composition. We use a two-step cluster analysis to classify the turnover map into major floristic regions based on the natural subgroups observed. We further divide each major floristic region into smaller sub-regions based on natural subgroups statistically identified by the two-step cluster analyses.
Results: High levels turnover in species composition occurs around latitudes 18°-19° S, ca. 50-100 km north of the Rio Doce, and concurs with shifts in availability of both humidity and energy. We identify three major floristic regions in the central part of the Atlantic Forest, which we call Bahia Interior Forests, Bahia Coastal Forests, and the Krenák-Waitaká Forests – each of them divided into 2-4 sub-regions.
INTRODUCTION
Biogeography is central to conservation planning (Whittaker et al., 2005). By mapping spatial biodiversity patterns, biogeographers identify regions of more or less heterogeneity in species composition, and provide evidence in support of conservation strategies and mobilization of funds (Brooks, 2010; Guisan et al., 2013). Such mapping of compositionally similar areas can be further complemented whenever spatial changes in species composition, here referred to as species turnover, are modelled as a function of environmental variables. Areas of pronounced species turnover indicate concordant range limits across species, and help us to identify regions that are significantly distinct in their composition (Williams, 1996; Magnusson, 2004; Whittaker et al., 2005).
Plant communities are particularly amenable to studies of species turnover given the abundance of complete or nearly complete inventory and floristic datasets for model training and validation (Ferrier et al., 2002). Turnover of plant species is known to be influenced by both topographic elements (e.g. large rivers and mountain ranges) and ecological determinants (e.g. biotic interactions, climate, soil, and disturbance) that collectively impact individual dispersal, survivorship, and recruitment of each species (Cox & Moore, 2005). Although potentially acting at different scales, these elements function as filters and, in concert, define which taxa are able to occupy a certain area, given a regional species pool (Keddy, 1992).
turnover across South American rivers at the species and lineage level (e.g. Costa et al., 2003; Hayes & Sewlal, 2004; Haffer, 2008; Ribas et al., 2011). On the other hand, large-scale studies based on reliable floristic datasets of well-known tropical forest plant groups (e.g. trees) and geo-climatic data provided by interpolated databases such as WorldClim (Hijmans, 2005) and CliMond (Kriticos et al., 2012) demonstrate strong correlations between floristic composition and climatic and topographic shifts (e.g. Toledo et al., 2012; Qian, 2013; Saiter et al. [upon acceptance]).
We investigate these questions in the biodiverse Atlantic Forest of Eastern Brazil. Biogeographic studies of multiple animals and plants support the existence of a biogeographic break around the Rio Doce (ca. 19° S latitude; Thomas et al., 1998; Pellegrino et al., 2005; Cabanne et al., 2007; Brito & Arias, 2010; Ribeiro et al., 2011; Carnaval et al., 2014). Although a riverine barrier has been implied as possible cause of the break (e.g. Thomas et al., 1998; Pellegrino et al., 2005; Cabanne et al., 2007), recent analyses suggest that climatic shifts may be responsible for this pattern (Ribeiro et al., 2011; Carnaval et al., 2014; Saiter et al., [upon acceptance]). Irrespectively of the underlying mechanisms, the pervasiveness of the
biogeographic break is leading to the recognition of two major blocks within the Atlantic Forest hotspot – one to the south, and one to the north of the Rio Doce (Fiaschi & Pirani, 2009; Carnaval et al., 2014).
provide a basis for conservation planning.
MATERIALS AND METHODS Study region
Our study encompasses the central part of the Atlantic Forest in eastern Brazil (Figures 1A and 1D), extending between the Recôncavo in the state of Bahia (ca. 12° S latitude) and the Rio Paraíba do Sul in the state of Rio de Janeiro (ca. 22° S latitude). The analyses, and resulting maps, exclude the forest patches and the riverine forests within the Espinhaço Range and Diamantina Plateau, which comprise diverse vegetation mosaics constituting the Cerrado (typical savannah in central Brazil), the Campos Rupestres (highland savannahs), and the Caatinga (semi-arid steppe in northeast Brazil).
Occurrence and Geo-climatic Data
We used a binary matrix of tree species occurrences for 128 sites throughout the study region (Figure 1A) taken from the NeoTropTree database (see http://www.icb.ufmg.br/treeatlan/ for database details; Oliveira-Filho, 2014). A total of 2,616 species and 36,004 presence records are included in the analyses.
Present-day climate data consist of Hijman’s et al. (2005) 19 bioclimatic variables at 30-arc second resolution describing local temperature and precipitation (Bioclim, available at
http://www.worldclim.org/), and 16 additional Bioclim variables at 2.5 arc-minute resolution
pertaining to soil moisture and solar radiation (Kriticos et al., 2012; variables 20-35 downloaded from https://www.climond.org/; see Appendix S1 in Supporting Information for a complete list of environmental variables). Because the variables 20-35 were only available at a comparatively
coarser resolution, we downscaled them to 30 arc-seconds using the ANUSPLIN method as per
analyses (Hijmans et al., 2005). An additional covariate, annual precipitation, was used for the downscaling of variables pertaining to solar radiation (Bioclim 20-27); this incorporates the
known dependences of solar radiation on cloud cover associated with rainfall, which gives rise to
more complex solar radiation patterns in areas of topographic complexity (Hutchinson et al., 1984). Two additional covariates, slope and aspect, were used to downscale the variables
pertaining to soil moisture (Bioclim 28-35). These were included because both affect the amount
of solar radiation that habitats receive, hence directly influencing soil moisture and water
retention (Geroy et al., 2011). The final downscaled variables are available for download at http://sdmtoolbox.org/ (Brown 2014) [upon acceptance].
Generalized Dissimilarity Modelling
Generalized Dissimilarity Modelling (GDM) is a statistical technique extended from matrix regressions designed to accommodate nonlinear data commonly encountered in ecological studies. A common use of GDM is to predict spatial patterns of turnover in community composition across large areas. Briefly, a GDM is fitted to available biological data (the absence or presence of species at each site), then compositional dissimilarity is predicted at unsampled localities throughout the landscape based on environmental data in the model. The output is a matrix of predicted compositional dissimilarities (PCD) between pairs of locations throughout the focal landscape. To visualize the PCD, multidimensional scaling is applied, reducing the data to three ordination axes and, in a Geographic Information System software, each axis is assigned a separate RGB color (red, green or blue).
To match the resolution of the community composition data, we upscaled the environmental data to 5 km2 by averaging the higher resolution (30 arc-second) data. Both
our model, we used a stepwise backward elimination process as outline by Williams et al. (2012). Briefly, the model is initially built will all predictor variables and then iteratively, variables are removed that contribute less 0.1% to the deviance explained of the model, until all predictor variables in the model contribute more than 0.1% to the deviance explained. Using this method we went from 39 predictor variables down to 12 in the final model. The model built at 5 km2 was subsequently projected into the full resolution (1 km2) climate data. The continuous
GDM was classified into three major regions, and each of these was then classified separately into 2-4 sub-regions. The numbers of regions and sub-regions were based on Two-Step Cluster Analyses in SPSS v21 (Banfield & Raftery, 1993; Zhang et al., 1996; Theodoridis & Koutroumbas, 1999; IBM Corp., 2012).
RESULTS
A GDM explains 56% of the observed turnover in species composition in the central part of the Atlantic Forest. The continuous GDM framework (Figure 1F) can be split into three major floristic regions (hereafter referred to Bahia Interior Forests, Bahia Coastal Forests, and Krenák-Waitaká Forests; Figure 1C). The Bahia Interior Forests encompassed moist and dry forests of northeastern Minas Gerais and inland Bahia, and is further divided into four sub-regions (Figure 1E). The Bahia Coastal Forests include the wet forests north of 18-19° S, which can be further separated into three sub-regions (Figure 1E). In turn, the Krenák-Waitaká forest region encompasses two sub-regions of moist forest south of 18-19° S (Figure 1E). The term Krenák-Waitaká is a junction of the names of two main Amerindian groups that inhabited this region before the arrival of Europeans and Africans.
Bahia Coastal Forests, we further identify two sub-regions of low and mid-elevation: one extending south of the Rio Paraguaçu basin, and another encompassing the Rio Paraguaçu basin and Recôncavo. The Bahia Interior Forests also have two sub-regions of low and mid-elevation (the Jequitinhonha-Pardo region and Rio Paraguaçu basin) and other two sub-regions of high elevation (the Jequitinhonha-Pardo region and the Bahian plateau). The Bahia Coastal Forests and Bahia Interior Forests are more ecologically similar to each other than to the Krenák-Waitaká Forests (see dendogram in Figure 1 for relationships among regions and sub-regions).
The geographical limits of the main floristic regions fail to coincide with the Rio Doce valley, as the boundary between the Bahia Interior Forests and the Krenák-Waitaká Forests, and that between the Bahia Coastal Forests and the Krenák-Waitaká Forests, were located 50-100 km north of the river. These turnover regions also appear to have no correspondence with any other river in northern Espírito Santo or northeastern Minas Gerais (Figure 1). Instead, the GDM identifies 12 significant predictors of species composition turnover (see Appendix S2). Among the top five predictors in relative contribution are variables that describe the amount of insolation (Bio 24), moisture index (Bio 34), elevation, temperature (Bio10), and precipitation (Bio 14) – attesting to the role of availability of both water and energy in maintaining the floristic patterns observed.
DISCUSSION
2011). The river is no more than 1 km wide (observed at the lower basin), and its size has not changed significantly since the last transgression period (5.1 kyr BP; Suguio & Kohler, 1992).
However, floristic composition does changes significantly around latitude 18°-19° S (i.e., 50-100 km north of the Rio Doce), as reflected in the boundaries of three major floristic regions proposed here. The availability of both water and energy vary sharply between these latitudes (see below specific commentaries on each floristic region), suggesting that the current climate is working as a filter and limiting the distribution of tree species (Keddy, 1992).
The Krenák-Waitaká Forests are seasonal in terms of precipitation, solar radiation and temperature, in contrast with the Bahia Coastal Forests. This pattern of seasonality is known to result from seasonal atmospheric phenomena. In the winter, for instance, the South Atlantic Subtropical Anticyclone encroaches in southeastern Brazil, blocking the passage of humid air masses (Reboita et al., 2010). In the summer, on the other hand, the South Atlantic Subtropical Anticyclone shifts to the west, towards the Atlantic Ocean. Thus, humid air masses commonly increase rainfall over continent. Such seasonal changes are, however, not observed north of latitudes 18°-19° S. In the Bahia Coastal Forests, two main atmospheric mechanisms bring great amounts of humidity and prevent the establishment of a dry season: the South Atlantic Convergence Zone works in spring-summer, whereas the Convergence Zone of the Eastern Coast of Northeast Brazil provides high amounts of monthly precipitation in autumn-winter (Molion & Bernardo, 2002).
but not in the Krenák-Waitaká Forests (for additional details about interior dry forests, see Santos et al., 2012; and Arruda et al., 2013).
Our climate-based approach does not invalidate historical approaches to the study of the phytogeography of the Atlantic Forest, but rather complements them. Previous studies have, for instance, recognized the historical influence of the Subtropical-Andean flora on the composition of forests in a southern block of the Atlantic Forest, or flagged a stronger influence of the Amazonian flora in the northern block (e.g. Fiaschi & Pirani, 2009; Oliveira-Filho et al., 2013; Duarte et al., 2014). We can still recognize these influences in our analysis. Subtropical taxa such as Araucaria angustifolia (Bertol.) Kuntze and Mimosa scabrella Benth., as well as many species of Lauraceae, Melastomataceae, Myrtaceae, and tree ferns (Behling & Pillar, 2006; Duarte et al., 2014) are solely observed in part of the Krenák-Waitaká Forests (the Mantiqueira Range, around the 20o S latitude). This compositional uniqueness matches existing hypotheses that such species,
which survive in a few cooler and isolated mountains above 1000 m within the Mantiqueira Range, are relicts of a northward expansion of the subtropical flora during the Last Glacial Maximum (LGM), ca. 48-18 ka BP (Behling & Lichte, 1997). On the other hand, some of the tree species observed in the Bahia Coastal Forests and Krenák-Waitaká Forests have disjunct distributions in Amazonia (Mori et al., 1981; Thomas et al., 1998), such as Anthodiscus amazonicus Gleason & A.C.Sm., Caraipa densifolia Mart., Erythroxylum macrophyllum Cav., Macoubea guianensis Aubl., Parkia pendula (Willd.) Walp., and Pagamea guianensis Aubl. This pattern is predicted by hypotheses of a historical bridge between Amazonia and the Atlantic Forest through the gallery forests within the northeast-southwest corridor of open vegetation formations of central Brazil, through the Caatinga and the Cerrado (Oliveira-Filho & Ratter, 1995; Costa et al., 2003; Oliveira-Filho et al., 2013).
der Werff, Cariniana parvifolia S. A. Mori, Prance & Menandro, Hydrogaster trinervis Kulhm., Kielmeyera occhioniana Saddi, Mollinedia marqueteana Peixoto, Plinia stictophylla G.M. Barroso & Peixoto, Riodocea pulcherrima DelPrete, Simira grazielae Peixoto, and Trattinnickia mensalis Daly) and the more seasonal coastal lowland forests of the Rio Doce region (usually referred to as the Linhares Forest). The coast of southern Bahia is a known center of plant diversity (Thomas et al., 1998), and it has been hypothesized that rainforest coverage has remained stable in this region for a long time (Carnaval & Moritz, 2008). Further, paleoclimate studies suggest that coastal Bahia was as wet in the Mid-Holocene (roughly 6 ka BP) as it is today (e.g. Melo & Marengo, 2008).
The Linhares Forest around the Rio Doce, although presently characterized by a seasonal climate, also experienced wetter and less seasonal climate during the Mid-Holocene (Buso Junior et al., 2013). It is possible that floristic exchanges across southern Bahia and the Linhares Forest were facilitated during the wet Mid-Holocene, and that humidity-associated species were able to persist around the Rio Doce until today in regions where drought can be offset by humid soils (e.g. riverine forests).
Mattos-Silva, 1979; Cardoso et al., 2009).
In Bahia’s coastal region, a distinction between two lowland sub-regions is remarkable because some species commonly found in the Atlantic Forest-Caatinga transition (e.g. Acrocomia intumescens Drude, Myrcia rosangelae NicLugh., Duguetia moricandiana Mart., and Gochnatia oligocephala (Gardner) Cabrera) occur throughout the Rio Paraguaçu basin and the Recôncavo, but not south of them. This pattern may be related to subtle south-north changes in the water-energy balance during the critically warm summer months (Silva & Satyamurty, 2006), although it can also be the result of a dry and seasonal paleoclimate in such regions.
Through the use of GDMs, we are able to present an ecologically coherent and unbiased classification of floristic regions for the central Atlantic Forest, and demonstrate how these regions are strongly related to climatic variables. These results matter tremendously for the noteworthy effort of mapping of ecoregions worldwide (e.g. World Wildlife Fund-WWF global map of ecoregions; Olson et al., 2001). It is known that Olson et al. (2001) used the Brazilian vegetation map (IBGE, 1993) to generate WWF’s ecoregion map. However, the IBGE map is essentially phytophysiognomic, because it was built solely from environmental data (particularly general climate and water deficit), information on vegetation structure, and leaf flush regime (IBGE, 1992). We argue that both the IBGE’s (1993) vegetation map and Olson et al.’s (2001) ecoregion maps disregard important regional differences in forest composition that we are able to identify here, and expect that a biome-wide GDM will significantly improve mapping of biodiversity throughout the Atlantic Forest.
arguably at mesoscale approaches, such as the one performed here, that improvements in the quantity and quality of biological data can lead to significant changes in biodiversity mapping – particularly for conservation planning in a shrinking hotspot.
ACKNOWLEDGEMENTS
F.Z.S. thanks the Coordenação de Aperfeiçoamento de Pessoal de Nível Superior (CAPES) for the Sandwich Fellowship at the New York Botanical Garden and City College of CUNY. A.T.O.F. thanks the Conselho Nacional de Desenvolvimento Científico e Tecnológico (CNPq) for support. W.W.T. thanks the National Science Foundation (DEB 0946618) for support. A.C.C. and J.L.B. thank FAPESP (BIOTA, 2013/50297-0), NSF (DEB 1343578, 1343578), and NASA, through the Dimensions of Biodiversity Program.
REFERENCES
Aguiar, A.L., Cirano, M., Pereira, J. & Marta-Almeida, M. (2014) Upwelling processes along a western boundary current in the Abrolhos-Campos region of Brazil. Continental Shelf Research, 85, 42-59.
Arruda, D.M., Ferreira-Júnior, W.G., Duque-Brasil, R. & Schaefer, C.E.R. (2013) Phytogeographical patterns of dry forests sensu stricto in northern Minas Gerais State, Brazil. Anais da Academia Brasileira de Ciências, 85, 623-634.
Banfield, J.D. & Raftery, A.E. (1993) Model-based Gaussian and non-Gaussian clustering. Biometrics, 49, 803-821.
Behling, H. & Lichte, M. (1997) Evidence of dry and cold climatic conditions at glacial times in tropical Southeastern Brazil. Quaternary Research, 48, 348-358.
modern Araucaria forest and grassland ecosystems. Philosophical Transactions of the Royal Society B, 362, 243-251.
Brito, R.M. & Arias, M.C. (2010) Genetic structure of Partamona helleri (Apidae, Meliponini) from Neotropical Atlantic rainforest. Insectes Sociaux, 57, 413-419.
Brooks, T. (2010) Conservation planning and priorities. Conservation Biology for all (ed. By N.S. Sodhi and P.L. Ehrlich), pp. 181-198. Oxford University Press, New York.
Brown, J.L. (2014) SDMtoolbox: a python-based GIS toolkit for landscape genetic, biogeographic and species distribution model analyses. Methods in Ecology and Evolution, 5, 694-700.
Buso Junior, A.A., Pessenda, L.C.R., Oliveira, P.E., Giannini, P.C.F., Cohen, M.C.L., Volkmer-Ribeiro, C., Oliveira, S.M.B., Rossetti, D.F., Lorente, F.L., Borotti Filho, M.A., Schiavo, J.A., Bendassolli, J.A., França, M.C., Guimarães, J.T.F. & Siqueira, G.S. (2013) Late Pleistocene and Holocene vegetation, climate dynamics, and Amazonian taxa in the Atlantic Forest, Linhares, SE Brazil. Radiocarbon, 55, 1747-1762.
Cabanne, G.S., Santos, F.R. & Miyaki, C.Y. (2007) Phylogeography of Xiphorhynchus fuscus (Passeriformes, Dendrocolaptidae): vicariance and recent demographic expansion in southern Atlantic forest. Biological Journal of the Linnean Society, 91, 73-84.
Cardoso, D.B.O.S., França, F., Novais, J.S., Ferreira, M.H.S., Santos, R.M., Carneiro, J.M.S. & Gonçalves, J.M. (2009) Composição florística e análise fitogeográfica de uma floresta semidecídua na Bahia, Brasil. Rodriguésia, 60, 1055-1076.
Carnaval, A.C. & Moritz, C. (2008) Historical climate modelling predicts patterns of current biodiversity in the Brazilian Atlantic Forest. Journal of Biogeography, 35, 1187-1201.
environmentally complex biome. Proceedings of the Royal Society B, 281, 20141461.
Coe, H.H.G & Carvalho, C.N. (2013) Cabo Frio, um enclave semiárido no litoral úmido do Estado do Rio de Janeiro: respostas do clima atual e da vegetação pretérita. GEOUSP 33, 136-151.
Costa, L.P. (2003) The historical bridge between the Amazon and the Atlantic Forest of Brazil: a study of molecular phylogeography with small mammals. Journal of Biogeography, 30, 71-86. Cox, C.B. & Moore, P.D. (2005). Biogeography: an ecological and evolutionary approach, 7th edn. Wiley-Blackwell, Hoboken.
Cupolillo, F., Abreu, M.L. & Vianello, R.L. (2008) Climatologia da bacia do rio Doce e sua relação com a topografia local. Geografias, 4, 45-60.
Dexter, K.G., Terborgh, J.W. & Cunningham, C.W. (2012) Historical effects on beta diversity and community assembly in Amazonian trees. Proceedings of the National Academy of Sciences of the United States of America, 109, 7787-7792.
Duarte, L.D.S., Bergamin, R.S., Marcilio-Silva, V., Seger, G.D.D.S. & Marques, M.C.M. (2014) Phylobetadiversity among Forest Types in the Brazilian Atlantic Forest Complex. PLOS ONE, 9, e105043.
Ferreira, V.O. & Silva, M.M. (2012) O Clima da Bacia do Rio Jequitinhonha, em Minas Gerais: Subsídios para a Gestão de Recursos Hídricos. Revista Brasileira de Geografia Física, 2, 302-319.
Ferrier, S., Drielsma, M., Manion, G. & Watson, G. (2002) Extended statistical approaches to modelling spatial pattern in biodiversity in northeast New South Wales. II. Community-level modelling. Biodiversity and Conservation, 11, 2309-2338.
Fiaschi, P. & Pirani, J.R. (2009) Review of plant biogeographic studies in Brazil. Journal of Systematics and Evolution, 47, 477-496.
Aspect influences on soil water retention and storage. Hydrological Processes, 25, 3836-3842. Grubb, P.J. (1977) Control of forest growth and distribution on wet tropical mountains, with
special reference to mineral nutrition. Annual Review of Ecology and Systematics, 8, 83-107. Guisan, A., Tingley, R., Baumgartner, J.B. et al. (2013) Predicting species distributions for conservation decisions. Ecology Letters, 16, 1424-1435.
Haffer, J. (2008) Hypotheses to explain the origin of species in Amazonia. Brazilian Journal of Biology, 68, 917-947.
Hayes, F.E. & Sewlal, J.N. (2004) The Amazon River as a dispersal barrier to passerine birds: effects of river width, habitat and taxonomy. Journal of Biogeography, 31, 1809-1818.
Hijmans, R.J., Cameron, S.E., Parra, J.L., Jones, P.G. & Jarvis, A. (2005) Very high resolution interpolated climate surfaces for global land areas. International Journal of Climatology, 25, 1965-1978.
Hutchinson, M.F., Booth, T.H., McMahon, J.P. & Nix, H.A. (1984) Estimating monthly mean values of daily total solar radiation for Australia. Solar Energy, 32, 277-290.
IBGE. 1993. Mapa de Vegetação do Brasil. Fundação Instituto Brasileiro de Geografia e Estatística, Ministério da Agricultura, Rio de Janeiro.
IBGE 1992. Manual Técnico da Vegetação Brasileira. Série Manuais Técnicos em Geociências, vol 1. Instituto Brasileiro de Geografia e Estatística, Rio de Janeiro.
IBM Corp. 2012. IBM SPSS Statistics for Windows, version 21.0. IBM Corp., Armonk.
Keddy, P.A. (1992) Assembly and response rules: two goals for predictive community ecology. Journal of Vegetation Science, 3, 157-164.
Körner, C. (2007) The use of ‘altitude’ in ecological research. Trends in Ecology and Evolution, 22, 569-574.
modelling. Methods in Ecology and Evolution, 3, 53-64.
Magnusson, W.E. (2004) Ecoregion as a Pragmatic Tool. Conservation Biology, 18, 1.
Melo, M.L.D. & Marengo, J.A. (2008) Simulações do clima do Holoceno Médio na América do Sul com o modelo de circulação geral da atmosfera do CPTEC. Revista Brasileira de Meteorologia, 23, 191-205.
Molion, L.C.B. & Bernardo, S.O. (2002) Uma revisão da dinâmica das chuvas no nordeste brasileiro. Revista Brasileira de Meteorologia, 17, 1-10.
Mori, S. (1990) Diversificação e conservação das Lecythidaceae neotropicais. Acta botanica brasilica, 4, 45-68.
Mori, S., Boom, B.M. & Prance, G.T. (1981) Distribution patterns and conservation of eastern brazilian coastal forest tree species. Brittonia, 33, 233-245.
Mori, S.A. & Mattos-Silva, L.A. (1979) The herbarium of the “Centro de Pesquisas do Cacau” at Itabuna, Brazil. Britonia, 31, 177-196.
Oliveira-Filho, A.T. (2014) NeoTropTree, flora arbórea da região neotropical: um banco de dados envolvendo biogeografia, diversidade e conservação. Universidade Federal de Minas Gerais. http://www.icb.ufmg.br/treeatlan/
Oliveira-Filho, A.T., Budke, J.C., Jarenkow, J.A., Eisenlohr, P.V. & Neves, D.R.M. (2013) Delving into the variations in tree species composition and richness across South American subtropical Atlantic and Pampean forests. Journal of Plant Ecology, DOI: 10.1093/jpe/rtt058. Oliveira-Filho, A.T. & Ratter, J.A. (1995) A study of the origin of central Brazilian forests by the analysis of plant species distribution patterns. Edinburgh Journal of Botany, 52, 141-194.
Pellegrino, K.C.M., Rodrigues, M.T., Waite, A.N., Morando, M., Yassuda, Y.Y. & Sites Jr, J.W. (2005) Phylogeography and specie slimits in the Gymnodactylus darwinii complex (Gekkonidae, Squamata): genetic structure coincides with river systems in the Brazilian Atlantic Forest. Biological Journal of the Linnean Society, 85, 13-26.
Perret, M., Chautems, A. & Spichiger, R. (2006) Dispersal-vicariance analyses in the tribe Sinningieae (Gesneriaceae): a clue to understanding biogeographical history of the Brazilian Atlantic Forest. Annals of the Missouri Botanical Garden, 93, 340-358.
Qian, H. (2013) Environmental determinants of woody plant diversity at a regional scale in China. PLOS ONE, 8, e75832.
Reboita, M.S., Gan, M.A., Rocha, R.P. & Ambrizzi, T. (2010) Regimes de precipitação na América do Sul: uma revisão bibliográfica. Revista Brasileira de Meteorologia, 25, 185-204. Ribas, C., Aleixo, A., Nogueira, A.C.R., Miyaki, C.Y. & Cacraft, J. (2011) A palaeobiogeographic model for biotic diversification within Amazonia over the past three million years. Proceedings of the Royal Society B, DOI: 10.1098/rspb.2011.1120
Ribeiro, R.A., Lemos-Filho, J.P., Ramos, A.C.S. & Lovato, M.B. (2011) Phylogeography of the endangered rosewood Dalbergia nigra (Fabaceae): insights into the evolutionary history and conservation of the Brazilian Atlantic Forest. Heredity, 106, 46-57.
Rosauer, D.F., Ferrier, S., Williams, K.J., Manion, G., Keogh, J.S. & Laffan, S.W. (2013) Phylogenetic generalised dissimilarity modelling: a new approach to analysing and predicting spatial turnover in the phylogenetic composition of communities. Ecography, 36, 1-12.
Saiter, F.Z., Eisenlohr, P.V., França, G.S., Stehmann, J.R., Thomas, W.W. & Oliveira-Filho, A.T. [upon acceptance] Floristic units and their predictors unveiled in part of the Atlantic Forest
seasonally dry tropical forests (SDTFs) of north-eastern and Central Brazil. Ecology and Evolution, 2, 409-428.
Silva, L.A. & Satyamurty, P. (2006) The role of the upper tropospheric cyclonic systems in the northeast of Brazil rain inhibition. Proceedings of the 8th International Conference on Southern Hemisphere Meteorology and Oceanography, p. 2027-2031
Suguio, K. & Kohler, H.C. (1992) Quaternary Barred Lake Systems of the Doce River (Brazil). Anais da Academia Brasileira de Ciências, 64, 183-191.
Theodoridis, S. & Koutroumbas, K. (1999) Pattern recognition. Academic Press, New York. Thomas, W.W., Carvalho, A.M.V., Amorim, A.M.A., Garrison, J. & Arbeláez, A.L. (1998) Plant endemism in two forests in southern Bahia, Brazil. Biodiversity and Conservation, 7, 311-322. Toledo, M., Peña-Claros, M., Bongers, F., Alarcón, A., Balcázar, J., Chuviña, J., Leaño, C., Licona, J.C. & Poorter, L. (2012) Distribution patterns of tropical woody species in response to climatic and edaphic gradients. Journal of Ecology, 100, 253-263.
Wallace, A.R. (1853) A narrative of travels on the Amazon and Rio Negro: with an account of the native tribes, and observations on the climate, geology, and natural history of the Amazon valley. Reeve and Co., London.
Williams, P.H. (1996) Mapping variations in the strength and breadth of biogeographic transition zones using species turnover. Proceedings of the Royal Society B, 263, 579-588.
Williams, K.J., Belbin, L., Austina, M.P., Stein, J.L. & Ferrier, S. (2012) Which environmental variables should I use in my biodiversity model? International Journal of Geographical Information, 26, 2009-2047.
p. 103-114, Montreal.
Supporting Information
Additional Supporting Information may be found in the online version of this article:
Appendix S1 Bioclim variables used to modelling turnover in tree species composition in the central part of the Atlantic Forest, Brazil.
Appendix S2 Twelve significant geo-climatic predictors of turnover in tree species composition in the central part of the Atlantic Forest, eastern Brazil.
BIOSKETCHES
The authors are part of a broader interdisciplinary team funded by NSF, NASA and FAPESP to
explain and predict of the distribution of animal and plant species in the endangered yet
megadiverse Brazilian Atlantic forest. In pre-Columbian times, this ecosystem extended for 3000
km, forming a fringe of forests sandwiched between the Atlantic Ocean and the drier uplands of
the Brazilian shield. Today, the forest is reduced to less than 11% of its historical range, yet its
fragments harbor one of the largest percentages of endemic species in the world. Work by the
team is enabling the reconstruction of historical and present-day factors influencing Atlantic
forest biodiversity at three different dimensions (genetic, taxonomic and functional) and, given a
range of climate change scenarios, will permit predictions of the composition of biodiversity
under future conditions.
domain, study extent, and 128 localities which provided data for a generalized dissimilarity model – GDM; (B) Elevation map; (C) Major floristic
regions classified from GDM: i, Bahia Interior Forests, ii, Bahia Coastal Forests, and iii, Krenák-Waitaká Forests; (E) Floristic sub-regions and their
interrelationships; (F) Continuous GDM framework.
Appendix S1 Bioclim variables used to modelling turnover in tree species composition in the central part of the Atlantic Forest, Brazil.
Geography: Elevation; Slope; Aspect; Geographic distance.
Temperature: Bio01, Annual mean temperature; Bio02, Mean diurnal temperature range; Bio03, Isothermality; Bio04, Temperature seasonality; Bio05, Maximum temperature; Bio06, Minimum temperature; Bio07, Temperature annual range; Bio08, Mean temperature of wettest quarter; Bio09, Mean temperature of driest quarter; Bio10, Mean temperature of warmest quarter; Bio11, Mean temperature of coldest quarter.
Precipitation: Bio12, Annual precipitation; Bio13, Precipitation of wettest month; Bio14, Precipitation of driest month; Bio15, Precipitation seasonality; Bio16, Precipitation of wettest quarter; Bio17, Precipitation of driest quarter; Bio18, Precipitation of warmest quarter; Bio19, Precipitation of coldest quarter.
Radiation: Bio20, Annual mean radiation; Bio21, Highest weekly radiation; Bio22, Lowest weekly radiation; Bio23, Radiation seasonality; Bio24, Radiation of wettest quarter; Bio25, Radiation of driest quarter; Bio26, Radiation of warmest quarter; Bio27, Radiation of coldest quarter.
Capítulo II –
Recognizing climatic seasonality and geographical
location as causes of a latitudinal floristic gradient: implications
for conservation of Restinga forests in the central part of the
Atlantic forest
Felipe Zamborlini Saiter, Pedro V. Eisenlohr, Oberdan José Pereira, William Wayt
Thomas & Ary Teixeira de Oliveira-Filho
ORIGINAL ARTICLE
Recognizing climatic seasonality and geographical location as causes of a latitudinal floristic gradient: implications for conservation of Restinga forests in the central part of the Atlantic forest
Felipe Zamborlini Saiter1,5*, Pedro V. Eisenlohr2, Oberdan José Pereira3, William Wayt Thomas4,
Ary Teixeira de Oliveira-Filho5
1Instituto Federal de Educação, Ciência e Tecnologia do Espírito Santo, Rod. ES 080, Km 93,
São João de Petrópolis, Santa Teresa, Espírito Santo, 29660-000, Brazil.
2Universidade do Estado de Mato Grosso, Laboratório de Ecologia, Av. Perimetral Rogério Silva,
s/n, Jardim Flamboyant, Alta Floresta, Mato Grosso, 78580-000, Brazil.
3Herbário VIES, Universidade Federal do Espírito Santo, Av. Fernando Ferrari, 514, Vitória,
Espírito Santo, 29075-910, Brazil.
4The New York Botanical Garden, 2900 Southern Blvd, Bronx, New York, 10458-5126, United
States of America.
5Departamento de Botânica, Universidade Federal de Minas Gerais, Av. Antônio Carlos, 6627,
Abstract
Restinga forests are one of the most endangered and neglected ecosystems of the South America and their pythogeographic patterns are poorly known. Here, we submitted climatic and occurrence data of tree species from Restinga sites in the central part of the Atlantic forest to numerical analyses in order to determine the role of climate and geographical location of sites in a latitudinal floristic gradient, and to discuss the implications of such patterns for conservation. We confirmed the existence of such a gradient, one that was strongly related to climatic seasonality, and especially to temperature seasonality. Within this gradient, we noticed a stronger variation in composition in a region known for its transitional climate, from seasonal to non-seasonal. The shifts in climatic seasonality can be explained by a set of atmospheric and oceanographic phenomena and by geographical relief inland. Geographical location influences species composition because spatial proximity means similarity in climatic conditions, although dispersal difficulties can also limit the distribution of some species. Within the study region, we recognize the Regência-Prado stretch as the most relevant area for conservation of Restingas, because of the paucity of reserves and the high floristic variation within a relatively short distance along the coast.
Introduction
The causes of mesoscale variation in floristic composition are still poorly understood in South American forests (ter Steege et al., 2006). Several studies have demonstrated that floristic gradients are related to shifts in availability of water and energy (e.g., Oliveira-Filho et al., 2005; ter Steege et al., 2006; Toledo et al., 2011). In turn, the effect of geographical distance on changes in tree species composition has also been noticed by many studies (e.g., Oliveira-Filho et al., 2005; Macía etal., 2007; Saiter et al., 2015). This effect can be simply a result of spatial structuring of environmentor limited dispersal of some species (Legendre & Legendre 2012).
An interesting region for investigation of causes of floristic gradients is the central part of the Atlantic Forest (CCAF). This is a priority area for biodiversity conservation in the South American tropics that stretches in the Brazilian coast from southern Espírito Santo (ca. 21° S) to southeastern Bahia (ca. 13° S; Ayres et al., 2005). Here, several studies have found some of the highest levels of plant diversity and endemism in the world (e.g., Thomas et al., 1998; Martini et al., 2007; Saiter et al., 2011). In the shoreland of the CCAF, there are sandy coastal plains, also named Restingas, which originated from deposition of fluvial-marine quartzic sandy during the Quaternary (Martin et al., 1996). Plant colonization in these plains is, therefore, a relatively recent event with the source of species provided mainly by the Atlantic forest over adjacent, more ancient geological formations (Rizzini 1979; Scarano 2002), such as the coastal tablelands formed of Tertiary sediments, and the hills of the Precambrian basement.
canopy ca. 10 m height, and great abundance of lianas and shrubs (Amorim et al., 2008; Giaretta et al., 2013).
Given that Restinga forests have lower richness and endemism levels than other forest types within the Atlantic forest, little attention has been paid to their protection against urban and industrial expansion, beach-front development, mining (mainly of sand and oil), and illegal collection of ornamental plants and wood (Zamith & Scarano 2006). When Restingas are degraded by such activities, the restoration of communities becomes extremely expensive and difficult due to edaphic, microclimatic, and biological factors (Zamith & Scarano 2006; Saiter et al., 2012). Thus, the current scenario in the coastal zone shows a few Restingas with natural communities (although often subjected to some human impacts) and large areas of degraded sandy plains covered by invasive species or occupied by urban settlements and industrial sites (Saiter et al., 2012). Unfortunately, degradation is likely to worsen because few studies (e.g. Scarano 2009) have provided useful scientific knowledge for the formulation of appropriate strategies for Restinga conservation.
Although Restingas are highly endangered, the phytogeographic relationships among their forests within the CCAF are still poorly known. The sole attempt was performed by Giaretta et al. (2013) in a study about floristic relationships among coastal forests found in Restingas, tablelands, and ‘muçunungas’ (patches of sandy soils within the coastal tablelands) between southernmost Bahia and southern Espírito Santo (17°30’-20°30’ S). These authors provided biological evidences of a latitudinal floristic gradient along the coast, but did not discuss its possible drivers.
related to a latitudinal gradient of tree species composition in Restingas of the CCAF? [2] Does geographical location influence the floristic relationships among Restinga sites in the CCAF?
Materials and Methods Study region
The study region comprises Restingas of the CCAF occurring discontinuously between the Itabapoana River, in southern Espírito Santo, and the Bahia de Todos os Santos, south of Salvador, in Bahia (Fig. 1). Restingas can be broken up by Tertiary tablelands or crystalline Precambrian formations extending all the way to the Atlantic (Martin 1996; Dillenburg & Hesp 2009). We included the sandy tablelands of the Olivença region (Bahia) in this study region due to their proximity to the ocean and their structural and floristic similarity to typical Restinga forests (Araujo et al., 2008; Amorim et al., 2008). The sandy tablelands are constituted by a deep layer (> 2 m) of podzolized sand over sandy-clay soils (variety Cururupe; Santana et al., 2002) and their origin due to deposition of quartzic sand by wind remains speculative (Araujo et al., 2008).
Preparing the dataset
Because NeoTropTree adopts circular sampling units with 5 km radius, our dataset included all tree species recorded in the Restinga sites, regardless their occurrence over non-flooded sand ridges or in non-flooded depressions. We emphasize that forest physiognomies are only a portion of the vegetation mosaic in Restingas, and that we are considering treelike plants (e.g. some palms and cacti) within a broad concept of tree species due their importance in characterization of Restinga forests.
The binary matrix had 596 tree species and 3196 presence records, but we excluded 168 singletons (species with only one occurrence data point) because they could not contribute to ordination patterns (Lepš & Šmilauer 2003). Thus, the final matrix comprised 428 species, 23 sites, and 3028 occurrence records.
The environmental matrix comprised 25 variables. A total of 19 bioclimatic variables were obtained from WorldClim 1.4, including a set of layers with high resolution (1 km2)
organized by Hijmans et al. (2005). Three other variables, potential evapotranspiration, actual evapotranspiration, and an aridity index, were produced by Zomer et al. (2007) from WorldClim's data. The percentage of cloud coverage was obtained from Harris (2014), and the mean duration (in days) and severity of water deficit (amount in mm) were extracted from Walter's diagrams (Walter 1985).
Data analyses
We used the Nonmetric Multidimensional Scaling (NMS) ordination in the software PC-ORD 6 (McCune & Mefford 2011) to create a dimension that could represent the main gradient of species composition within the dataset. The significance of this dimension was tested using Monte Carlo test (p ≤ 0.05) and the stress stability was verified through successive iterations (McCune & Grace 2002).
using Pearson's correlation and a linear regression model (OLS). Redundant variables were excluded when the variance inflation factor (VIF) of each variable was greater than 10 (e.g., Quinn & Keough 2002). We considered the best linear regression model to be the one having the lowest AICc value (Burnham & Anderson 2002). Assumptions of this model were confirmed according suggestions provided by Eisenlohr (2013) and Eisenlohr (2014).
In order to recognize any spatial structure in the variables and residuals of the model, we created correlograms with Moran's I coefficient in the software SAM 4.0 (Rangel et al., 2010). We tested the global significance of the correlogram using Bonferroni's sequential correction, and confirmed the existence of spatial structure when at least one distance class was significant (Fortin & Dale 2005). Spatial structures need to be checked because, although they improve our understanding of ecological patterns, they may also violate statistical assumptions (Diniz-Filho et al., 2003).
Because we found spatial structure in climatic variables and NMS scores, and this structure can inflate the type I error (Legendre et al., 2002), we modeled the spatial component to confirm previous decisions based on p-values. These models were built through the addition of spatial filters (Moran's Eigenvector Maps; Dray et al., 2006) that were forward selected under a RDA (Canonical Redundancy Analysis) scheme followed by a variance partitioning, thereby discounting the effect of spatial structures (Peres-Neto & Legendre 2010). Here, we used the R-code suggested by Eisenlohr (2014). Since the significance of previous models was supported, we opted to show the results of the simplest models, i.e., without inclusion of spatial filters.
We performed an additional variance partitioning considering the overall floristic data to unveil the contribution of each driver set (climate, space, and the spatially structured fraction of climate variables) on the variation of species distribution along Restinga sites.
evapotranspiration) in order to respect an assumption of RDA (number of predictors < number of sites) adopted in the aforementioned protocol. In this way, we used a climatic matrix with only 22 variables in the partitioning. We also tested the significance of pure fractions of climate and space by permutation-based ANOVA. We conducted variance partitioning analyses using the packages ‘vegan’, ‘spacemakeR’, ‘packfor’ and ‘spdep’ in R (R Core Team 2011). Finally, the correlation between floristic and geographic distance matrices was tested using Mantel test, followed by the Monte Carlo test with 999 permutations.
Results
The NMS provided a one-dimensional solution with a final stress of 18.66 and explained 78.4% of variation in relation to the similarity in the original n-dimensional space. The southern and northern sites were placed, respectively, at left and right sides of the ordination diagram (Fig. 2). In the central portion of the diagram, there were large gaps among the sites Regência, Conceição da Barra, Caravelas, and Prado, indicating that floristic turnover is stronger in a coastal stretch with ca. 200 km between northern Espírito Santo and southernmost Bahia (hereafter named as Regência-Prado stretch). This unexpected pattern instigated us to inspect the whole dataset and, thus, we found that distribution range of several tree species is discontinued in this part of the CCAF. For instance, around 60% of 70 species of Fabaceae, one of the most important families in the tree stratum of the Atlantic forest (Rizzini 1979), have their distribution ranges discontinued somewhere in the Regência-Prado stretch (see Table S1).
were positioned to the left and the less seasonal sites (northern sites) to the right in the ordination diagram (Fig. 2).
The best linear regression model (AICc = 19.91; r² adjusted = 0.90; F = 185.93; p < 0.001) had only temperature seasonality as a predictor. Both pure fractions of environment (3%) and space (2.5%) were significant (p ≤ 0.05) in the variance partitioning. The Mantel test indicated a positive correlation between floristic and geographic distance matrices (r = 0.81, p < 0.01), reinforcing the role of space in determining tree species composition. The spatially structured fraction of climate (12%) was greater than the pure fractions. The unexplained fraction was high (82.5%).
Discussion
Our results indicated a latitudinal gradient of tree composition in Restingas of the CCAF, with floristic turnover stronger in the Regência-Prado stretch than in other parts of the study region. This phytogeographic pattern confirms the findings of Giaretta et al. (2013) and reveals remarkable implications for conservation of Restingas, an issue that we will return later in this paper.
in temperature and a decrease in productivity in forests worldwide (e.g., Larjavaara & Muller-Landau 2012).
Because we have recognized that temperature seasonality was strongly collinear to variables representing seasonal distribution of rain (such as precipitation of coldest quarter, precipitation of driest quarter, and precipitation seasonality), thus, it should be reasonable to state that thermal shifts concur with changes in rainfall regime along the CCAF. In this sense, temperature seasonality is lower where there is no dry season, specifically north of Prado. On the other hand, thermal seasonality reaches its maximum in Itapemirim and Praia das Neves, where the dry season can last up to 3 months and precipitation of the coldest quarter is only 10-15% of the annual total.
The congruence of thermal and rainfall regimes can be explained by a set of atmospheric and oceanographic phenomena and by the inland geographical relief. In coastal Bahia, the absence of a dry season is caused mainly by two atmospheric mechanisms carrying great amounts of humidity. The South Atlantic Convergence Zone works in spring-summer, whereas the Convergence Zone of the Eastern Coast of Northeast Brazil provides the highest amounts of monthly precipitation in autumn-winter (Molion & Bernardo 2002). In coastal Espírito Santo, however, the South Atlantic Subtropical Anticyclone encroaches on the continent during the winter, blocking the passage of humid air masses that cause weather fronts (Cupolillo et al., 2008).


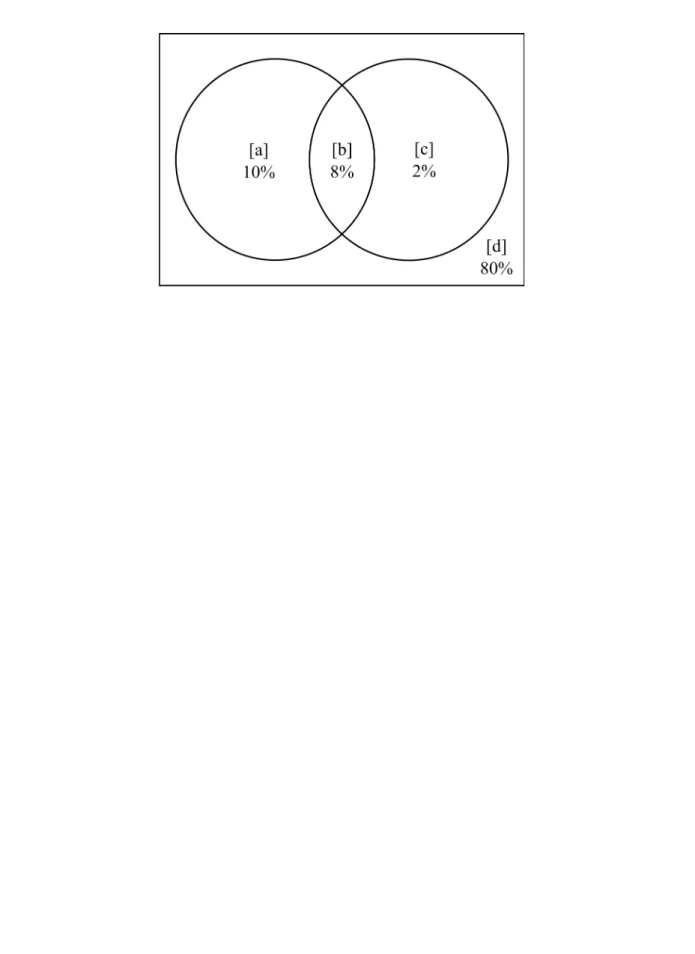
![Figure 3. Venn diagram showing the variance partitioning for [a] climatic variables + elevation only, [b] the spatially structured fraction of climatic variables + elevation, [c] spatial components only, and [d] unmeasured factors](https://thumb-eu.123doks.com/thumbv2/123dok_br/15648326.620111/100.892.310.604.269.474/partitioning-variables-elevation-spatially-structured-variables-components-unmeasured.webp)