There are many problems involving cases of destruction of buildings and other structures. The columns can deteriorate for several reasons such as the evolution and changing habits of the loads. The experimental phase of this work was based on a test involving nine reinforced concrete columns under combined bending and axial compression, at an initial eccentricity of 60 mm.
Two columns were used as reference, one having the original dimensions of the column and the other, monolithic, had been cast along the thick-ness of the strengthened piece. The remaining columns received a 35 mm thick layer of self-compacting concrete on their compressed face. For the preparation of the interface between the two materials, this surface was scariied and furrowed and connectors were inserted onto the columns’ shear reinforcement in various positions and amounts.As connectors, 5 mm diameter steel bars were used (the same as for stirrups), bent in the shape of a “C” with 25 mm coatings.
As a conclusion, not only the quantity, but mainly, the location of the connectors used in the link between substrate and reinforcement is crucial to increase strength and to change failure mode.
Keywords: sreinforced concrete, columns, self-compacting concrete, connectors, eccentric load.
Muitos são os problemas envolvendo casos de ruína de edifícios, pontes, entre outros, e especiicamente ruína de pilares, que é um dos elos mais importantes do conjunto estrutural. Isto pode ocorrer por falha de projeto, de execução ou ainda, pela evolução e alteração de hábitos. Por isso tem sido de fundamental importância das pesquisas que abordam o comportamento experimental das estruturas. A etapa experimental deste trabalho baseou-se no teste de nove pilares de concreto armado ensaiados à lexo-compressão reta, com excentricidade inicial de 60 mm. Dois pilares foram usados como referência, sendo um com as dimensões originais do pilar e o outro, monolítico, concretado na espessura da peça reforçada. Os demais pilares receberam uma camada de 35 mm de espessura de concreto auto-adensável na face comprimida. Para preparo da zona de interface entre os dois materiais, procedeu-se com a escariicação e a realização de sulcos ao longo desta superfície, onde foram inseridos conectores ligados a armadura transversal do pilar, variando-se a posição e a quantidade dos mesmos. Pode-se concluir que não só a quantidade, mas principalmente, a localização dos conectores utilizados na ligação entre substrato e reforço, é imprescindível para um aumento de resistência e mudança do modo de ruptura.
Palavras-chave: concreto armado, pilares, concreto auto-adensável, conectores, carga excêntrica.
Experimental analysis of reinforced concrete
columns strengthened with self-compacting concrete
and connectors
Análise experimental de pilares de concreto armado
reforçados com concreto auto-adensável e conectores
P. P. NASCIMENTO a [email protected]
R. B. GOMES b [email protected]
L. L. J. BORGES c [email protected]
D. L. DAVID d [email protected]
a Cegef, Federal University of Goiás, [email protected], Praça Universitária, s/nº – Setor Universitário – CEP 74605-220, Goiânia, Brazil; b School of Civil Engineering, Federal University of Goiás, [email protected], Praça Universitária, s/nº – Setor Universitário – CEP 74605-220,
Goiânia, Brazil;
c Federal Institute of Goiás – IFG, [email protected], Av. Pedro Ludovico s/n, Bairro Reny Cury – CEP 75131-500 Anápolis – Goiás d Ieme Brasil Engenharia Consultiva, [email protected], Rua MMDC, 499, São Paulo-SP.
Received: 28 Nov 2011 • Accepted: 04 Apr 2012 • Available Online: 26 Jun 2012
Abstract
1. Introduction
This study consists of an experimental program included in a re-search area developed at the School of Civil Engineering of Uni -versidade Federal de Goiás (Federal University of Goiás). Aiming at experimentally comparing the formulation suggested by Mello (2003), Adorno (2004) assayed 12 columns of simple concrete and reinforced concrete subjected to combined bending and axial com-pression under an initial eccentricity of up to 30 mm. Araújo (2004) complemented this work assaying nine columns with different rates of reinforcement and initial eccentricities of 30 mm to 60 mm. The experimental and theoretical results with greater concordance occurred in the cases of smaller eccentricities. Omar (2006) stud-ied the behavior of columns strengthened by self-compacting con-crete (SCC) on the compressed face and by tension reinforcement on the tensioned face. Nascimento (2006) investigated columns strengthened with SCC on the compressed face and with carbon iber on the tensioned face. In their works, Omar (2006) and Nasci-mento (2006) observed load capacity increase on columns under combined bending and axial compression and strengthened with SCC on the compressed face, however, uncoating of the strength -ening concrete was also conirmed.
To reduce the effects of premature uncoating of the strengthening concrete and consequently of abrupt column strain, Sahb (2008) suggested improving the link between substrate and strengthen-ing concrete by addstrengthen-ing anchor bolts in various amounts and posi-tions. Sahb obtained considerable increase mainly in failure load. Choosing to use anchor bolts and SCC can be considerably posi -tive, nevertheless a greater number of connectors has been shown necessary to obtain a more ductile failure mode.
Based on the indings of previous studies, this work investigates columns submitted to combined bending and axial compression and strengthened with SCC on the compressed face. In addition, the interfacial zone between differently aged concrete is strength-ened with open stirrups acting as connectors.
This study’s main goal is to check the possibility of strengthening
reinforced concrete columns aiming at an increase of ductile failure load to avoid uncoating and enabling a failure by concrete crushing and steel yield. The use of connectors produced with steel bars ixed on the columns’ stirrups is a substitute to anchor bolts used by Sahb (2008) and is, to some extent, often used in civil construction. All strengthened columns had their loads increased when com-pared to the original reference column P1. The number and posi -tion of connectors inluenced loads and failure modes of the mod-els assayed. Both the distance from the center and the spacing
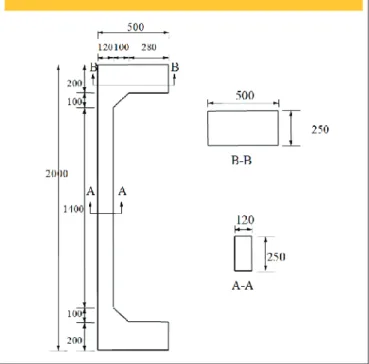
Figure 1 – Dimensions of original columns (mm)
on the interfacial zone of each column, thus improving the model’s monolithic behavior and preventing their failure by uncoating of the strengthening concrete.
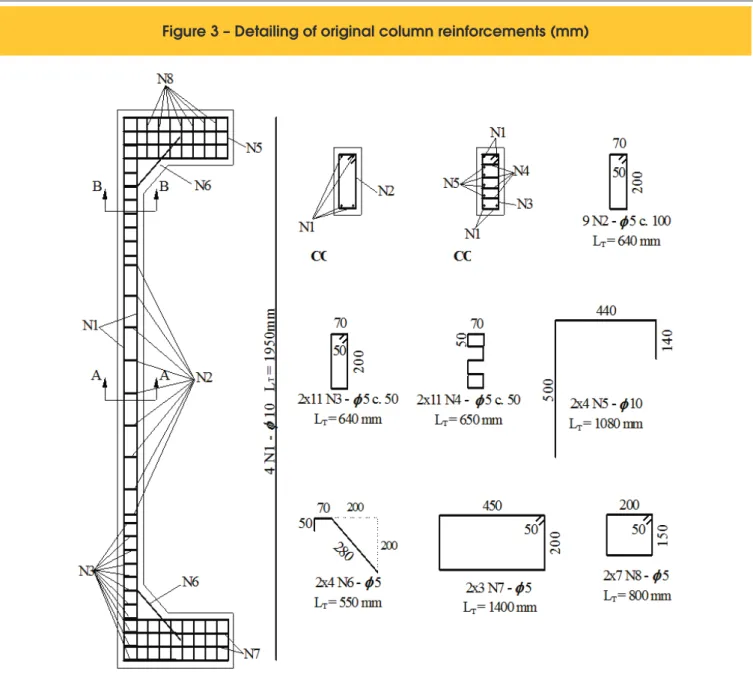
The P1 model with cross-section of 120 x 250 mm represents the original model in conventional concrete. Column P2 is a monolithic reference model; its inal section is 155 x 250 mm, identical to the reinforced column. The remaining columns were strengthened with a 35 mm thick layer of SCC on the compressed face. Figure 2 shows the characteristics of the transversal sections of the umns assayed. The original longitudinal reinforcement of all col-umns (Figure 3) is composed of four ribbed straight bars with a 10 mm nominal diameter (As = 314 mm
2, ρ=1.05 %). Figure 4 shows
the tension curve x strain of 10 mm diameter bars. The shear rein-forcement is made up of 5 mm stirrups whose spacing measures 100 mm in the central area and 50 mm near the model’s edges (fy =
662 MPa, ey = 2.91 mm/m, Es = 225.3 GPa). P6A column is
identi-between connectors inluence the columns’ failure loads and es -pecially their failure modes.
2. Experimental program
The experimental program included tests on nine columns whose measurements are shown in Figure 1. These models of tests and the test arrangements are similar to those carried out by Adorno (2004), Araújo (2004), Omar (2006), Nascimento (2006) and Sahb (2008). The columns were cast in two phases. In the irst phase, six models were shaped, two of which were used as non strengthened reference columns. The remaining columns (second phase) were strengthened with SCC on the compressed face. Their initial ec -centricity decreased; therefore, the original load application posi-tion was maintained. To ensure bonding between strengthening concrete and substrate, connectors were used in various positions
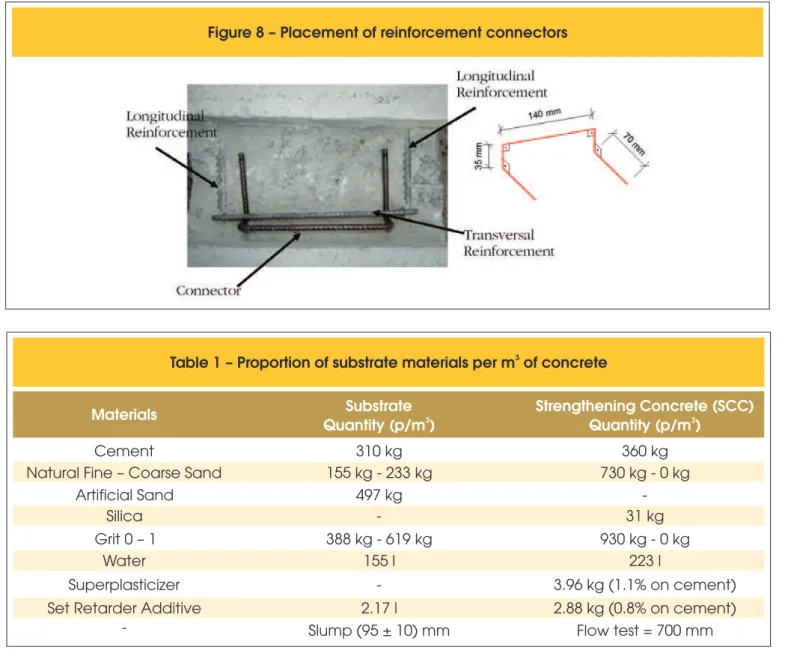
shape of a “c” 140 mm wide, 35 mm high and a 70 mm extension. Once ixed and involving the stirrups of the columns, they allowed a 25 mm coating.
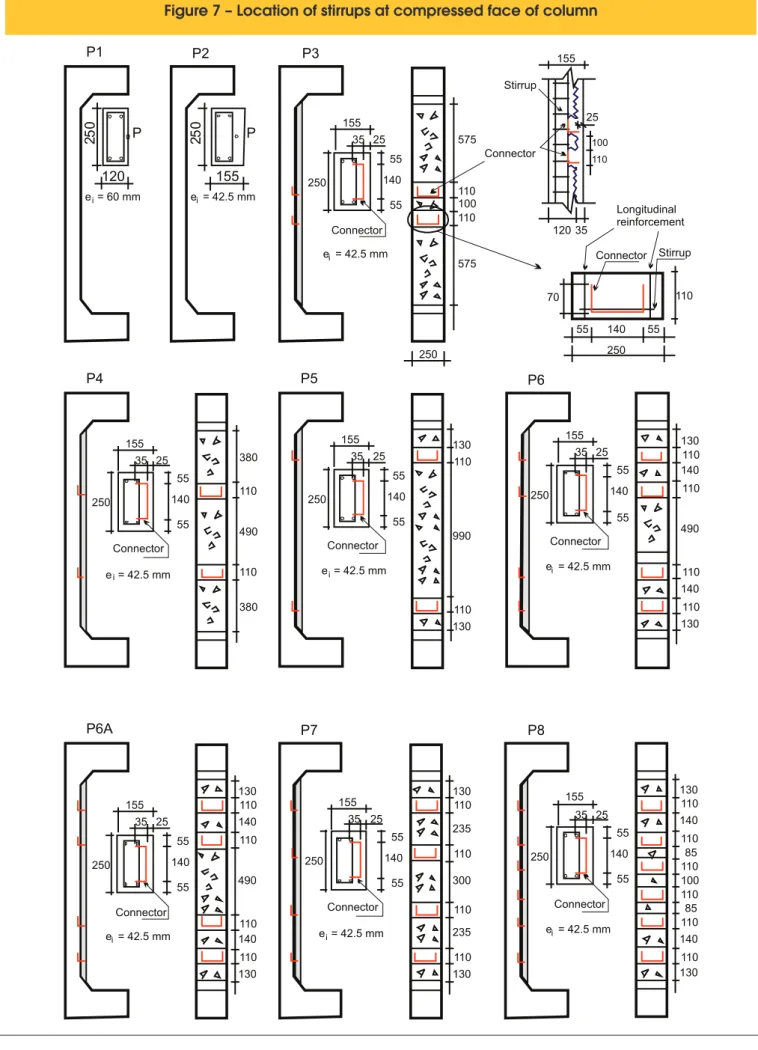
Figure 7 shows the location of connectors on the compressed face of each column. They are represented by an ongoing line and also show the thickness of the furrows and the distance between them. Furrowing was needed to uncover shear reinforcement, thus en-abling the connectors to be tied to the stirrups. The 110 mm wide furrows were accomplished with the use of electrical demolition hammer, manual hammer and metal pointer. With the stirrups in place (Figure 8), the concrete surface was cleaned and the sub -strate was wet in order to present a saturated dry surface. Struc-tural adhesives were not used for bonding the substrate and the strengthening concrete. Substrate scariication was carried out by spraying only sand all over the compressed face of all the strength-ened columns.
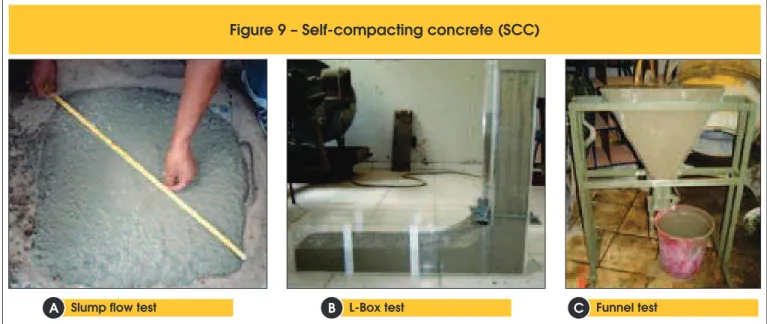
To the strengthening the columns, SCC was prepared to achieve an average compression strength of 30 MPa at 28 days. Table 1 shows the proportion of materials used to produce a cubic meter of concrete.
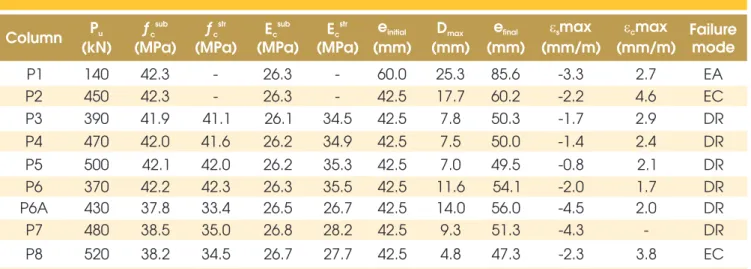
With regard to the slump low test, the EFNARC (2002) recom -mends that slump loow values ought to range from 650 to 800 mm. The concrete used to strengthen the columns showed slump low values of 760 and 750 mm for the irst and second castings, respectively (Figure 9). According to EFNARC (2002), the L-Box test should have a h2/h1 relation (height that concrete reaches at the edge of the L-box/height that concrete maintains at the beginning of the L-box) equal to 0.80.Dosed concrete revealed values ranging from 0.81 to 0.84 (irst and second castings, re -spectively). Gomes et al. (2003) show Lt20 values (reading of the
time concrete takes to reach a 20 cm marking on the L-box) rang -ing from 0.5 to 1.5 seconds and Lt40 values (reading of the time concrete takes to reach a 40 cm marking on the L-box) ranging from 2 to 3 seconds. The irst casting revealed Lt20 = 1 second
and Lt40 = 2.5 seconds, whereas the second casting marked Lt20
= 1 second and Lt40 = 3 seconds.
Regarding the V-Funnel 5 min, EFNARC (2002) establishes a limit ranging from 6 to 12 seconds and a difference between the irst and the second assays lower or equal to 3 seconds. The irst cast -cal to P6 and was made after a power outage had occurred in the
laboratory while performing tests on column P6.
Columns were cast horizontally and the tracing was dosed to achieve an average compressive strength value of 30 MPa at 28 days. The conventional concrete used was pumped from the concrete mixer to steel forms and mechanically compacted by an immersion vibrator (25 mm diameter). During casting, 36 cylindri -cal test samples measuring 150 mm x 300 mm were molded for concrete characterization. Tests assessed compression strength, tension by diametral compression and elasticity modulus. The col-umns and the test samples were submitted daily to wet curing and were covered with plastic canvas for seven days. After the seventh day, the columns were removed from the mould and placed in the laboratory until the date of the tests.
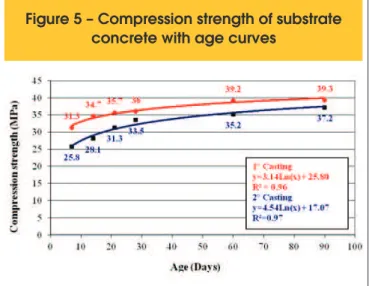
Figures 5 and 6 show the increase of the compressive strength of concrete with the age of conventional concrete used in substratum and the SCC used in reinforcement respectively.
The connectors were made from 5 mm diameter steel bars taken from the same steel batch used for the stirrups of the columns (Figure 5). With a total length of 350 mm, the bars were bent in the
Figure 4 – Stress-deformations curves
of 10 mm steel bars
Figure 6 – Concrete compression
strength of SCC with age curves
^
Figure 7 – Location of stirrups at compressed face of column
120
P
e = 60 mmi
25
0
P1
25
0
155
P
e = 42.5 mmi
P2
110 140110 130 130 490 110 140 110 110 380 490 110 380 110 140 110 130 130 490 110 140110 110 235 110 130 130 300 110 235 110 110 140 110 130 130 110 140 110 110 110 85 85 100 e = 42.5 mmi155 35 25 55 140 55 250 Connector 110 25 120 35 155 Stirrup 100 Connector
e = 42.5 mmi 155 35 25 55 140 55 250 Connector
e = 42.5 mmi 155 35 25 55 140 55 250 Connector e = 42.5 mmi
155 35 25 55 140 55 250 Connector
e = 42.5 mmi 155 35 25 55 140 55 250 Connector
e = 42.5 mmi 155 35 25 55 140 55 250 Connector
ing revealed 8 and 11 seconds for the irst and second tests, re -spectively, whereas the second casting revealed 7 and 10 seconds for the irst and second tests, respectively. The test arrangements consists of a metal porch anchored by tie bars connected to the strong slab. Figure 10 displays the arrangements of the test sys-tem used.
3. Results
This topic presents and analyses the main results obtained from tests and is divided into three sections: loads and failure modes, horizontal displacements of the columns and inally the strains measured in reinforcements and on the concrete’s face.
a) Load and failure mode
The original reference column P1 failed at 140 kN by steel yielding, whereas monolithic reference column P2 failed at 450 kN by
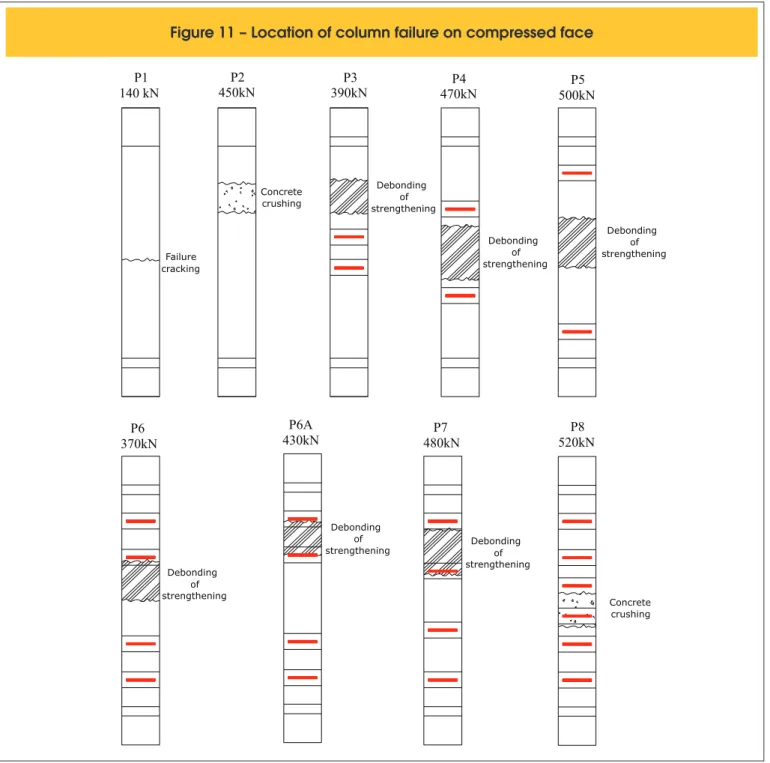
con-crete crushing. The remaining columns failed by concon-crete uncoat-ing, except column P8, which showed concrete crushing. Strength-ened columns P6 and P6A showed greater concrete strain than concrete crushing (3.5 mm/m - NBR and 3.0 mm/m - ACI), but af-ter uncoating. Table 2 shows failure loads, strengths and elasticity moduli of both substrate and strengthening concretes on the assay dates of each model, initial and inal eccentricities, maximum steel and concrete strains and failure modes of each column. Strength values of conventional and self-compacting concretes averaged 10% and 25%, respectively; they were higher for columns P1 to P6 than for columns P6A, P7 and P8. Figure 11 shows the location of the failure in each tested column.
The monolithic column P2 (155 mm x 250 mm) failed with a 450 kN load. This column was built to represent the maximum load capac-ity possible that reinforced columns could reach. The P8 column reinforced with the highest failure load, failed with a load 16% (Pu = 520 kN) greater than that of P2. A likely and possible small dif -ference in initial eccentricity could be one reason for the decrease
Figure 8 – Placement of reinforcement connectors
3
Table 1 – Proportion of substrate materials per m of concrete
Materials
Quantity (p/m )
Substrate
3Strengthening Concrete (SCC)
Quantity (p/m )
3Cement
310 kg
360 kg
Natural Fine – Coarse Sand
155 kg - 233 kg
730 kg - 0 kg
Artificial Sand
497 kg
-
Silica
-
31 kg
Grit 0 – 1
388 kg - 619 kg
930 kg - 0 kg
Water
155 l
223 l
Superplasticizer
-3.96 kg (1.1% on cement)
Set Retarder Additive
2.17 l
2.88 kg (0.8% on cement)
of failure load of Column P2. Figure 12 shows the horizontal dis -placements measured on the tensioned face of all columns (half height) and since the beginning of the tests till values close to failure (to prevent failure, the
dial indicators were removed before clear signs of rupture); column P2 showed larger dis-placements than that of the other columns. This result of column P2 cannot accurately indicate the expected capacity; however, along with columns P5 and P8, it shows proximity to the limit. Greater control of initial eccentricity is suggested for future tests.
In Table 2 and Figure 11 it is possible to see that not only the number of connectors but also their location inluence the fail -ure load of the models tested. It appears that, keeping the number of connectors constant and changing their position may produce considerable load in-crease, as what happened to the columns P3, P4 and P5. These were strengthened with a single pair of connectors which were progressively moved away from the centre. Column P3 re -vealed the lowest failure load of the three, whereas column P4 showed a 20% increase over P3 in failure load and column P5 had a 28% increase in relation to P3. It appears that the more
distant from the center, the greater was the failure load achieved. Despite the load increase, these three columns showed abrupt fail-ure due to uncoating of the strengthening concrete, when compared
with the original reference col-umn P1.
Due to the fact that column P5 - strengthened with a pair of connectors placed furthest from the centre of the column, as shown in Figure 7 - was the strongest of the columns re-inforced with only one pair of connectors, thus surpassing the load of monolithic refer-ence column P2 by 11%, and that column P6 had problems during assay by showing low failure load, we decided to cast three more columns. Column P6A had the same character -istics P6 did. As to columns P7 and P8, we decided to place a pair of connectors on the fur-thest positions from the cen-tre of the column and we also added another pair to P7 and two more pairs to P8.
When comparing columns P6A and P7, which were dif-ferentiated from each other by the location of the sec-ond pair of connectors, we observed that, unlike what we had seen on the columns strengthened with a single pair of connectors, there is an increase in failure load (12%)
Figure 9 – Self-compacting concrete (SCC)
Slump flow test
A B L-Box test C Funnel test
Figure 10 – Column test setup (mm)
Load cell
R 3
Load cell
Jack Column
Dial gauge
Strong floor 1000
1000 2000
220
as the second pair of connectors approaches the centre of the column. However, both columns failed abruptly by uncoating of the strengthening concrete.
Column P8, which had three pairs of connectors, revealed the greatest failure load of all the columns tested. Nevertheless, de-spite having two more pairs of connectors, the strength increase between P5 and P8 reached only 4%. The highest increase ob -tained by testing this model was a change in failure mode, from ductile failure to strengthening concrete crushing, similarly to the failure mode shown by monolithic reference column P2, thus meet-ing the central aim of this work.
b) Displacements
Figure 12 shows horizontal displacements that took place in the po-sition of the R3 dial indicator for all the columns tested. All strength-ened columns showed less inclined curves than reference columns P1 and P2, suggesting that strengthening results in smaller dis-placements. The original reference column P1 showed the biggest displacements, whereas strengthened column P8 had the smallest displacements.
Columns P3, P4 and P5 were strengthened with only a pair of con-nectors, placed in different positions. As shown in Figure 12, the location of the connector may inluence the horizontal displace-ment of the models used; the further the connector stands from the center (P5), the smaller the displacement on the loads near failure. Columns P6A and P7 with two pairs of connectors reveal (Figure 8) that the ability to move was increased in relation to the rein-forced columns with only one pair of connectors, letting P6A show a inal displacement close to the displacement shown by mono-lithic reference column P2. For this, reinforcement with two pairs of connectors, maintaining the irst pair of connectors in the same
position used in column P5 and varying the position of the second pair of connectors, reveals that the further away the second pair is from the center, the greater the displacement of the model.
c) Strains
Figure 13 shows load curves x strain of the reinforcement under the greatest tension of all the columns assayed. With the excep-tion of columns P2 and P5, face reinforcement was under tension on all the remaining columns; this tension was requested since the beginning of the test. For columns P2 and P5, the steel only began to be submitted to tension from 280 kN and 400 kN loads onwards, respectively. Of the reference columns, only column P1 reached steel yield strain value. Column P2’s curve shows a tendency to reach yield strength.
Columns P3, P4 and P5, strengthened with a single pair of con-nectors, failed to reach the reinforcement’s yield strain. As it can be observed in Figure 9, the closer to the centre the pair of connec-tors is, the greater the strains of the reinforcement on the tension column face. Columns P6A and P7, strengthened with two pairs of connectors, showed yielding of the tension face reinforcement. These columns show very similar strain values, but P6A shows the greatest strain. We observed that, by placing the irst pair of connectors in the position used in column P5 and then a second pair of connectors in an intermediary position in relation to the irst, strain values of the tensed reinforcement increase considerably. Furthermore, in case of using two pairs of connectors, the closer to the centre the second pair of connectors is, the lower the strain value produced by the tensed reinforcement; this is the opposite situation to that of columns with only a single pair of connectors. Column P8, which was strengthened with three pairs of connec -tors, showed a inal steel strain similar to that observed for
mono-Table 2 – Failure loads and modes of all columns
sub str
P : Failure load; ƒ and ƒ : Compression strength of substrate and strengthening concrete, respectively, on the day of failure u c c
sub str
testing; E e E : Elasticity modulus of substrate and strengthening concrete, respectively; ec c initial: Initial eccentricity; D : Maximum max
horizontal displacement; e : Final eccentricity = efinal initial + D ; max and max: Maximum strain of tension steel and of compressed max s c
concrete, respectively; ey = 2.42 mm/m: for ø = 10.0 mm; = 3.0 mm/m (ACI 318M-02); = 3.5 mm/m (NBR 6118/2003); EA: Steel u
yield; EC: Concrete crushing; DR: Uncoating of strengthening concrete; column P6 malfunctioned during tests and an analysis was performed for its replacement by P6A.
e e
e
Column
P
u(kN)
subƒ
c(MPa)
strƒ
c(MPa)
subE
c(MPa)
strE
c(MPa)
e
initial(mm)
D
max(mm)
(mm)
(mm/m)
(mm/m)
Failure
mode
P1
140
42.3
-
26.3
-
60.0
25.3
85.6
-3.3
2.7
EA
P2
450
42.3
-
26.3
-
42.5
17.7
60.2
-2.2
4.6
EC
P3
390
41.9
41.1
26.1
34.5
42.5
7.8
50.3
-1.7
2.9
DR
P4
470
42.0
41.6
26.2
34.9
42.5
7.5
50.0
-1.4
2.4
DR
P5
500
42.1
42.0
26.2
35.3
42.5
7.0
49.5
-0.8
2.1
DR
P6
370
42.2
42.3
26.3
35.5
42.5
11.6
54.1
-2.0
1.7
DR
P6A
430
37.8
33.4
26.5
26.7
42.5
14.0
56.0
-4.5
2.0
DR
P7
480
38.5
35.0
26.8
28.2
42.5
9.3
51.3
-4.3
-
DR
P8
520
38.2
34.5
26.7
27.7
42.5
4.8
47.3
-2.3
3.8
EC
lithic column P2. Similarly to this column, it failed to reach the steel yield strain.
Figure 14 shows load curves x concrete strain on all the columns assayed, with the exception of column P7; two strain gauges on this column located on the compressed face suffered damages. Strains were measured at mid-height on the compressed face of columns. The monolithic reference column P2 reached concrete crushing strain. Despite failing to reach concrete crushing values, column P1 showed a curve which followed this tendency.
Strains measured on the concrete of columns P3, P4 and P5, all strengthened with a single pair of connectors did not reach
con-crete crushing strength on the compressed face. In this case, re -sults show that the closer the pair of connectors is to the centre of the column, the greater the strain of the compressed concrete. Col -umn P6A, which was strengthened with two pairs of connectors, also failed to reach concrete crushing strength. Of all the strength-ened columns, only P8 showed concrete crushing strain (3.5 ‰).
4. Conclusions
All the strengthened models showed a reduction in horizontal dis -placements, which were measured at mid-height of the columns’
Figure 11 – Location of column failure on compressed face
P1
140 kN 450kNP2 390kNP3 470kNP4 500kNP5
P6
370kN 430kNP6A 480kNP7 520kNP8
Concrete crushing
Failure cracking
Debonding of
strengthening Concrete
crushing Debonding
of
strengthening Debondingof
strengthening
Debonding of strengthening Debonding
of strengthening Debonding
tension face, in contrast with the reference columns. This means that strengthening on the compressed face with the addition of concrete as well as the use of connectors on the strengthening concrete provided adherence between substrate and strengthen-ing concrete, which are differently aged. This contributed to column stiffening. Column P8 was strengthened with the highest number of connectors: three pairs were placed 105 mm, 300 mm and 550 m from the column centre. This column showed the smallest hori-zontal displacements at mid-height among all the models tested. As for the reference columns, the original column P1 reached strain of steel yield and although the monolithic column P2 had not reached
Figure 12 – Load - horizontal displacement curves (R3)
Figure 13 – Load - steel strain curves
Figure 14 – Load x concrete strain curves
the yield limit, it presented a curve tending to such occurrence. The columns reinforced with only one pair of connectors (P3, P4 and P5) did not reach strain of steel yield, therefore, the closer to the center the connectors were, the largest were the values of strain in the re-inforcement under tension. The columns reinforced with two pairs of connectors (P6A and P7) reached strain of steel yield. Column P8, reinforced with three pairs of connectors showed inal strain on the steel similar to that shown on monolithic column P2, and in the same way, had not reached strain of steel yield.
to concrete crushing. Of all strengthened columns, only P8, with three pairs of connectors, showed crushing strain.
All strengthened columns had their failure loads increased when compared to original reference column P1. The number and posi-tion of connectors inluenced loads and the failure mode of the models assayed. Columns with a single pair of connectors pre-sented higher failure loads than those columns whose pair of con-nectors was placed further from the centre. Column P3, whose connectors were closer to the centre (105 mm), failed at 390 kN, whereas P4, whose connectors were placed 300 mm from the cen-tre, failed at 470 kN. Column P5 had its pair of connectors placed 550 mm from the centre, and its failure load occurred at 500 kN. Columns P6A (Pu = 430 kN) and P7 (Pu = 480 kN), strengthened with
two pairs of connectors, had their outer pair of connectors placed 550 mm from the centre. The inner pair was located 300 mm from the centre in column P6A and 205 mm in column P7. These columns showed that, unlike columns strengthened with only one pair, there is an increase in failure load as the inner pair of connectors approaches the centre of the column (P7). The failure mode of these models also occurred abruptly due to uncoating of the strengthening concrete. Column P8, whose three pairs of connectors were placed 105 mm, 300 mm and 550 mm away from the centre, revealed the greatest failure load of all the columns tested. The failure load of column P8 was 1.15 times higher than that of column P2.
The results showed that the use of this type of connectors can be a viable option, providing a signiicant increase in failure load, in strains and in horizontal displacements. Spacing between con -nectors, positions and numbers of inappropriate connectors may, despite the possibility of increase in failure load, lead to sudden failures with displacement of the compressed section.
5. Acknowledgements
The authors gratefully acknowledge to CNPq and Procad/Capes for their inancial support. They also thanks to Carlos Campos Consultoria Limitada, Impercia and Realmix for providing materi-als and for performing material characterization tests.
6. References
[01] MELLO, E. L. Reinforced concrete: Limited resistance to lexure under combined bending and axial
compression loads. University of Brasilia Ed., FINATEC, Brasília, 2003. 224 p.
[02] ADORNO, A. L. C. Theoretical and experimental analysis of concrete columns and reinforced concrete columns under eccentric load. D.Sc. thesis,
Department of Civil and Environmental Engineering, University of Brasilia, Brasilia, DF, Brazil, 399p, 2004. (In Portuguese).
[03] ARAÚJO, L. M. B. Theoretical and experimental analysis of reinforced concrete columns subjected to axial load and lexure. M.Sc. thesis, Federal University of Goias, Goiânia, Brazil. 196p, 2004. (In Portuguese).
[04] NASCIMENTO, P. P. Reinforced concrete columns strengthened with carbon ibers and self-compacting concrete (CAA). 2006. 97f. UEG, Anápolis,
Goiás, 2006.
[05] OMAR, M. Y. M. Experimental analysis of reinforced concrete columns strengthened with self-compacting concrete (CAA). M.Sc. thesis, Federal University of Goias, Goiânia, Brazil. 266p, 2006. (In Portuguese). [06] SAHB, K. F. P. Experimental analysis of reinforced
concrete columns under eccentric load strengthened with self-compacting concrete (CAA) and anchor bolts. M.Sc. thesis, Federal University of Goias, Goiânia, Brazil. 224p, 2008. (In Portuguese).
[07] EUROPEAN FEDERATION FOR SPECIALIST CONSTRUCTION CHEMICALS AND CONCRETE SYSTEMS (EFNARC). Speciication and guidelines for self-compacting concrete. In: EFNARC.
February, 2002.
[08] GOMES, P. C. C. Optimization and Characterization of High-Strength Self-Compacting Concrete. 2002. 139f. D.Sc. Thesis, Universitat Politècnica de Catalunya, Barcelona, 2002.
[09] BRAZILIAN ASSOCIATION STANDARDS. NBR 6118:2003 – “Design of concrete structures”. Rio de Janeiro, 2004, (in Portuguese).