A Work Project, presented as part of the requirements for the Award of a Master Degree in Finance from Nova School of Business and Economics
Mutual Funds and Short Sales: A Performance Analysis.
Alice Isabel Manilhas Nunes, nº 2315
A Research Project carried out under the supervision of: Professor Melissa Prado
2 Abstract
Over the last decade there has been an increase in the use of short sales by mutual funds, however research on this phenomenon is still scarce. Previous empirical studies on traditional mutual funds provide evidence of a negative net performance but overall research on short sellers indicates the existence of skill. Thus, the question arises of whether mutual funds engaging in short sales are able to earn abnormal returns. Using detailed data on portfolio holdings, one shows that these mutual funds generate statistically significant annual abnormal returns of 4 and 3 percent in both their short and long positions, respectively.
3 1. Introduction
The mutual fund industry has experienced dramatic growth since 1965, rising at an average rate of 13% per year. However, in recent years, this industry has been put under pressure with the upsurge of cheaper competitors including separate accounts and ETFs. In the past year, investors shifted more than $300 billion from actively managed mutual funds into passive mutual funds and ETFs. Nonetheless, the industry is still dominated by traditional mutual funds and currently the US mutual fund industry is worth $16.08 trillion (October, 2016), distributed by more than 8,000 funds with roughly 40% of its assets belonging to domestic equity funds1.
As the mutual fund industry became bigger, it increasingly captured the attention of academic researchers. Past research has mainly focused on the performance of long-only mutual funds because, at the time, short selling was not allowed due to the economic and regulatory environment. Only recently, mutual funds started to allow alternative investment strategies such as the use of derivatives and short sales. According to Chen et al (2012), in 1994, only 24% of domestic equity mutual funds permitted the use of short sales. This proportion has increased drastically reaching 63% in 2009. Growing competition and relaxation of regulation are two of the main drivers of this change in mutual fund’s model of investing, which has been increasingly including the use of short sales.
Besides all the costs associated with short selling (long-short funds have an average annual fee of 2 percent compared to 1.3 percent for traditional funds), mutual funds that engage in this activity are also exposed to an unstable regulatory2 environment and increasing
disclosure demands. Given this framework, it becomes interesting to examine whether mutual funds are able to outperform based on their short positions.
1 “Trends in Mutual Fund Investing”, November 29, 2016, Investment Company Institute.
2 In 2008, the Securities and Exchange Commission (SEC) released a list with roughly 800 stocks that were no
4 In spite of short sales becoming an important component of mutual funds’ investment strategy, few studies have examined their characteristics and performance. Nonetheless, the scarce research on this subject signals the existence of skilled managers whom are able to outperform both on the long and short side of their portfolios, resulting in an overall portfolio that outperforms passive benchmarks.
The present study aims to analyze the characteristics and performance of mutual funds that use short sales. Specifically, one focuses on portfolio holdings to provide an overview of the characteristics of the stocks shorted by mutual fund managers and their ability to earn abnormal returns on the short portfolio. These results are also compared with the characteristics and performance of the long stocks and long portfolio, respectively, as skill is expected to be reflected in both sides. Besides estimating managers stock-picking skill one also measures their market timing ability, evaluating whether they are able to successfully predict market up and down turns. Furthermore, one provides a descriptive analysis of the characteristics of mutual funds that engage in short selling and measures abnormal performance using monthly fund returns to grasp the impact of operating costs on performance (not captured by portfolio holdings).
The current research is organized as follows. In the next section a brief overlook at previous literature on mutual fund performance and the use of short sales is presented. In Section 3 one describes the characteristics of the funds that engage in short sales and their stock holdings. Section 4 and 5 are dedicated to the performance analysis of mutual funds based on portfolio holdings and fund returns, respectively, and Section 6 concludes the report.
5 2. Literature Review
Mutual Fund performance has been vastly studied throughout the years. Although the literature on this topic is extensive, only recently academic researchers have investigated mutual funds that engage in short sales. This section briefly describes the existing literature on mutual fund performance including literature on holdings analyses and short sales.
2.1 Mutual Fund Performance
For many years, there has been a continuous discussion on whether mutual funds outperform passive benchmarks. In broad terms, it is accepted that, on average, mutual funds underperform market indexes by one percent per year (net of expenses). Mark Grinblatt and Sheridan Titman (1993) analyze quarterly portfolio holdings of mutual funds and find that some managers do have stock picking abilities, however this superior performance is captured by high fees and expenses. Daniel et al (1997) reach the same conclusion using a characteristic-based benchmark as a measure of performance. Moreover, Russ Wermers (2000) attributes this underperformance on a net-return level to the low average returns of nonstock holdings.
On the opposite side of the ongoing controversy, Barras, Scaillet and Wermers (2010) find evidence of positive or zero-alphas (net of expenses) on most actively managed funds. Additionally, Fama and French (2010) shed some light on equilibrium accounting stating that skilled managers might be hidden in the aggregate results by the performance of unskilled managers.
Besides stock-picking skill, superior performance may also be attributed to market timing skills. Treynor and Mazuy (1966) develop a model to measure managers market timing ability finding only one fund in a sample of 57 funds that was able to predict market trends. Henriksson and Merton (1981) and Daniel et al (1997) reach the same lack of market timing ability conclusion. On the other hand, Bollen and Busse (2001) are able to find evidence on the
6 existence of some managers with timing skills and criticize prior results for using an unfit data frequency.
Most of the literature referred above relies on multifactor models to estimate fund performance. Although there is some controversy around the best benchmark to evaluate mutual fund performance, it has been broadly shown that multifactor models have high explanatory power. The most used among them is Carhart’s Four-factor model developed by Carhart (1997) in the paper “On Persistence of Mutual Fund Performance”. The author adds an extra factor that captures the momentum anomaly to Fama and French’s (1993) Three-factor model, claiming that it improves the explanation on cross-sectional variation in stock returns.
2.2 Mutual Funds and Short Sales
Over the last decade, the decrease in regulation enabled mutual funds to engage in other investment strategies such as short selling, emerging the need to explore the performance of these new funds and compare it to the performance of traditional ones. Agarwal, Boyson and Naik (2009) address this issue finding that hedge mutual funds outperform traditional mutual funds. Huang and Wang (2013) extend this matter by analyzing hedge fund-like equity mutual funds during the 2007 financial crisis, concluding that short positions generate positive alphas even in down markets due to characteristic-adjusted and industry-adjusted stock selection skills. Lastly, Chen et al (2012) resort to portfolio holdings to split the funds into its long and short positions and evaluate their performance separately using a Fama-French-Carhart Four-factor time-series model. The authors’ results indicate that the average short and long portfolios earn, on average, an annual alpha of 4.1% and 1.5%, respectively. Chen et al (2012) also examine the characteristics of the stocks shorted by mutual funds, finding that these stocks have higher market capitalization, turnover and sales growth but lower book-to-market ratio and momentum compared to long stocks.
7 A vast number of empirical studies in this area rely on mutual fund portfolio holdings to evaluate fund performance. Several discuss whether analyzing mutual fund performance through portfolio holdings provides more accurate results than using fund returns. Among them, Daniel et al (1997), Wermers (2000), and Ferson and Khang (2002) all show that performance measures based on portfolio holdings have better statistical power in detecting mutual fund stock selection ability.
The present research contributes to the existing literature by providing a more recent look, based on a larger sample, to the performance of mutual funds that use short sales as it is a trading strategy only recently adopted by these funds and the subject is far from being exhausted.
3. Data and Descriptive Analysis
3.1 Characteristics of Mutual Funds that Engage in Short Sales
For the purpose of providing an overview of the overall characteristics of mutual funds that engage in short sales, one downloaded annual information on management fees, expense ratio, actual 12b-1 fees (marketing/distribution fees), total net assets (TNA), turnover ratio and fund objectives from CRSP mutual fund database. Data on quarterly portfolio holdings was also retrieved from the same database. The sample under analysis comprises the period from 2010 to 2015.
One focuses on actively managed domestic US equity funds, which were selected using CRSP objective code. Index funds, Exchange Traded Funds (ETF) and Exchange Traded Notes (ETN) were excluded for their passive nature. Fixed income and money market funds were also excluded due to their exposure to interest rate risk instead of market risk, which could affect the results. Then, only mutual funds that use short sales were kept for further analysis, that is, one kept only the funds that reported negative positions on their portfolio holdings. At this point
8 the sample under study includes 3,485 funds with a variety of investment objectives. The vast majority of these funds (more than 70%) correspond to growth, growth and income, small-cap and mid-cap funds (according to Lipper’s objective code).
The characteristics of the 3,485 portfolios, to which one will refer to as long-short funds hereafter, were obtained by aggregating the several fund classes as follows. Total net assets correspond to the net assets of the largest fund class and portfolio expenses, management fees, 12b-1 fees and turnover ratio correspond to a value-weighted average of the different fund classes. The resulting portfolios have on average $1,103 billion in total net assets, a turnover ratio of approximately 1 and operating expenses equal to 1.16% of total net assets. Compared to Chen et al (2012), one observes an increase in net assets but a decrease in all other indicators. Refer to Table 1 for more information on these long-short funds’ characteristics.
Table 1 – Characteristics of Long-Short Mutual Funds
Total Net Assets ($M) Turnover Ratio Expense Ratio (%) Management Fees (%) 12b-1 Fees (%) Mean 1,103 1.03 1.16 0.17 0.26 Median 205 0.55 1.13 0.70 0.25 N 2,634 1,456 1,736 1,775 164
This table reports the mean and median characteristics of mutual funds that engage in short sales in the period 2010 to 2015. Total Net Assets are in millions of dollars and correspond to the largest fund class in each portfolio. All other characteristics were aggregated through a weighted average across all fund classes. Expense ratio, management fees and 12b-1 fees are in percentage. N denotes the number of observations.
3.2 Characteristics of Stocks Held by Long-Short Mutual Funds
With the increase in the shorting activity along the years, it becomes interesting to examine whether funds short stocks with certain characteristics and if these differ from the characteristics of the stocks in which they go long. To address this issue one downloaded company fundamentals from CRSP/Compustat merged database as well as monthly stock returns from CRSP from January 2009 to December 2015 (effective dates). One kept only
9 actively managed domestic US equity mutual funds that engage in short sales, as explained in the previous section, and excluded all securities except for domestic stocks.
The resulting sample includes 330 long-short mutual funds with 3,915 shorted stocks and 5,092 long stocks. An initial brief overview indicates that the average portfolio shorts 35% of its overall holdings with an allocation of approximately 9% of total net assets to these positions. The remaining is allocated to the long side of the portfolio. Moreover, more than 60% of the stocks (both short and long) correspond to small-cap and mid-cap stocks which are more volatile but offer higher growth potential than large stocks (results not tabulated).
To extend the analysis one used the information on company fundamentals and stock returns to study stocks regarding size, turnover, momentum, book-to-market ratio, sales growth and price-earnings ratio. Every year, one identifies all the shorted and long stocks and calculates the respective characteristics at the end of December. To be more clear, the characteristics of the stocks shorted during 2010 are calculated based on the information from the previous year, 2009. The same applies to the long stocks. Each year a stock is included only once, independently of how many funds hold a position.
The characteristics were calculated as follows. Market value of equity corresponds to the share price at the end of each year times the number of shares outstanding. Book value of equity is the difference between total assets and total liabilities. Earnings per share correspond to net income divided by shares outstanding and are used to compute price-earnings ratio. Sales growth is the growth in net sales in the previous year and momentum is the raw buy and hold return of the previous 11 months. Finally, turnover corresponds to the ratio between annual trading volume and average shares outstanding. To compare the stocks in the short and long portfolios one uses Welch’s t-test which is a two-sided test for the null hypothesis that two
10 independent samples have equal means. The null hypothesis is rejected for p-values lower than 0.05 assuming a confidence level of 95%. All the statistics are reported below in Table 2.
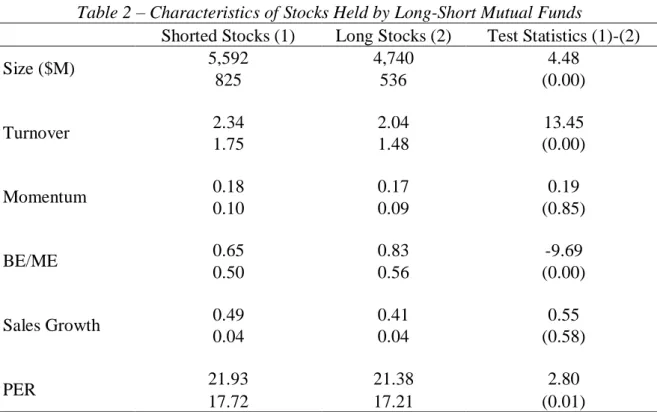
Table 2 – Characteristics of Stocks Held by Long-Short Mutual Funds
Shorted Stocks (1) Long Stocks (2) Test Statistics (1)-(2)
Size ($M) 5,592 4,740 4.48 825 536 (0.00) Turnover 2.34 2.04 13.45 1.75 1.48 (0.00) Momentum 0.18 0.17 0.19 0.10 0.09 (0.85) BE/ME 0.65 0.83 -9.69 0.50 0.56 (0.00) Sales Growth 0.49 0.41 0.55 0.04 0.04 (0.58) PER 21.93 21.38 2.80 17.72 17.21 (0.01)
This table reports the mean and median values of the characteristics of stocks that are held both in the short and long portfolios for the sample of domestic equity long-short funds between 2010 and 2015. The characteristics are as of Decembert for all the positions held
from Januaryt+1 to Decembert+1. Every year a stock is included only once. Size corresponds
to the market value of equity in millions of dollars. Turnover is the annual share turnover from Januaryt to Decembert. Momentum is the holding period return over the previous 11
months, that is, from Januaryt to Novembert. BE/ME in year t corresponds to the ratio
between book equity for the fiscal year t-1 and market capitalization at the end of year t-1. Sales growth is the growth in net sales in the previous year. PER is the price-earnings ratio calculated as the share price divided by earnings per share (outliers such as negative values and values above 100 were excluded from the analysis). The last column reports the t-values and p-values (in parentheses) for differences in mean using Welch's t-test.
The information in Table 2 indicates that stocks in the short portfolio have a book-to-market ratio (BE/ME) significantly lower than stocks in the long portfolio, as well as a higher price-earnings ratio, implying that mutual funds tend to short stocks that may be overvalued. Momentum and sales growth are not significantly different between the stocks in the short and long portfolios, although shorted stocks present a higher value in both characteristics. The shorted stocks also tend to be larger (higher market capitalization/size) than long stocks. The mean market capitalization of shorted stocks is $5,592 million and is significantly higher than
11 the mean equity value of $4,740 million of stocks in the long portfolio. Regarding turnover, one can conclude that the stocks in the short portfolio are on average more liquid than the stocks in the long portfolio, with a mean turnover of 2.3 compared to a mean turnover of 2 (statistically significant difference in mean). This result is consistent with short sellers’ desire to minimize the likelihood of a short squeeze, choosing stocks that are easily tradable and have a large supply of shares.
Overall, these statistics suggest that managers’ decisions on which positions to establish are correlated with the information provided by fundamentals, namely valuation and earnings indicators.
4. Performance Analysis Based on Portfolio Holdings
4.1 Stock-Picking Ability - Methodology
This section is dedicated to the performance analysis of long-short mutual funds based on quarterly portfolio holdings and monthly stock returns from CRSP in the period 2010-2015. Estimating abnormal performance based on portfolio holdings has some advantages over using monthly fund returns. First, it mitigates the impact of fund expenses and other securities (rather than stocks) by focusing on the returns of the stocks held by the long-short funds. Second, the use of portfolio holdings enables a separate analysis of the short and long portfolios, that can indicate whether managers’ potential skill is manifested in both. These advantages allow for a more accurate stock-picking ability measurement.
The benchmark used to estimate abnormal returns was Fama-French-Carhart Four-factor time-series model (Carhart, 1997) which is an extension of the Fama and French (1993) Three-factor model through the addition of a momentum factor. Multifactor models present some limitations, namely their inability to predict future performance and to capture all the important nuances of a strategy. Nonetheless, these models are broadly accepted and used in the literature when estimating abnormal performance. The model can be written as follows:
12 𝑅𝑝,𝑡− 𝑅𝑓,𝑡= 𝛼𝑝+ 𝛽1𝑝𝑀𝑅𝑃𝑡+ 𝛽2𝑝𝑆𝑀𝐵𝑡+ 𝛽3𝑝𝐻𝑀𝐿𝑡+ 𝛽4𝑝𝑀𝑂𝑀𝑡+ 𝑒𝑖,𝑡 (1) Where 𝑅𝑝,𝑡 is the monthly return of portfolio 𝑝 in month 𝑡, 𝑅𝑓,𝑡 is the risk-free rate (one-month Treasury Bill) in month 𝑡 and MRP, SMB, HML and MOM correspond to Carhart’s four factors and denote the excess return on the market (market risk premium), the spread in returns between small and large-cap stocks (small minus big), the spread in returns between value and growth stocks (high minus low) and momentum, respectively. The exposures of the portfolios to the risk factors are captured by 𝛽1, 𝛽2, 𝛽3 and 𝛽4 and 𝑒𝑖,𝑡 is the random error. Using this regression, one is intrinsically assuming that the variability in returns is explained by the four factors, thus, any abnormal return will be captured by the constant in the model (𝛼𝑝), which is called alpha. Alpha informs investors whether a certain fund offers something other than just a combination of exposures to risk factors that can be easily replicated or obtained with low-cost index funds. If the fund’s alpha is positive than the fund manager exhibits stock-picking skills.
Historical data on the independent variables was obtained from Kenneth French’s website3 and merged with the portfolio returns database. In order to complete the performance
analysis, holdings were split between the long and short portfolios. Monthly portfolio returns correspond to a weighted average of stock returns where the weights equal the position (in dollars) held on each stock divided by the total value invested in the corresponding portfolio. The value of each position is calculated as the price of each stock at the end of the month times the number of shares held. The total value invested per portfolio is the sum of the value of all the positions it holds. Please note that the weights in the short portfolio are negative by definition.
As only quarterly data is available, one assumes a constant portfolio composition within each quarter, updating the holdings every three months. Additionally, one requires at least
3 We thank Kenneth French for making the returns data on the four factors and risk-free rate available on his
13 twenty-four months of non-missing portfolio returns in order to enable a reliable estimation. This reduces the sample under analysis from 330 to 144 portfolios.
Finally, each monthly portfolios’ returns were regressed in Carhart’s four factors across the whole sample period.
4.2 Stock-Picking Ability – Results
Table 3 summarizes the cross-sectional mean of the regression coefficients. Please note that a negative alpha in the short portfolio corresponds to a positive abnormal performance as the weights in the short portfolio are negative. The same interpretation should be applied to the other regression coefficients.
Table 3 – Long-Short Mutual Funds Performance Based on Portfolio Holdings
Alpha (%) MRP SMB HML MOM Adj. R2 #Obs. #Port.
Short Portfolio -0.348** -1.037** -0.408** 0.029 0.143** 0.57 5,092 144 (0.000) (0.000) (0.000) (0.426) (0.000)
Long Portfolio 0.276** 1.009** 0.182** -0.041 -0.062** 0.72 5,747 144 (0.000) (0.000) (0.000) (0.071) (0.000)
This table reports the cross-sectional mean of the regression coefficients of the long and short portfolios' returns on Carhart’s four factors, across the sample period 2010-2015 for mutual funds that engage in short sales. Abnormal returns are in percentage and a negative alpha in the short portfolio is indicative of outperformance. The last two columns refer to the number of observations and number of portfolios in each sample. The values in parentheses correspond to the p-values and ** and * denote statistical significance at the 1 and 5 percent levels, respectively. All regression coefficients are tested against the null hypotheses of being equal to zero, except for the MRP which is tested against the hypotheses that beta equals one.
The results indicate that both the short and the long portfolios outperform the passive benchmark earning a statistically significant monthly abnormal return of 0.348% and 0.276%, respectively. This translates into an annual abnormal performance of approximately 4% and 3%. These abnormal returns provide evidence of manager’s ability to pick the right stocks, that is, the stocks whose returns will drop and increase in the near future for the short and long portfolios, respectively. This is consistent with Chen et al (2012) that reported an abnormal performance of 4.1% annually for the short portfolio. The authors find a smaller performance
14 of 1.5% per year for the long portfolio. Nonetheless, the results obtained provide evidence that managers are skilled and that this skill is reflected both in the long and short positions.
In Table 3 one can also observe the different exposures to the risk factors, verifying that the long and short portfolios both provide negative exposures to momentum and value premium strategies. The last suggests a preference for growth stocks as opposed to value stocks. Although the exposures of both portfolios to the risk factors are similar, one notices that the short portfolio holds a higher exposure to the momentum and size factors which is consistent with the stocks characteristics found in the descriptive analysis where shorted stocks presented a higher market capitalization compared to long stocks. A further analysis of the risk factors exposures indicates a slight preference by managers to short bigger and high price-earnings stocks (growth stocks). This is consistent with Fama-French’s findings that, on average, small stocks earn higher returns than larger stocks (called the “small firm effect”) and value stocks outperform growth stocks.
4.4 Market Timing Ability – Methodology and Results
The previous results indicate that managers of long-short mutual funds have stock-picking abilities. It becomes interesting to test if they also have market timing skills, that is, if managers are able to increase the fund’s exposure to market risk previous to up markets and decrease it otherwise. Previous literature on this topic was developed in the context of only mutual funds, thus, one pretends to determine whether the same conclusions hold for long-short mutual funds.
One follows Henriksson and Merton (1981) to measure managers’ ability to time the market. The authors model was initially developed using the traditional CAPM model and is defined as follows:
15 Where 𝑅𝑖,𝑡− 𝑅𝑓,𝑡 is the excess return of fund 𝑖, 𝑀𝑅𝑃𝑡 is the excess return on the market and 𝑌𝑡 is the maximum between zero and the value of the market risk premium in each month. A statistically significant and positive 𝛾𝑖 indicates that portfolio managers are able to time the market. One adapted this model to Carhart’s four-factor model and used it to estimate the market timing ability of portfolio managers both in the long and short portfolios:
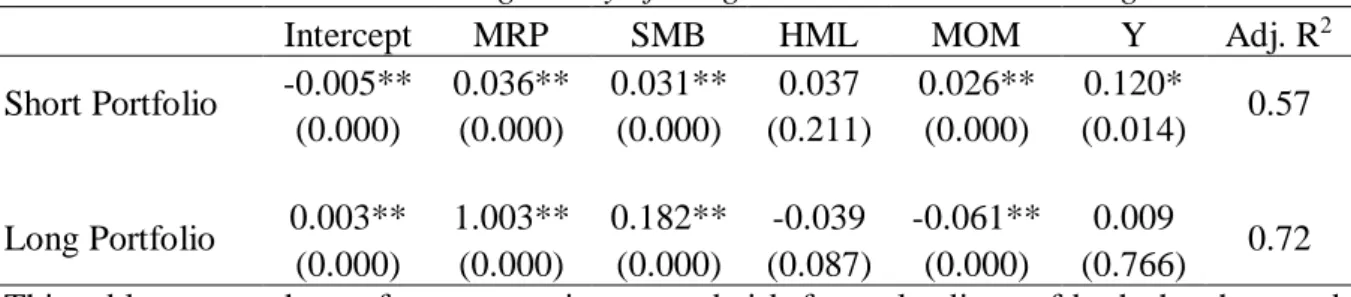
𝑅𝑝,𝑡 − 𝑅𝑓,𝑡 = 𝛼𝑝+ 𝛽1𝑝𝑀𝑅𝑃𝑡+ 𝛽2𝑝𝑆𝑀𝐵 + 𝛽3𝑝𝐻𝑀𝐿 + 𝛽4𝑝𝑀𝑂𝑀 + 𝛾𝑖𝑌𝑡+ 𝑒𝑖,𝑡 (3) The results in Table 4 indicate that managers do not increase their exposure to market risk in up turns neither decrease it in down turns in the long portfolio, thus showing no statistically significant evidence of timing skills. On the other hand, the statistically significant coefficient of 0.120 (negative interpretation due to negative weights) found in the short portfolio suggests managers’ inability to time the market, failing to increase their exposure when market returns are about to increase. However, they do have selection skills as indicated in the results from the previous section. This outcome is consistent with most prior studies where authors find overall poor timing skills by managers and also a negative correlation between selection and timing abilities.
Table 4 - Market Timing Ability of Long-Short Mutual Fund Managers
Intercept MRP SMB HML MOM Y Adj. R2
Short Portfolio -0.005** 0.036** 0.031** 0.037 0.026** 0.120* 0.57 (0.000) (0.000) (0.000) (0.211) (0.000) (0.014)
Long Portfolio 0.003** 1.003** 0.182** -0.039 -0.061** 0.009 0.72 (0.000) (0.000) (0.000) (0.087) (0.000) (0.766)
This table reports the performance estimates and risk factor loadings of both the short and long portfolios obtained using equation (3). The regression coefficient corresponding to Y measures the timing ability of portfolio managers. P-values are in parenthesis and ** and * denote statistical significance at the 1 and 5 percent levels, respectively.
4.5 Robustness of Results
In order to test the robustness of ones’ results to model misspecification concerns, the estimation described in Section 4.1 was performed using four alternative models – the Market
16 model, Fama-French Three-factor model, Pastor and Stambaugh (2001) Liquidity-augmented4 model and Fama-French (2016) Five-factor5 model.
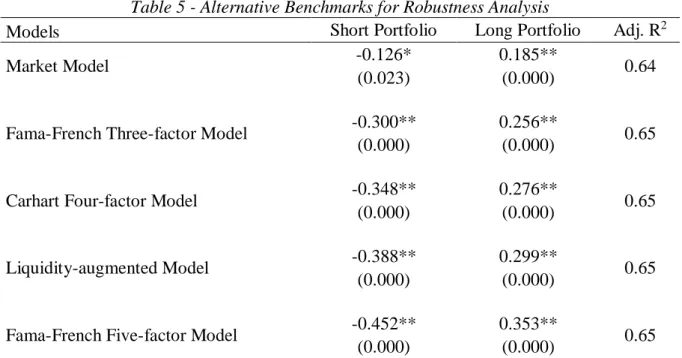
As can be observed in Table 5, potential concerns on superior selectivity performance of long-short mutual funds caused by model misspecification are mitigated as all models present similar statistically significant abnormal returns both in the long and short portfolios. The Market, Three-factor, Liquidity-augmented and Five-factor models suggest that the average short portfolio earns a positive monthly abnormal return of 0.13%, 0.30%, 0.39% and 0.45%, respectively. Furthermore, in all models, the short portfolio earns a higher alpha than the long portfolio and both outperform the passive benchmark. In addition, the adjusted R-squared indicates similar explanatory power across the five models.
Table 5 - Alternative Benchmarks for Robustness Analysis
Models Short Portfolio Long Portfolio Adj. R2
Market Model -0.126* 0.185** 0.64
(0.023) (0.000)
Fama-French Three-factor Model -0.300** 0.256** 0.65
(0.000) (0.000)
Carhart Four-factor Model -0.348** 0.276** 0.65
(0.000) (0.000)
Liquidity-augmented Model -0.388** 0.299** 0.65
(0.000) (0.000)
Fama-French Five-factor Model -0.452** 0.353** 0.65
(0.000) (0.000)
This table presents the cross-sectional mean of monthly abnormal returns (alpha in %) obtained using alternative model specifications for the sample of 144 portfolios. Both short and long portfolios' excess returns were regressed on the selected risk factors. We require at least 24 months of non-missing returns for the estimation. In the short portfolio, a negative abnormal return is translated into outperformance due to the negative portfolio weights. The last column presents the mean adjusted R-squared of each model. P-values are in parentheses and ** and * denote statistical significance at the 1 and 5 percent levels, respectively.
4 The Liquidity-augmented model adds to Fama-French Three-factor model by including a factor that captures the
fact that stocks with high sensitivity to liquidity outperform those with low sensitivity. Data on the liquidity factor was retrieved from Lubos Pastor’s Web site: http://faculty.chicagobooth.edu/lubos.pastor/research/.
5 The Five-factor model additional two factors (compared to the Three-factor model) capture profitability and
investment patterns in average stock returns, given the findings that stocks with a high operating profitability and low total asset growth (low investment) perform better. Data was retrieved from Kenneth French’s Web site.
17 5. Performance Analysis Based on Monthly Fund Returns
5.1 Estimation of Abnormal Returns - Methodology and Results
To complement the performance analysis, one estimated abnormal returns of long-short mutual funds based on monthly fund returns retrieved from CRSP in the period 2010-2015. This allows to include the effect of monthly changes in portfolio composition and grasp the impact of operating expenses in abnormal returns.
Fund returns from CRSP are net of expenses and using these returns to estimate abnormal performance may lead to unreliable results as the passive benchmark ignores the costs incurred by actively managed mutual funds. Even so, some researchers defend that performance should be measured using net returns as it corresponds to what investors actually earn. One analyzes fund performance based on both net and gross returns, hoping to provide some reasoning on whether managers are able to produce abnormal returns and if these are sufficient to cover the fund’s operating expenses.
Following Fama and French (2010), gross monthly returns were obtained by adding back an estimation of the monthly expense ratio to the monthly net returns. The estimated monthly expense ratio corresponds to the annual reported expense ratio divided by 12. Portfolio returns correspond to the return of the largest fund class in terms of net assets. In order to enable a reliable estimation, one requires seventy-two months of non-missing returns for each portfolio, including only funds with information for the whole sample period. This results in a sample of 872 portfolios.
Monthly abnormal returns were estimated for each portfolio by regressing the monthly portfolio returns on Carhart’s four factors, described in Section 4.1. The cross-sectional mean of the regression coefficients is presented in Table 6.
18 Table 6 - Performance of Long-Short Mutual Funds Based on Monthly Fund Returns
Alpha (%) MRP SMB HML MOM Adj. R2
Gross Returns (N=872) -0.035** 0.941** 0.235** -0.029** -0.013** 0.72 (0.001) (0.000) (0.000) (0.000) (0.002)
Net Returns (N=872) -0.133** 0.941** 0.234** -0.029** -0.013** 0.72 (0.000) (0.000) (0.000) (0.000) (0.002) This table reports the mean monthly abnormal return of 872 long-short mutual funds from 2010 to 2015. One regressed the monthly returns of each fund, before and after expenses, on Carhart’s four factors, reporting the cross-sectional mean of the regression coefficients. P-values are presented in parentheses and ** and * denote statistical significance at the 1 and 5 percent levels, respectively. All regression coefficients are tested against the null hypotheses of being equal to zero, except for the MRP which is tested against the hypotheses that beta equals one.
Contrary to Chen et al (2012), results suggest that mutual funds using short sales between 2010 and 2015 underperform the passive benchmark both before and after expenses. The mean monthly alpha of the long-short funds is -0.035% and -0.133% using gross and net returns, respectively. This translates into a negative average annual gross performance of 0.42% and a net performance equal to -1.59% per year. Given that the net average annual performance reported in the literature for traditional mutual funds is -1%, one may conclude that in net terms long-short mutual funds not only underperform the passive benchmark but also underperform the traditional long-only mutual funds.
Although on average long-short funds underperform, this does not mean that some of them do not have positive alphas, on the contrary, using gross returns one finds 358 mutual funds in-sample with statistically significant positive alphas. However, this outperformance is hidden in the aggregated results by the 514 underperforming funds.
The performance outcome obtained using fund returns is not consistent with the one obtained based on portfolio holdings. Even though empirical studies refer to a gap between fund returns and returns built using portfolio holdings, such a substantial discrepancy was not expected. This may be caused by some peculiarity of the sample period or sample mutual funds studied. It could also be explained by mutual funds’ unreported activities such as security
19 lending. Nevertheless, explaining the reason behind this gap is out of the scope of this research. Furthermore, fund returns include returns from assets such as derivatives, bonds, which may lead to inaccurate results given that the model used was developed for common stocks. To further explore this issue, one followed Dass, Nanda and Wang (2013) and included an additional risk factor for bonds which corresponds to the total return of the Barclays Aggregated Bond Index, retrieved from Morningstar. Although the coefficient of the additional factor is statistically significant (results not tabulated), a similar alpha was obtained using this five-factor model compared to the Four-factor model. Given the strain to control for other factors6 that may be affecting the accuracy of the results and keeping in mind the focus of this paper, one continues the analysis and leaves this discussion to future research.
To mitigate model misspecification, one tested the robustness of the results using the four alternative benchmarks described in section 4.5 and obtained similar statistically significant abnormal returns in all models (results not tabulated).
4.2 Influence of Fund Characteristics on Performance
In a recent study, Kacperczyk and Seru (2007) found evidence of a relation between abnormal returns and fund size, expense ratios and turnover. Carhart (1997) also reported a negative relation between net performance and expense ratios. On this note, one conducts a cross-sectional analysis with the intuit of measuring the marginal effect of the three above-mentioned characteristics on abnormal performance. Following Carhart (1997), one starts by obtaining alphas for each fund in each month through a rolling regression using the previous 24 observations and equation (1). Then one estimates the following regression using Fama-MacBeth (1973) estimator7:
6 Fung-Hsieh (2004) Seven-factor model includes factors for commodities, currencies and bonds, however the
author only has data available until 2012, thus only covering the beginning of the sample under analysis.
7 Fama and MacBeth (1973) estimator involves two steps: estimating the cross-sectional relation each month and
then obtaining the average of the coefficients across the sample period. The command xtfmb in stata was used to complete this procedure.
20 𝛼𝑖𝑡 = 𝑐𝑡+ 𝑏1𝑡ln 𝑇𝑁𝐴𝑖𝑡−12+ 𝑏2𝑡𝑇𝑢𝑟𝑛𝑖𝑡−12+ 𝑏3𝑡𝐸𝑥𝑝𝑖𝑡−12+ 𝜀𝑖𝑡 (4)
Where 𝛼𝑖𝑡 is the abnormal return of fund 𝑖 in month 𝑡, ln 𝑇𝑁𝐴𝑖𝑡−12 is the natural logarithm of total net assets, 𝑇𝑢𝑟𝑛𝑖𝑡−12 is the turnover of fund 𝑖 and 𝐸𝑥𝑝𝑖𝑡−12 is the expense ratio of fund 𝑖, both in month 𝑡 − 12. Monthly expense ratios and turnover were obtained by dividing the respective annual value by 12. Total Net Assets were assumed to be the same across all months within the same year. All independent variables were lagged one year to avoid spurious correlation. The sample comprises 840 portfolios in the period 2010 to 2015.
The results presented in Table 7 confirm that fund size, expense ratio and turnover are in fact related to the funds’ abnormal performance as all coefficients are statistically significant at the 5% level, based on net returns. However, fund size and turnover have almost a null impact on alpha, that is, increasing or decreasing fund size will not improve the fund’s performance and increasing the fund’s turnover will increase performance only by a negligible amount (an increase in turnover of 1 percentage point will increase monthly alpha in 0.001 percentage points). On the other hand, expense ratio has a big impact on alpha, with a coefficient of -1.145 (based on net returns) indicating that an increase of 1 percentage point in the expense ratio will lead to a drop of 1.145 percentage points in the portfolio’s monthly abnormal net return. The information based on gross returns provides a similar interpretation except for the expense ratio which is no longer significant, as should be expected. These results are similar to the ones obtained by Carhart (1997) and Kacperczyk and Seru (2007).
Moreover, the relation between portfolios’ abnormal returns, turnover and expense ratio suggests the inability of mutual funds to recover their investment costs through higher returns, that is, increasing turnover will increase costs and the negative impact of these costs in abnormal returns surpasses the positive impact of a higher turnover.
21 Table 7 - Influence of Fund Characteristics on Performance
Independent Variables Based on Gross Returns Based on Net Returns
Intercept -0.002** -0.002** (0.000) (0.000) Ln (TNA) 0.000** 0.000** (0.000) (0.000) Turnover 0.001** 0.001** (0.001) (0.001) Expense Ratio -0.157 -1.145** (0.072) (0.000) #Obs. 40,320 40,320 R2 0.013 0.026
This table reports the impact of net assets, turnover and expense ratio on portfolios' abnormal returns. One regressed rolling monthly alphas in the characteristics above using Fama-MacBeth estimator. Columns 2 and 3 report the average coefficients across the whole sample and sample period using alpha based on gross returns and net returns, respectively. P-values are presented in parenthesis and ** and * denote statistical significance at the 1 and 5 percent levels, respectively.
6. Conclusion
The mutual fund industry has been growing since 1965 being worth 16 trillion dollars as of October, 2016. This substantial growth has been accompanied by a vast literature on actively managed mutual funds’ performance, having most studies concluded that these funds are not able to generate abnormal returns sufficient to cover the operating expenses supported by investors.
Over the past decade, mutual funds started to follow other investment strategies such as short selling. Since then, the number of funds engaging in short sales has been increasing. Given previous findings that short sellers are skilled, it becomes interesting to analyze if mutual fund managers that engage in short sales are able to generate abnormal returns.
22 In this study one finds evidence that most funds, on average, invest in mid-cap and small-cap stocks, shorting stocks which are larger, more liquid and potentially overvalued compared to the long stocks.
A deep analysis based on the portfolio holdings of 144 long-short mutual funds between 2010 and 2015 shows that fund managers have stock picking skills, being able to generate, on average, statistically significant and economically large abnormal returns (roughly 4% per year) through their short positions. Moreover, this skill is also reflected in the long portfolio, where managers are able to earn an abnormal return of 3% per year. This result is robust to several alternative performance measure benchmarks.
Abnormal performance can also be the result of market timing. However, one’s analysis has shown poor timing skills from long-short mutual fund managers in the short portfolio and no evidence of timing skills in the long portfolio which suggests that managers do not time the market and when they do, they are not successful.
To include the effect of fund expenses, one measures performance based on monthly fund returns reaching the conclusion that long-short mutual funds do not generate sufficient abnormal returns to cover operating expenses. This may be explained by the strong negative relation between abnormal returns and expense ratios and the fact that long-short mutual funds incur in substantial costs associated with short selling.
One also finds a considerable gap between the abnormal returns obtained with portfolio holdings and the ones obtained based on fund returns, which is expected to occur but not with such magnitude. The reason behind this outcome is out of the scope of this research, thus one leaves it open to future studies.
Overall, the evidence suggests that engaging in short sales is a reliable indicator of managers’ skill. Nonetheless, to further test this claim it would be interesting to investigate whether the fund managers of long-short mutual funds are also able to earn statistically
23 significant abnormal returns in other funds were short sales are not allowed or used. Additionally, it would be of value to extend the analysis to a larger sample period.
7. References
Agarwal, V., Boyson, N.M. and Naik, N.Y., 2009. “Hedge funds for retail investors? An examination of hedged mutual funds.” Journal of Financial and Quantitative Analysis, 44(02): 273-305.
Barras, L., Scaillet, O. and Wermers, R., 2010. “False discoveries in mutual fund performance: Measuring luck in estimated alphas.” The Journal of Finance, 65(1): 179-216.
Blake, C.R., Elton, E.J. and Gruber, M.J., 1993. “The performance of bond mutual funds.” Journal of business, 371-403.
Bollen, N.P. and Busse, J.A., 2001. “On the timing ability of mutual fund managers.” The Journal of Finance, 56(3): 1075-1094.
Carhart, M.M., 1997. “On persistence in mutual fund performance.” The Journal of finance, 52(1): 57-82.
Chen, H., Desai, H. and Krishnamurthy, S., 2013. “A first look at mutual funds that use short sales.” Journal of Financial and Quantitative Analysis, 48(03): 761-787.
Daniel, K., Grinblatt, M., Titman, S. and Wermers, R., 1997. “Measuring mutual fund performance with characteristic‐based benchmarks.” The Journal of finance, 52(3): 1035-1058. Fama, E.F. and MacBeth, J.D., 1973. “Risk, return, and equilibrium: Empirical tests.” The journal of political economy, 607-636.
Fama, E.F. and French, K.R., 1993. “Common risk factors in the returns on stocks and bonds.” Journal of financial economics, 33(1): 3-56.
Fama, E.F. and French, K.R., 2010. “Luck versus skill in the cross‐section of mutual fund returns.” The journal of finance, 65(5): 1915-1947.
24 Fama, E.F. and French, K.R., 2016. “Dissecting anomalies with a five-factor model.” Review of Financial Studies, 29(1): 69-103.
Ferson, W. and Khang, K., 2002. “Conditional performance measurement using portfolio weights: Evidence for pension funds.” Journal of Financial Economics, 65(2): 249-282.
Fung, W., and Hsieh, D. A., 2004. “Hedge Fund Benchmarks: A Risk-based Approach.” Financial Analysts Journal, 60(5): 65-80.
Henriksson, R.D. and Merton, R.C., 1981. “On market timing and investment performance. II. Statistical procedures for evaluating forecasting skills.” Journal of business, 513-533.
Huang, J.Z. and Wang, Y., 2013. “Should investors invest in hedge fund-like mutual funds? Evidence from the 2007 financial crisis.” Journal of Financial Intermediation, 22(3): 482-512.
Kacperczyk, M. and Seru, A., 2007. “Fund manager use of public information: New evidence on managerial skills.” The Journal of Finance, 62(2): 485-528.
Grinblatt, M. and Titman, S., 1993. “Performance measurement without benchmarks: An examination of mutual fund returns.” Journal of Business, 47-68.
Pastor, L. and Stambaugh, R.F., 2001. “Liquidity risk and expected stock returns.” National Bureau of Economic Research.
Wermers, R., 2000. “Mutual fund performance: An empirical decomposition into stock‐ picking talent, style, transactions costs, and expenses.” The Journal of Finance, 55(4):1655-1703.
Treynor, J. and Mazuy, K., 1966. “Can mutual funds outguess the market.” Harvard business review, 44(4):131-136.