i
Multivariate Data Analysis for Monitoring the
Quality of the Commercialized Bottled Water in
Bangladesh
K.M.Mostafa Anwar [M2013491]
Dissertation presented as partial requirement for obtaining
the Master’s degree in Statistics and Information
i Multivariate Data Analysis for Monitoring the Quality of the
Commercialized Bottled Water in Bangladesh
K.M.Mostafa Anwar
MEGI
2 0 1 8iii
NOVA Information Management School
Instituto Superior de Estatística e Gestão de Informação
Universidade Nova de Lisboa
MULTIVARIATE DATA ANALYSIS FOR MONITORING THE QUALITY
OF THE COMMERCIALIZED BOTTLED WATER IN BANGLADESH
by
K.M.Mostafa Anwar [M2013491]
Dissertation presented as partial requirement for obtaining the Master’s degree in Information Management, with a specialization in Analysis and Information Management
Advisor : Prof.Dr.Paulo Jorge Mota Pinho Gomes
iv
DEDICATION
TO MY FATHER
WHO STARTED HIS ETERNAL JOURNEY TOWARDS THE HEAVEN
DURING THIS STUDY PERIOD
&
TO MY MOTHER
&
TO MY MOTHER AND FATHER-IN-LAW
&
TO MY AMAZING DAUGHTERS: TATINEE, TANUSHREE & TANVI
&
TO MY WIFE DR.MALA KHAN WHO REMAINS TO BE MY PERFECT
FOIL IN ALL CRISES AND ADVERSITIES I HAVE BEEN FACING
v
ACKNOWLEDGEMENTS
MY BELOVED WIFE AND PREMIER CHEMICAL METROLOGIST IN
BANGLADESH DR.MALA KHAN WHO WAS SO KIND TO SUPPLY ALL THE
VALIDATED DATA UPON CONDUCTING THE LABORATORY ANALYSIS AT HER
LAB MEETING THE STRICT QUALITY CONTROL PROCEDURES, MY BRILLIANT
FRIEND JOHN UTHRIZ WHO HAD HELEPED ME A LOT FOR PROGRAMING IN
R USED IN THIS STUDY, MY MENTOR PROF.PAULO GOMES WHO SHOWED
HIS TREMENDOUS AFFECTION TOWARDS ME IN SUPERVISING ME WITH HIS
GREAT EXPERTISE IN THE SUBJECT, MY COURSE COORDINATOR
PROF.ROBERTO HENRIQUES AND ALL MY COLLEAGUES AT NOVA IMS
vi
ABSTRACT
Several multivariate statistical or chemometrics or pattern recognition techniques e.g. Principal Component Analysis, Factor Analysis, Hierarchical and Non-Hierarchical k-Mean Cluster Analysis have been applied to gain understanding about the quality of the packaged bottled drinking water in the market of Bangladesh. Twenty three (23) physico-chemical properties of total of 51 water samples have been investigated. The data set consists of 49 individuals from 11 Brands and 2 deionized ASTM TYPE-I water samples produced in the laboratory to be a technically pure water having Electrical Conductivity ~0.056 µS-cm-1. Descriptive statistics, analysis of variance, Non-Parametric Kruskal-Wallis tests have been conducted to detect statistical differences between the water types and different brands. Total of 23 attributes of water covering major ion contents: sodium, potassium, calcium, magnesium, iron, manganese, chloride, fluoride, sulphate, bicarbonate and nitrate and other features: pH, temperature, total dissolved solids, electrical conductivity, hardness, ammonium, nitrite, free cyanogen and chemical oxygen demand, total cation sum and total anion sum. Both the Principal Components Analysis and the Factor Analysis revealed that the differences between water individuals are best characterized by four Principal Components or Factors indicating material loadings, hardness or softness aesthetic acceptability and lightness/sutability for human consumption. Hierarchical and Non-Hierarchical k-means Cluster Analysis clearly identified the presence of four distinct clusters: A, B, C and D among the bottled water products in the market of Bangladesh. The profile features for each cluster have been defined as such the classification achieved to acquire improved and detailed understanding of the general properties of the products under study. We have observed that HCA using WARD algorithm provided us with more realistic classification solution in comparison with non-hierachical k-means as the Cluster members are truly reflecting their group pattern in line with their chemical compositions. HCA using WARD showed that BRAND05 and BRAND11 belonging to Cluster A products execssively loaded with materials and considered to be as hard waters. And BRAND09 and BRAND10 staying with DEIONIZEDWATER belonging to Cluster B are completely devoide of essential minerals as such seemed to be as ultra low mineral content type water or too soft in nature. The other folks BRAND03, BRAND04, BRAND06, BRAND07 and BRAND08 are also not having sufficient mineral contents so as to be very soft water indeed. Hence, waters belonging to Clusters A, B and C are not suitable for human consumption. Only two brands BRAND01 and BRAND02 staying in Cluster D appeared to be suitable for human consumption in every respect.The fact is the BRAND01 is produced by a foreign manufacturer. That means, all other local brands, except BRAND02 are essentially not having the appropriate quality to be drinking waters. From both PCA and FA these two brands BRAND01 and BRAND02 have been very well explained. These are the major outcomes of this study not immediately apparent from univariate approach or not appeared from the data set while looking through naked eyes. It is revealed that the multivariate data analytical techniques have potential to be useful complementary techniques to support the existing univariate practices for industrial quality assurance quality control, market surveillance, standardization process and or regulatory purposes and also seemed to be interesting to academic and scientific communities seeking advanced knowledge.
vii
KEYWORDS
Chemometrics; Pattern Recognition; Principal Component Analysis; Factor Analysis; Cluster Analysis; Bottled Water Quality Monitoring; Market Surveillance.
i
INDEX
1. Introduction ... 1
1.1. Background ... 1
1.2. Problem Statement ... 2
1.3. Aims & Objectives ... 4
1.4. Rationale ... 5 1.5. Scope ... 7 2. Literature review ... 9 3. Methodology ... 12 3.1. Theoretical Framework ... 12 3.1.1. Introduction ... 12
3.1.2. Principal Component Analysis ... 12
3.1.3. Factor analysis ... 13
3.1.4. Cluster Analysis ... 13
3.2. Methodological Procedures ... 15
4. Results and discussion ... 17
4.1. Origin of Data & Variables ... 17
4.2. Code for Individual, Brand, Variable, Scale or Unit of Measurement ... 18
4.3. Initial Data Matrix X and Centered Data Matrix X_CENTERED ... 20
4.4. Descriptive Statistics and General Impression about the Data ... 22
4.4.1. Descriptive Statistics ... 22
4.4.2. Important Observation: Non-consideration of Variables NO2, SO4, Free CN and COD 22 4.4.3. Plotting Histograms, Box Plots & Non-Parametric Tests for Normality ... 23
4.4.4. Kruskal-Wallis Tests for Variable vs Brand ... 26
4.4.5. Correlogram & Correlation Matrix among the variables ... 28
4.4.6. Poor Correlations among pH, TEMP and other Variables ... 31
4.4.7. Summary on Descriptive Statistics ... 31
4.5. Principal Component Analysis ... 32
4.5.1. Extraction of Eigen Values and Cumulative Percentage of Variance from Correlation Matrix ... 32
4.5.2. Correlations between the Original Variables and the First Four Principal Components denoted as PC1, PC2, PC3 and PC4... 36
ii
4.5.3. Absolute (CTA) and Relative (CTRx1000) Contribution from Variables to build the
Four (4) Principal Components ... 38
4.5.4. Absolute (CTA) and Relative (CTRX1000) Contributions from Individuals to build the Four (04) Principal Components ... 40
4.5.5. Possible Explanation of Some Extreme Behavior of some individuals ... 48
4.5.6. Principal Component Maps & Possible Interpretation ... 50
4.6. Factor Analysis ... 70
4.6.1. Factor Analysis by Principal Component Analysis using Correlation Matrix70 4.6.2. Selection of Principal Factors ... 71
4.7. Cluster Analysis ... 79
4.7.1. Method ... 79
4.7.2. Cluster Analysis using Hierarchical Approach ... 80
5. Conclusions ... 98
6. Limitations and recommendations for future works ... 99
7. Bibliography ... 101
iii
LIST OF FIGURES
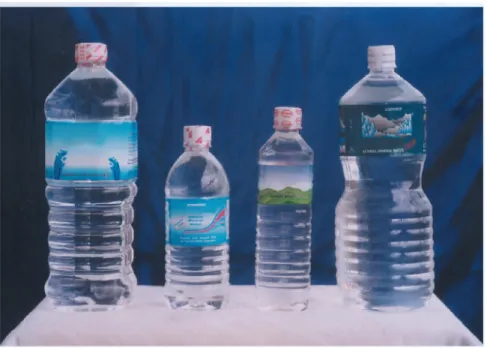
Figure 1.1 – Bottled Drinking Water in Bangladesh ...7
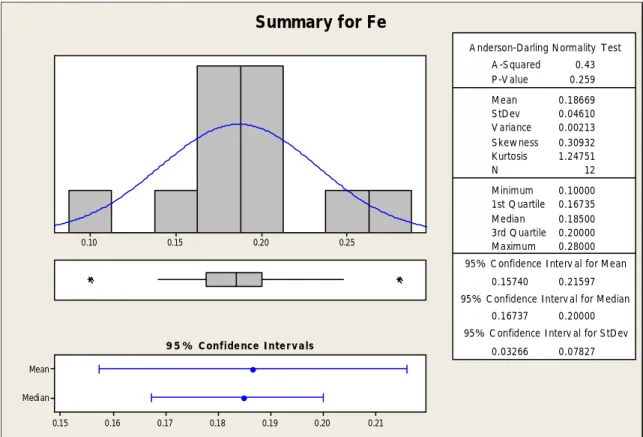
Figure 4.1 – Results of Anderson-darling Normality Test for Fe ...23
Figure 4.2 – Histogram of pH ...24
Figure 4.3 – Normality Test Results for Variable Mg ...24
Figure 4.4 – Normality Test Results for Variable Ca ...24
Figure 4.5 – Histogram for TEMP (Temperature)...25
Figure 4.6 – Histogram of Bicarbonate Alkalinity HCO3 ...25
Figure 4.7 – Histogram & Normal curve for TDS ...25
Figure 4.8 – Histogram & Normal Curve for CATIONS_SUM ...25
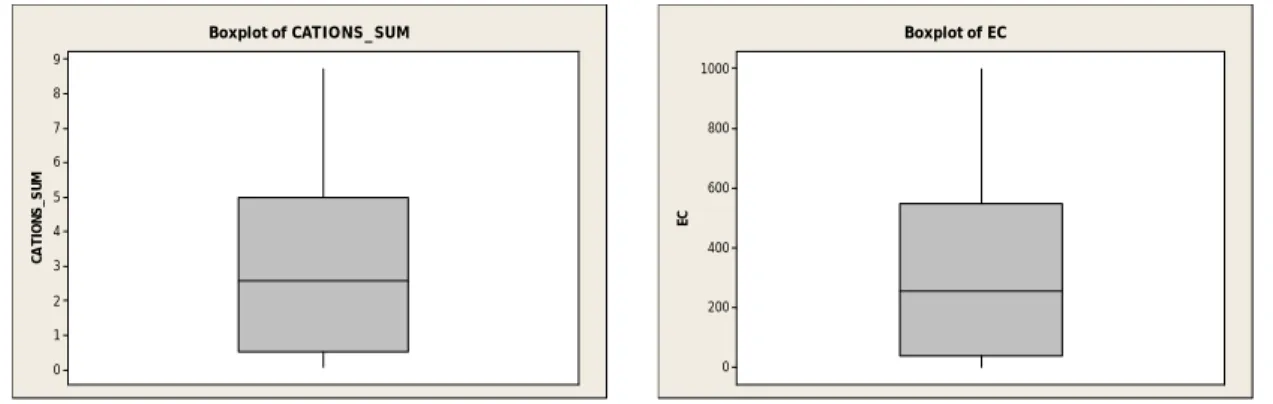
Figure 4.9 – Box Plot for CATIONS_SUM ...25
Figure 4.10 – Box Plot for EC ...25
Figure 4.11 – Non-parametric Ruyan – Joiner (Shapiro-Wilk) Probability Test for Fe ...27
Figure 4.12 – Correlogram among the original variables used for further PCA Analysis ...30
Figure 4.13 –Scree Plot ...34
Figure 4.14 – Eigen Value Plot shows Percentage of Variability covered by each PC ...34
Figure 4.15 – Projection of Individuals and Variables along PC1 ...44
Figure 4.16 – Projection of Individuals and Variables along PC2 ...45
Figure 4.17 – Projection of Individuals i.e. Brands and Variables along PC3 ...46
Figure 4.18 – Projection of Individuals i.e. Brands and Variables along PC4 ...47
Figure 4.19 – Euclidean Distance of Individuals from the Center of the Cloud in Principal Components Space ...48
Figure 4.20 –Variables on Principal Axes 1 & 2 ...51
Figure 4.21 –Variables on Principal Axes 1 & 3 ...52
Figure 4.22 –Variables on Principal Axes 2 & 3 ...53
Figure 4.23 –Variables on Principal Axes 1 & 4 ...54
Figure 4.24 –Variables on Principal Axes 2 & 4 ...55
Figure 4.25 –Variables on Principal Axes 3 & 4 ...56
Figure 4.26 –Individuals or Brands on PC1/Factor 1 ...59
Figure 4.27 –Individuals projected on the Plane containing the First Two Principal Axes (PC1 & PC2)...60
Figure 4.28 – Plot of Individuals on PC1/Factor1 vs PC3/Factor 3 Plane ...61
iv
Figure 4.30 – Individuals projected on The Principal Plane PC1 & PC3 ...63
Figure 4.31 – Brands projected on The Principal Plane PC2 & PC3 ...64
Figure 4.32 – Individuals projected on The Principal Plane PC2 & PC3 ...65
Figure 4.33 – Brands projected on The Principal Plane PC1 & PC4 ...66
Figure 4.34 – Individuals projected on The Principal Plane PC1 & PC4 ...67
Figure 4.35 – Plot of Individuals on PC2/Factor2 vs PC4/Factor 4 Plane ...68
Figure 4.36 – Plot of Individuals on PC3/Factor3 vs PC4/Factor 4 Plane ...69
Figure 4.37 – Scree Plot & Variance Explained by the Factors from the Factor Analysis ...72
Figure 4.38 – Initial factor pattern on Plane 1 & 2 ...74
Figure 4.39 – Initial factor pattern on Plane 1 & 3 ...75
Figure 4.40 – Initial factor pattern on Plane 2 & 3 ...76
Figure 4.41 – Initial factor pattern on Plane 1 & 4 ...76
Figure 4.42 – Initial factor pattern on Plane 2 & 4 ...77
Figure 4.43 – Initial factor pattern on Plane 3 & 4 ...77
Figure 4.44 – Rotated (Varimax) Factor Pattern on F1 & F2 Plane ...78
Figure 4.45 – Rotated (Varimax) Factor Pattern on F1 & F4 Plane ...78
Figure 4.46 – Average Linkage Hierarchical ...80
Figure 4.47 – Individuals vs Average Distances...81
Figure 4.48 –Dendogram using Euclidean Distance with Average Linkage Method (Clusters of 51 Individuals) ...82
Figure 4.49 – Dendogram using Euclidean Distance with Centroid Method (Clusters of Individuals are revealed) ...85
Figure 4.50 – Distance Between Cluster Centroids vs Cluster ...86
Figure 4.51 – Centroid Distances vs Brands ...86
Figure 4.52 –Dendogram using Euclidean Distance with Complete Method...87
Figure 4.53 – Dendogram from WARD Cluster Analysis ...89
Figure 4.54 –Dendogram using Euclidean Distance with WARD Method ...90
Figure 4.55 –R-Squared vs Number of Clusters from Different Hierarchical Cluster Analysis .92 Figure 4.56 –SSE vs Number of Clusters from Different Hierarchical Cluster Analysis ...92
Figure 4.57 –K-Means Cluster Analysis Results Profile Plot with Original data...96
v
LIST OF TABLES
Table 4.1 – Code for Individual/Brand under study ...19
Table 4.2 – Code and Measurement Unit for Variable ...20
Table 4.3 – Summary of Single-Factor ANOVA Analysis ...21
Table 4.4 – Summary of Descriptive Satistics ...22
Table 4.5 – Summary of Descriptive Satistics ...22
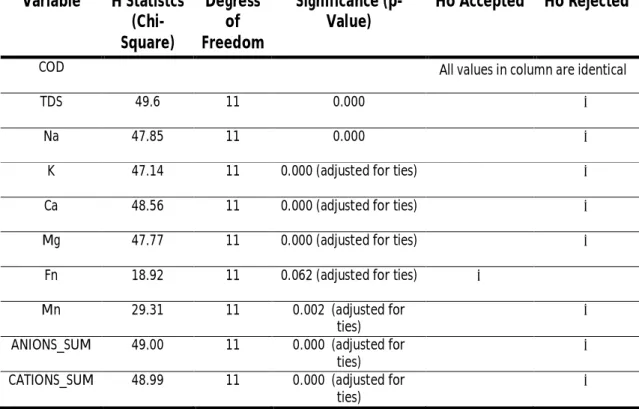
Table 4.6 – Kruskal-Wallis Test Results for Variable vs Brand ...28
Table 4.7 – Correlations among Variables (to be continued...) ...29
Table 4.8 – Correlations among Variables ...29
Table 4.9 – PCA Output Eigen Values & Cumulative Percentage of ...32
Table 4.10 – Residual Matrix ...35
Table 4.11 – Correlations between original Variables and the PCs ...36
Table 4.12 – Absolute (CTA) and Relative (CTRX1000) Contributions from Variables to build Principal Components ...40
Table 4.13 – Absolute (CTA) and Relative (CTRX1000) Contributions from Individuals to build Principal Components ...43
Table 4.14 –Euclidean Distances of BRANDS from the Center of the Cloud ...49
Table 4.15 – Output of the Factor Analysis and Eigenvalues of the Correlation Matrix ...71
Table 4.16 – Factor Pattern...73
Table 4.17 – Cluster History & R-Square values (Average Linkage) ...83
Table 4.18 – Eigenvalues of the Covariance Matrix: From Centroid Cluster Analysis Output .83 Table 4.19 – History of Cluster (Centroid Cluster Analysis) ...84
Table 4.20 – WARD Method: Eigenvalues of the Covariance Matrix (from the Centered Data) ...88
Table 4.21 – History of Cluster (WARD Cluster Analysis) ...88
Table 4.22 – Individuals classified among 4 Cluster from final k-means HCA ...93
Table 4.23 – Clusters Detection Comparison between WARD and K-Means ...94
Table 4.24 – Cluster Statistics for Cluster A & B in Orginal Measurement Scale...94
Table 4.25 – Cluster Statistics for Cluster C & D in Orginal Measurement Scale ...95
vi
LIST OF ABBREVIATIONS AND ACRONYMS
APHA American Public Health Association
ASTM American Society for Testing and Materials
AWWA American Water Works Association
BDS Bangladesh Standard
BQSP Bangladesh Quality Support Programme
BSTI Bangladesh Standards & Testing Institution
CA Cluster Analysis
cGMP current Good Manufacturing Practices
CODEX FAO/CODEX Alimentarius Commission
CRM Certified Reference Material
DNCRP Directorate of National Consumers´ Rights Protection
DRiCM Designated Reference Institute for Chemical Measurements
EC European Commission
EU European Union
FAO United Nations Food & Agriculture Organization
GMP Good Manufacturing Practice HCA Hierarchical Cluster Analysis PCA Principal Component Analysis
ISO International Standards Organization, Geneva, Switzerland
QA/QC Quality Assurance/Quality Control
SM Standard methods for examination of water and wastewater
SPC Statistical Process Control
TQM Total Quality Management
vii
USEPA United States Environment Protection Agency
USFDA United States Food and Drug Administration
WEF Water Environment Federation
1
1. INTRODUCTION
1.1. B
ACKGROUNDWater the most naturally abundant and the simplest molecule on the earth is not only essential for the existence of human beings but also critical for the existence of all flora and fauna on this planet (Cohn, 1999). It has been unequivocally demonstrated that water of good quality is crucial to sustainable socio-economic development (UNEP/WHO, 1996). Access to safe drinking-water is essential to health, a basic human right and a component of effective policy for health protection (WHO, 2008).
Like some other parts of the world Bangladesh is facing the reality that arsenic poisoning in groundwater now threatening millions (Smith, 2000), (Lewis, 1999) and (Tibbetts, 2000) of people using groundwater as their primary source of drinking water. In a separate study (Pedersen, 2003), ( Khan, 2003), (Murshid, 2002) it has been evident that the history of drinking water quality management in Bangladesh is nothing but a systematic lack of monitoring and controlling quality of water thus having far reaching consequences on Bangladesh leading to a calamity like arsenic poisoning (Smith, 2000), (Lewis, 1999) and (Tibbetts, 2000).
In the midst of this crisis rapid and dramatic growth of the market of the bottled water popularly called “mineral water” has been seen from the late seventies or early eighties of the 20th Century (Khan, 2003), (Khan, 2008). Surprisingly, millions of liters of bottled water consumed daily by the people in Bangladesh without knowing almost nothing of the quality of the goods only relying on some declarations/specifications provided by the manufacturers on their product labels which are mostly (>53%) unreliable/ inconsistent (Khan, 2008). A more recent study (Rahman, 2017) also further confirmed this fact where the study states that “The data printed on the bottle labels are inconsistent and not informative enough and does not correspond to the real scenario of constituents in the packaged water.”.
It has primarily been appeared that Bangladesh Standards & Testing Institution (BSTI) having questionable, reportedly non-transparent and dysfunctional organizational system (UNIDO, 2005), (UNIDO, 2008) is issuing certification to the bottled water products prior to be marketed by the manufacturer under its Certification Mark scheme which is indeed regulatory in nature. Although Government of Bangladesh (GOB, 1997) defined standard for drinking water vide Bangladesh Gazzet Additional August 28, 1997, Tofcil-3, Rule-12: Allowable Limit of Drinking Water and Allowable Limit of Groundwater (GOB, 1997) and as a Certification Mark (CM) scheme implementing agency BSTI is authorized to enforce two technical regulations vide BDS 1240:1989 (BSTI, 1990) & BDS 1414: 2000 (BSTI, 2000) for bottled drinking water and natural mineral water respectively, in practice there is no credible and effective market surveillance system in operation (Khan, 2008). Neither BSTI nor the Directorate of National Consumers Right Protection (DNCRP) established as a regulatory authority under the Consumers Right Protection Act 2009 (GoB, 2009) is continuously monitoring and controlling the quality of these drinking water products with systematic, effective and appropriate methods, means and frequency of surveillance protocols to compare the quality criteria stated in BDS 1240 (BSTI, 1990) and or BDS 1414 (BSTI, 2000) or GoB drinking water regulations (GoB, 1997).
2
Assuming the above situation this author along with his other colleagues in Bangladesh conducted studies to accumulate, primarily, the general information on the quality and pertinence practices followed by the manufacturers in declaring specifications and other information on the labels (Khan, 2008) and secondly to determine the inorganic physico-chemical quality of the commercially available bottled water in Bangladesh (Khan, 2008). The quality and validity of the data declared on the product labels and the inorganic physico-chemical quality of the bottled water has been observed to be mostly (>53%) invalid (Khan, 2008) . The study (Khan, 2008) indeed applied univariate statistical techniques dictated in the prevailing industrial practices e.g. cGMP, (WHO, 2008), (USEPA, 2002), (CODEX, 1985) (CODEX, 2001a), (CODEX, 2001b) and (BSTI, 1990), (BSTI, 2000) and so on. The univariate based and summarized study results has been documented (Khan, 2008) upon conducting a general survey as well as laboratory based various instrumental analyses on total of 23 physico-chemical properties (variables). The observation matrix comprising 51 samples or records from 11 individual Brands collected from the market of Bangladesh including 02 (two) laboratory reagent grade water samples namely DEIONIZED WATER01 (DIWa) and DEIONIZED WATER02 (DIWb) to be chemically pure and demineralized water as per ASTM Type-I. The details methods of analyses, quality control and quality assurance procedures, descriptive statistical treatment and data quality assessment and validation process have been explained in the literature (Khan, 2008). The laboratory analyses have been conducted as per the applicable international best practices and norms (APHA, 1995), (USEPA, 1996), (USEPA, 1997) to ensure the validity, reliability of the data.
Owners and producers of the primary data are this author and his colleague who conducted the laboratory analysis prior to publishing preliminary survey results (Khan, 2008). More technical resourecs and knowledge have been acquired from the stat-of-the-art designed apex national laboratory, namely, Designated Reference Institute for Chemical Measurements (DRiCM) within the Ministry of Science & Technology in Bangladesh. This access to the primary laboratory based data has opened the opportunity to this author for investigating these commercialized bottled water brands in Bangladeshi market applying multivariate techniques. Because the previous study (Khan, 2008) did not applied multivariate techniques to explore any underlying physico -chemical and the quality attributes for grouping, clustering or classification etc.
1.2. P
ROBLEMS
TATEMENTBy and large, as per the conventional national, regional, international water, environment and related technical regulations, standards, protocols and practices (BSTI, 1990), (BSTI, 2000), (CODEX, 1985), (CODEX, 2001a) (CODEX, 2001b), (CODEX, 2008), EC (1998), GOB (1997), (UNEP/WHO, 1996), (USEPA, 1996), (USEPA, 1997), (USEPA, 2002) and (WHO, 2008) the quality of water for drinking, agricultural and industrial purposes is being monitored through evaluating individual physico-chemical-biological parameters as well as determining the presence of organic-inorganic-microbiological contaminations. And these monitoring processes mostly utilize univariate statistical approach along with other empirical methods.
3
The water industries while practicing, say, QAQC within the framework of TQM or cGMP, using bare minimum univariate statistical approaches required by their respective standards decided by the industries themselves as well as the concerned regulatory enforcing agencies. Applying multivariate techniques are not in vogue, in general, with a few exceptions where Statistical Process Control (SPC), Lean Six-Sigma or similar approaches may be utilizing some multivariate techniques at a minimum level. Especially within the packaged/bottled drinking water industries, rigorous utilization of multivariate techniques has not been reported.
On the contrary state-of –the-art multivariate techniques, provide statistical methods for study the joint relationships of variables in data that contain intercorrelations and several variables can be considered simultaneously, interpretations can be made that are not possible with univariate statistics. From the thorough literature survey it has been evident that in the other field of knowledge, natural sciences and industrial QAQC the multivariate techniques have been applied widely which showed that multivariate data analysis may provide some different and better understanding about the system comprising a large number of variables and data sets intermingled among themselves and apparently seemed not be to understood trough univariate approaches or pattern are not immediately visualized from conventional univariate techniques. While univariate statistical analysis of a large amount of data seemed to be cumbersome and cause misunderstanding and error in the interpretation, multivariate statistical techniques are more robust and, thus, become more useful for data treatment and for identification of anomalous or other underlying patterns (Lourenço, 2010). To gain a further insight and interpretation of large data sets it needs to be rather invesrtigated and understood via applying more exploratory as well as state-of-the-art multivariate techniques.
Upon considering the above situation, this project investigated the applicability of various multivariate techniques in classifying and qualifying the commercially available bottled water brands in Bangladesh and further augmenting and improving the knowledge in this area to accumulate more scientific information with a potential to be appreciated by regulatory, standardization, consumers´ rights protection bodies or communities and academia. At this particular stage, the author made an assumption that in conjunction with the conventional univariate based Industrial QAQC practices these approaches could be considered to be an additional supplementary aid to understand further and or to “explore” the overall “state” or quality of the commercialed or marketed drinking waters with an ultimate aim to framing, building, testing new hypothesis or theory to be investigated at the further “confirmatory and or structural equation modeling” stage in future. This dissertation mostly covered the “exploratory analysis” to reach “unsupervised classification solution (s)”. Further investigation needs to be done via “confirmatory analysis” to reach any “structural equation(s)”. It could be reasonably assumed that to enforce regulations, specifically, in monitoring and controlling the variables, or indicators, or attributes or pollutants in the water having potential health risks, univariate approach would be prevailing practices until it is convincingly proved through various rigorous investigations that there are some significant benefits and advantages could be attained from multivariate techniques.
4
Considering this particular context, the main research questions appeared before this study team are as below:
a. Is there any scope of applying multivariate statistical techniques to understand the physico-chemical quality attributes of bottled drinking water products available in the market?
b. Are these techniques able to provide plausible explanation of any physico-chemical phenomena of water under study?
c. Is there any possibility to define/identify any reduced number of latent, independent quality indicators or features synthesized from the physico-chemical properties of the bottled drinking water?
d. If yes, to what extent these new indicators or features are suitable to explain the drinking water quality?
e. Is it possible to develop, validate any model or classification mechanism to classify the bottled drinking water products with respect to their group profiles for the purposes of market surveillance?
f. What are the limitations and prospects of applying these models or classification mechanisms in water quality monitoring programme?
Considering the availability of time and access to resources as well as assuming the academic needs, during this research technically sufficient number of samples (51) or individual Brands have been investigated to address the limited number of research questions listed above. But to meet the scientific requirements it had been planned that at the very onset of the investigation a quite large and exhaustive number of variables at least 23 has been studied following the internationally accepted reliable, strict and validated laboratory analytical processes so that the chemistry and physics of the water under study are fully characterized and understood with respect to their physico-chemical nature. The data matrix has been constructed with utmost reliable, quality and valid physico-chemical analytical results as such the present multivariate exploratory as well as the future confirmatory analysis do not suffer from any shortfall in their data quality level.
1.3. A
IMS&
O
BJECTIVESGeneral objective of this research is to augment the knowledge about the quality of the commercialized bottled water in Bangladesh from multivariate analytical point of view and exploring any underlying interactions among the physico-chemical properties of water which could not be discerned immediately from the existing conventional univariate statistical analysis.
5
To specific objectives are:
a. Determining the scope of applying multivariate techniques to understand the physico-chemical quality, suitability of bottled drinking water products available in Bangladeshi market.
b. Investigating the possibility of defining any reduced number of latent, independent quality indicators synthesized from the large number of physico-chemical properties of the bottled drinking water. Estimating the limits of applicability of these indicators and suitability for explaining the drinking water quality.
c. Determining and visualizing clusters, if any, among the brands and expressing as well as explaining them with respect to their group profiles.
1.4. R
ATIONALEUnderstanding and monitoring the quality of the commercialized bottled drinking water are critical to protect the consumers’ rights, to ensure the safety of the manufactured products, to enforce the regulatory regime (Cohn, 1999), (Khan, 2003), (Khan, 2008).
Following various industrial production processes manufactures are producing and placing their packaged/bottled water products in the market. Various declarations in relation to standards, certification, testing, inspections, compositions, quality are made in the product labels. It is imperative to know that to what extent these declarations are valid and reliable and in compliance with the applicable requirements and needs (Murshid, 2002a), Murshid, 2002b).
Considering the implications in public health (Smith, 2000) and consumers rights protection (Cohn, 1999) the above issues are more critical specially in the least developed country like Bangladesh where enforcement of regulatory and standards regime are not yet developed and efficient (Khan, 2003), (Khan, 2008).
Furthermore, it is also important for the manufacturers to know the quality features and the attributes of the commercialized products both from their own origins as well as from their competitors to be more efficient operators in the market place.
Public, regulatory, civil and consumers rights societies, academia and finally the consumers are interested to know the status of the quality and safety of the commercialized bottled drinking water available in the market.
Monitoring the quality of water is technically challenging as well as an ever evolving issue gaining more impetus due to significant advancement in the other fields of knowledge e.g. multivariate statistical techniques experienced tremendous growth due to increased computing capacities (Lebart, 2008), commendable improvement in laboratory instrumental techniques and increased awareness in consumers rights, public health and environment protection after globalization.
6
Besides, state-of-the-art multivariate techniques, underpinned by the easy access to advanced computing capacities, provides statistical methods for study of the joint relationships of variables in data that contain intercorrelations. As in these methods, several variables can be considered simultaneously, interpretations can be made that are not possible with univariate statistics and as such in the last more than five decades from early sixties applications became common in medicine, agriculture, geology, social sciences, environmental sciences, ecology and systematics and other disciplines (James, 1990). The opportunity for succinct summaries of large data sets, especially in the exploratory stages of an investigation, has contributed to an increasing interest in multivariate methods (James, 1990).
In the field of water quality assessment relatively recently in the last two decades multivariate techniques are being utilized and quite a large number of research published covering ground water (Belkhiri, 2010), (Chenini, 2009), (Kumar, 2010), (Mahmood, 2011), Silva (2008), (Singh, 2009), surface water (Ahmed, 2005), (Carlson, 2002), (Charkhabi, 2006), (Iscen, 2008), (Kaneene, 2007), (McNeil, 2005), (Mustapha, 2011), (Obeidat, 2011), (Swain, 2012), (Yusuf, 2013), spring water (Ragno, 2007), river water (Alam, 2010), (Adeogun, 2012), (Debels, 2005), (Ge, 2013), Kido, (Najafpour, 2008), (Samsudin, 2011), (Shrestha, 2007), (Shrestha, 2008), (Zhao, 2009), ocean water (Pati, 2012), (Saravi, 2011) of different parts of the world. These studies assessed the physico-chemical properties of the water with applications in hydrogeology, geo-chemistry, maritime research, environmental sciences mostly to monitor impact of chemicals, pollutants and waste loads due to industrial, agriculture and other anthropogenic practices and classify the waters based on their physico-chemical properties as well as to understand any spatial-temporal evolution.
Although a very few in numbers, some studies have been published where potable drinking waters either from tube wells (Hossain, 2013) or from public-municipal piped supply systems (Souza, 2005) and (Odagiu, 2011) or from natural springs (Šnuderl, 2007) have been assessed applying multivariate techniques.
Along with the descriptive statistical methods invariably all of the above mentioned studies applied various multivariate techniques, namely, Principal Component Analysis (PCA), Principal Factorial Analysis, Multiple Correspondence Analysis, Canonical Correspondence Analysis, Partial Least Square and Discriminant Analysis, Cluster Analysis etc. also to observe spatial-temporal pattern of the water under study.
But it is worth mentioning that in comparison with the above mentioned studies only a very few (Ghrefat, 2013), (Inam, 2010), (Lourenço, 2010) and (Van, 2012) investigations has been recorded so far which assessed the quality of the commercialized bottled drinking water through applying multivariate data techniques. From the brief literature review, detailed in the subsequent Section 2, it has also been evident that these studies are also not free from limitations.
But these studies showed the clear potential of applying these multivariate techniques in monitoring the quality of the bottled water in the markets. The studies have sufficiently raised impression that there is an opportunity to investigate more in this area to further amplify the applicability of these techniques to cover different manufacturing, market, regulatory and or standards and economic regimes.
7
Moreover, the pure natural water i.e. demineralized water has not yet been studied so far applying these multivariate techniques to understand its natural physic-chemical behavior. The DEIONIZED WATER is indeed a known pure water, theoretically, not having any mineral, anion, cation or dissolved solid, suspended solid or particulate materials. This version of water is produced through applying a very sophisticated technology removing all anion, cations, organics, microbes and particulate materials. The specifications defined in the ASTM TYPE-I standard clearly stated that Electrical Conductivity (EC) and Electrical Resistivity of this deionized water, called ASTM TYPE-I, must be around 0.056 uS/cm or 18.3 Mohm-cm respectively. It is expected that this very individual DEIONIZED WATER would show a very extreme behavior in terms of physics and chemistry in comparison to other water samples under study.
The proposed study would be investigating the scopes of application of multivariate techniques for developing, optimizing model for understanding, qualifying the commercialized bottled drinking water to be fit for the above mentioned areas of application. This study may pave the way of developing some classification for controlling and monitoring the bottled water market. This study would help improving the existing body of the knowledge specifically in application of multivariate techniques in drinking water quality monitoring.
Figure 1.1 – Bottled Drinking Water in Bangladesh
1.5. S
COPEThis study is aimed to:
1. Collect, collate and compile the data for various physico-chemical properties of different brands of bottled water from the market of Bangladesh which have been tested in a
8
national laboratory using valid and reliable techniques and ensuring appropriate QAQC measures as the applicable international norms and standards.
2. verify the applicability of multivariate techniques to understand the physico-chemistry of bottled drinking waters in the market of Bangladesh,
3. identify and or define some reduced number of latent, independent indicators synthesized from the original physico-chemical variables and verifying the capacity of interpretation of these new indicators applying PCA and related techniques,
4. determine and visualize clusters, if any, through Cluster Analysis (CA) based on the similarity behavior of the brands,
5. produce a dissertation and communicate the scientific results to share the knowledge among the peers.
9
2. LITERATURE REVIEW
As mentioned above a very few studies (Ghrefat, 2013), (Inam, 2010), (Lourenço, 2010) and (Van, 2012) are published in relation to application of multivariate data technique to understand bottled/packaged drinking water.
Ghrefat (2013), reported the study of 54 brands of bottled drinking waters in Saudi Arabia where eight selected major chemical ion variables : calcium, magnesium, sodium, potassium, chloride, sulfate, bicarbonate and nitrate were examined by correlation analysis, principal component analysis (PCA) and hierarchical cluster analysis. Hierarchical cluster analysis classified the brands into different groups and the products have a diverse character reflected by their chemical compositions and are dominated by Na-Ca-HCO3-Cl type water. Total hardness values identified as the influential parameters which dictated the classification of the brands from soft to moderately hard waters. The study reported that the constituents lie within the acceptable limits established by the national – international standards and guidelines. The main criticism about this report is that the investigator relied solely on the data declared on the product labels declared by the manufacturers. The investigator himself did not tested the water in any reference or credible laboratory. There is no indication about the quality: reliability, validity and chemical metrological traceability of the data he used. No report has been made about the number/type of the variables whether they are sufficiently representing the chemistry of the nature of the water under investigation or not.
Inam (2010) studied 20 trace heavy metals in 165 ground water and 8 commercial bottled brands in Akwa Ibom State, Nigeria. In addition to some major cations e.g. sodium, potassium, iron, manganese, ammonium it is essentially required that relevant major anions i.e. sulfate, chloride, bi-carbonate alkalinity, Floride, Nitrate, Nitrite including some other aggregate properties like hardness, turbidity, total dissolved solids Electrical conductivity must be tested to understand the main quality features of natural water as these are the main constituents which contribute to build up the total balanced ion sums. But without analyzing these anions the author wrongly claimed that the study has been conducted to ascertain the quality and suitability of the water for drinking. With this inherent major methodical flaw, based on only 20 trace metals the author classified the ground water and bottled drinking waters applying Correlation Analysis, PCA and Hierarchical Cluster Analysis by Ward method which is having obvious bias.
The study by (Van Hulle, 2012) Applied multivariate statistical methodologies to characterize the commercialized bottled water and tap water in the flemish market. In this study the physico-chemical composition reported on the label of 49 bottled still waters, 22 bottled sparkling waters and 13 tap waters were used to carry out a characterization study by means of multivariate techniques principal components analysis (PCA) and discriminant analysis (DA). A one-way analysis of variance (ANOVA) test (with known standard deviation) confirmed the difference among different water types and water brands. Principal components analysis revealed that the differences between water types are best characterized by components that indicate saltiness, hardness and pH. The component pH allowed discriminating between sparkling water and non-sparkling water. It was not possible to divide the different water types based on saltiness or hardness, but it could be demonstrated that different types of water exist (low mineral, high mineral and mineral). The main criticism about this
10
study is it has been conducted on the basis of the data declared on the product labels only, not from any laboratory based study by the authors themselves. It is not known to what extent these data declared on the labels are valid, reliable and chemical metrological traceable. It is also not investigated whether the number of variables are exhaustive or not and whether they are sufficiently explaining the physico-chemical properties or quality attributes of the water under study or not. The answers to these questions may be lying behind the fact that why the study could not divide or differentiate or classify the individuals reasonably based on the physico-chemical data used in this study (Van, 2012).
But the study by Lourenço et.al. 2010 came up with a very comprehensive and detailed investigation reports on 33 different types of brands bottled waters consisting of 18 natural mineral waters and 15 bottled water from springs at geographically different locations in Portugal. Same brand some time marketed carbonated and non-carbonated waters. As such 10 physico-chemical parameters of total of 39 bottled ware have been tested in 2009 by the Laboratory of Geochemistry for Resource Management and three new synthetic dimensions have been identified upon conducting PCA and efficiently able to distinguish and classify the bottled along three main Principal axes. The first Principal axis explains almost 50% of the total variance, which is a typical mineralisation axis. In particular, HCO3−, Na+, Ca2+, Mg2+ and K+, parameters with the highest loadings contributed significantly to give a plausible interpretation. The second axis covering 23% of the total variance, discriminates sulphate-chloride type waters. Finally, the 3rd principal component axis denoted a pollution index derived mainly by agricultural activities and has been confirmed by the high PC loading on NO3. In this study PCA been successfully applied to identify the main geotectonic interrelationships among physicochemical parameters and contributing to a new typology of bottled waters, based on their hydrochemical characteristics and geological occurrence.The study demonstrated that the first three Principal components are classifying the bottled (spring and natural mineral) water with respect to their hydro-geochemical properties. This study again depicted the potential of applying multivariate techniques in classifying the bottled water. But this study did not further explored other techniques e.g. Cluster Analysis or Discriminant Analysis and so on. Drawing inference about the groupings only based on PCA may sometime lead to a wrong interpretation. Care must be taken before drawing such inference, especially consideration and treatment must be done if there is any effect from outliers.
12
3. METHODOLOGY
3.1. T
HEORETICALF
RAMEWORK3.1.1. Introduction
The codes for each brands from different manufactures have been assigned (Table 4.1). The codes for variables: physico-chemical properties also have been assigned. The units or the scales of measurements are also tabulated ( Table 4.2) as they are different in scale, therefore, throughout this investigation we would be applying the multivariate techniques mostly on centered or standardized data matrix (Annexure 2) . This is indeed a very important assumption to be kept in mind from now on.
Initial Data Matrix X in Excel Speed Sheet (Annexure 1) has been constructed by further reducing and summarizing the original raw data. The Initial Data Matrix X has been tabulated in Excel Speed Sheet consisting of 23 variables for total of 49 individuals from 11 Brands plus two individuals DIW and DIWb from the controlled laboratory reagent grade water, namely, DEIONIZED WATER. Number of variables sufficient to explain the water chemistry are retained. For each variables, the normality test to be done to verify whether the data are from same or different population. Standardized or Centered Data Matrix X_CENTERED consists of the finally retained variables for total of 51 observations would be generated .
To understand the general trend of the variables the descriptive statistical analysis has been done and summary has be tabulated (Table 4.4). The mean, standard deviation, minimum and maximum values of each variable has been recorded. For each variable, non-parametric normality test (for 95% Confidence Interval) has been done. As an example, when the variable total dissolved iron (Fe) is considered, it is observed that this variable is behaving normally as per the Anderson-Darling Normality test where the Null Hypothesis (Ho: The Fe data came from a normal distribution) has NOT been rejected at 5% level (p-value:0.259). Histogram and Box Plot have been constructed to understand each parameter from univariate point of view as well.
Correlation matrix has been constructed to see the correlations among the variables. Summary of the descriptive statistics and correlation analysis through looking at the correlograme has been investigagted to see any underlying pattern to move forward for further multivariate data analysis.
3.1.2. Principal Component Analysis
It is possible to describe the pattern of relationships among the objects (individuals, sampling units) by reduction of a matrix of distances or similarities among the attributes or among the objects to one or a few dimensions or by cluster analysis (classification of the objects into hierarchical categories on the basis of a matrix of inter-object similarities). PCA reduces a large number of variables (e.g. measured physical properties, chemical properties, anions and cations) to a smaller number uncorreleted variables called Principal components. The principal components analysis (PCA), allowing to determine which factors (group of variables) account for the numerical variation of the clusters. Also, the definition of PCs helps to extract related variables, giving more information than
13
single indicators or variables and to infer the processes that control water chemistry. In most of the cases, PCA is applied to the linear correlation matrix to be constructed prior to running this analysis. As stated earlier the measurement scales or units of the variables are different hence instead of using the covariance matrix, in this study the correlation matrix has been used to extract the eigen values to construct the corresponding eigen vectors which generates Principal Axes (PAs) and the Principal Components. The MINITAB, R, SAS and similar statistical packages having procedure of PCA analysis essentially utilized the standardized data or use correlation matrix.
3.1.3. Factor analysis
FA is similar to principal components analysis where it uses the similarity properties intrinsic to the matrix under study where usually eigen values as well as the corresponding eigen vectors are generated from the correlation pattern underlying the attributes. It emphasizes the analysis of joint relationships among the attributes or variables. Canonical correlations among the attributes are evaluated to explore whether there are any latent factors existing. These Factors, surely reduced in number in comparision with that of original variables, could be assumed to be newer reduced dimensions or Axes. In case of FA, in brief, the joint relationship among the attributes are studied to project them towards a few number of axes, called Factors, for further augmenting the information about underlying interactions among these variables. The Factor Analysis process uses the correlation between variables in order to find the latent factors within them. While running the Factor Analysis in this study we used the software package SAS which essentially extracted the eigen values as well as the corresponding eigen vectors in constructing the Principal Factors from the Correlation Matrix. Hence it was not unlikely that the same results and outputs were obtaibed from both the PCA and the Factor Analysis.
It may be noted that success of using the Factor Analysis technique depends on the correlation structure presents in the input data. It was required to be confirmed that significant correlations among the variables were existing, otherwise the Factor Analysis might not provide additional useful information. This analysis involved several steps. The first was to analyze the correlation structure of the input data set. It was not unlikely that there were significant correlations existing among the majority of the bottled water quality variables. In the next step was to chose the method of extraction of eigen values. It is already mentioned above that our original input matrix contained data from the measurements in different scales hence instead of using the covariance matrix, the correlation matrix was used to extract the eigen values as well as to construct corresponding eigen vectors during this analysis. The third step was to take the decision on how many number of factors to be extracted and or retained for further interpretation. Interpretation of the factors to be made based on factor loadings and essentially this process was similar to that of Principal Component Analysis.
3.1.4. Cluster Analysis
With cluster analysis (CA), objects are placed in groups according to a similarity measure and then a grouping algorithm. The reduction in the data comes from forming g groups (g less than n) out of n objects.
14
After the Principal Component Analysis and confirmation through the factor analysis, it could be confirmed that there are example, four principal components or factors sufficient as the latent dimensions to explain the bottled water products under study.
Applying the similarity criteria using both factors and original variables the cluster analysis to be conducted to see whether there is any grouping exists among the bottled waters and or Brands under study. It would be investigated and visualized to understand the fact that which brand or product belongs to which group and what are the average and or overall behaviors of these groups or clusters.
The application of cluster analysis involves two main methods, either hierarchical or non-hierarchical. The methodology to be used for clustering based on factors and the original variables.
At the beginning a hierarchical procedure to be run to define the number of clusters to be extracted. Since in these unsupervised learning procedures the number of clusters depends on the data it is not necessary to define a priori how many clusters to be generated. The ultimate classification solution based on hierarchical procedures depends on the distance measurement and the aggregation algorithm used.
In particular, in this study the methods like Average, Centroid and Ward’s to be used and the results would be verified to assess their suitability for further interpretation and applications.
The number of clusters decided thus in the previous steps would be further used prior to running the final non-hierarchical k-means algorithm in confirming the final clusters. Moreover, different distances would be used e.g. Euclidean distance, squared Euclidean distance etc.
All of these approaches may provide similar results or different results. But the final classification solution to be selected based on the performance of each approach i.e. based on the analysis of the R-square, SSE (sum of squared error (SSE) for a number of cluster solutions) and dendogram. Then, the best combination of hierarchical procedures, which was in fact WARD minimum variance technique, to be used to generate the initial seeds of the non-hierarchical algorithm – k-means. It has been seen that WARD provided the best results. The number of factor or cluster would be finally retained from the WARD output. Following the generation of the clusters, classification among the individuals to be done based on a ‘‘profiling analysis’’ and creating profile plots both using original data and the centered data to have a better understanding and visualization. The general statistical properties of each cluster would be tabulated to understand their relative positions.
In brief, we may summarized that HCA unsupervised pattern detection method partitioned all cases into smaller groups or clusters of relatively similar cases that were dissimilar to the other groups. Squared Euclidean distances measures were chosen to measure similarity/dissimilarity among the variables while the Ward's linkage method was chosen to link initial clusters resulting from the initial clustering steps. The combined use of squared Euclidean distances as a similarity/dissimilarity measure and the Ward'smethod as a linkage algorithm was observed to produce very reliable clusters in HCA.
15
3.2. M
ETHODOLOGICALP
ROCEDURES The data had been collected from an appropriate advanced laboratory based analytical processes following internationally acceptable and application standards, norms, methods, practices and maintaining the appropriate quality assurance - quality control (QAQC) protocols (APHA, 1998), (APHA, 2012) to ensure the reliability, validity of the data. Following these applicable international guidance appropriate protocols and Standard Operating Procedures (SOPs) would be followed at every stage of laboratory processes from bottled water sampling, pretreatment, preservation, transfer to laboratories to sample coding, preparing test aliquots, conducting analysis, assessing-validating the quality of the test results and analytical methods and producing laboratory reports.
The data matrices is constructed by recording 23 number of inorganic physico-chemical properties. Variables selected are exhaustive in number to explain the individual samples or objects (in this case the Brands) in full with respect to their chemistry, physics as well as quality features. Including two laboratory produced deionized water DIW, total of 51 individuals from the maximum number 11 brands available in the market was collected and analyzed to meet the sufficient conditions. Of course, while progressing on the way to conduct this study we have gone through the process of avoiding redundant variables and finally remaining with variables up to 18 excluding five variables, namely, TEMP-EC, NO2, SO4, FreeCN and COD as such not being used for PCA, FA and CA processes.
As we have generated the data in the laboratory by our own there was no missing data.
At the very onset of this study, basic descriptive statistical techniques have been applied to gain understanding on the overall data as well as to “have a general feel about the data” through descriptive, exploratory statistical analysis. This is particularly helpful to decide the pathway for the further advanced data analytical processes, to frame the hypothesis, to give a vision about the potential number of groups or clusters as well their probable physico-chemical nature.
Investigation is conducted on the physico-chemical properties through constructing and understanding similarity-dissimilarity matrices, verifying correlations and covariances among the variables considering various brands of bottled water products.
Understanding the scope of expressing the individual brands with respect to some reduced number of synthetic, independent latent dimensions or factors. Various multivariate techniques e.g. Principal Component Analysis (PCA); and then the Cluster
16
methodologies are applied to explore the quality and attributes of the bottled water so as to understand the overall physico-chemical phenomena and quality features.
Investigation is conducted to check whether the data set for each variable are normally distributed or not. Through assessing the joint-probability distribution functions etc., multi-normal distribution properties have been verified applying hypothesis testing i.e. Kruskal-Wallis Test for Variable versus Brand.
Limitations and scope of further improvement and research has been discussed on applying the multivariate techniques not only for monitoring the quality of the commercialized bottled drinking water in the market but also for industrial quality control quality assurance process during the production in the bottled water manufacturing plants. Further research opportunity has been checked for applying the techniques to discern the potable water matrices in terms of varying manufacturing, geographical, natural origins.
17
4. RESULTS AND DISCUSSION
4.1. O
RIGIN OFD
ATA&
V
ARIABLESA team of researchers in Bangladesh produced and published a laboratory based study results (Khan, M., Anwar, K.M.M., Chowdhury, HQ, Bangladesh Academy of Sciences, 2008) upon conducting a general survey as well as running laboratory based various instrumental analyses on total of 23 physico-chemical properties (variables) for 51 samples from the total of 12 individuals consisting of 11 Brands collected from different departmental and grossary shops at different zones: Dhanmondi, Banani and Uttara of Dhaka City during a one-day sample collection campaign on 12 June 2001 and 01 controlled laboratory reagent grade water called DEIONIZED WATER. Total 51X23 = 1173 validated data structured in the Initial Data Matrix (Annexure 1: Table A1-1 and Table A1-2) upon generating through the physico-chemical analytical process.
The details methods of analyses, quality control and quality assurance procedures, data assessment and validation process have been explained in the published report (Khan, M., Anwar, K.M.M., Chowdhury, H., Bangladesh Academy of Sciences, 2008). The laboratory analyses have been conducted as per the applicable international best practices and norms to provide with a sound basis of the validity of the data (Annexure 1: Initial Data Matrix X Table A1-1 and Table A1-2) containing testing results from the laboratory are in Excel Spreadsheet.
In this present study the authors applied various multivariate data analytical techniques e.g. Principal Component Analysis, Factor Analysis and finally the Cluster Analysis: both hierarchical and non-hierarchical k-means method to explore and study further the quality and attributes of the commercialized bottled water as well as to investigate any interesting physico-chemical phenomena. Prior to applying these advance multivariate techniques the authors also applied some other basis statistical techniques to gain overall understanding on the data as well as to “have a general feel about the data” through descriptive, exploratory statistical analysis. The resluts of these statistical analyses have been summarized in the Table 4.4 and Table 4-4. This approach particularly helped us to decide the pathway for the next advanced data analysis, to give a vision about the potential number of groups or clusters as well their probable physico-chemical nature.
It is worthwhile to note that the data and variables used here in this study are quasi exhasutive to explain the individuals in almost full with respect to macro elemental compositions. There are some variables specially the trace metals, organics substances, contaminants due to agricultural purposes and or residual antibiotics and or other industrial waste and substances may be required to explain or understand the bottled water matrix to its full.
But from the present analytical and academic point view, the number of variables are may considered to be as sufficient for this study as well as to explain in general the bottled water under study with respect to macro elemental compositions.
In this study through application of multivariate analyses the authors have indeed improved knowledge and understanding about the individual brands under study as well as assumed the
18
opportunity to apply these kind of multivariate statistical techniques in revealing the underlying physico-chemical and or quality phenomena having particular importance in industrial quality assurance quality control (QAQC), consumers rights protection, market surveilance, standardization and regulatory regime.
In the subsequent sections the authors described the outcomes of the various data analyses process and recorded the observations, possible interpretation, limitations and applicability of the techniques for this particular type of water quality assessment business. After a thorough discussions the authors have drawn a conclusion to summarize the study.
4.2. C
ODE FORI
NDIVIDUAL,
B
RAND,
V
ARIABLE,
S
CALE ORU
NIT OFM
EASUREMENTThe codes for individual brands from different manufactures has been assigned as per the Table 4.1 in the this study. Observations i.e. “Individuals” from each brand has been given relatively shorter codes to mark every single observation which could be seen in the first column of the Initial Data Matrix X (Annexure 1). To illustrate further let us consider a few examples: several observations or Individuals from BRAND02 has been denoted as B2a, B2b, B2c and so on. And Similarly, other Individuals from BRAND05 has been coded as B5a, B5b, B5c, B5d etc. For two Individuals or observations from DEIONIZEDWATER have been coded as DIWa and DIWb.
Sl.No. Individual /Brand Code Commercial Name/Brand
1 BRAND01 (B1) Ampang 2 BRAND02 (B2a, B2b, b2c, B2d, B2e and B2f) Aqua Mineral 3 BRAND03 (B3a, B3b, B3c, B3d, B3e and B3f) Duncan’s 4 BRAND04 (B4a and B4b) Everest 5 BRAND05 (B5a, B5b, B5c, B5d and B5e) Fresh 6 BRAND06 (B6a, B6b, B6c, B6d, B6e and B6f) Mountain 7 BRAND07 (B7a, B7b, B7c, B7d and B7e) Mum 8 BRAND08 Pran
19
Sl.No. Individual /Brand Code Commercial Name/Brand
(B8a, B8b, B8c, B8d, B8e and B8f) 9 BRAND09 (B9a, B9b and B9c) Samurai 10 BRAND10 (B10a, B10b, B10c and B10d) Yes 11 BRAND11 (B11a, B11b, B11c and B11d) Trishna 12 DEIONIZEDWATER (DIWa and DIWb) DEIONIZEDWATER
Total Individual: 51 of total Brand 12
Table 4.1 – Code for Individual/Brand under study
The codes for variables: physico-chemical properties have been assigned and shown in the Table 4.2 where the units or the scales of measurements are also tabulated. As it has been observed that the units are different therefore, almost all the time most of the analysis under this study would be done on centered or standardized data matrix. This is indeed a very important assumption to be remember from now on throughout the rest of the study.
Sl.No. Code Variable Name Scale/Unit of Measurement
1 TEMP Temperature Deg C
2 pH pH -
3 EC Electrical Conductivity uS/cm
4 NH4 Ammonium mg/L
5 NO2 Nitrite Nitrogen mg/L
6 NO3 Nitrate Nitrogen mg/L
7 SO4 Sulphate mg/L
8 Cl Chloride mg/L
9 HCO3 Bi-carbonate Alkalinity mg CaCO3 /L
10 F Floride mg/L
11 HARD Hardness mg CaCO3/L
12 FreeCN Free Cyanogen mg/L
13 COD Chemical oxygen Demand mg O2/L
20
Sl.No. Code Variable Name Scale/Unit of Measurement
15 Na Sodium mg/L
16 K Potassium mg/L
17 Ca Calcium mg/L
18 Mg Magnesium mg/L
19 Fe Total Dissolved Iron mg/L
20 Mn Total Dissolved Manganese mg/L
21 ANIONS_SUM Total Anions meq/L
22 CATIONS_SUM Total Cations meq/L
Total Variables: 22. Different Measurement Scales/Interval are mg/L: miligram per litre, CaCO3: Calcium Carbonate, uS/cm: microSiemens per cm, meq/L: miliequivalent per litre, O2/L: Oxygen per litre
Table 4.2 – Code and Measurement Unit for Variable
4.3. I
NITIALD
ATAM
ATRIXX
ANDC
ENTEREDD
ATAM
ATRIXX_CENTERED
Initial Data Matrix X in Excel Spreed Sheet (Annexure 1: Table A1-1 and Table A1-2) has been
constructed by further reducing and summarizing the orginal raw data. The tabulated Initial Data
Matrix X consists of a data set from analysis of 22 variables for total of 51 observations or Individuals
including 49 Individuals from 11 Brands (BRAND01 to BRAND11) and 2 individuals from controlled laboratory reagent grade water coded as DEIONIZED WATER (DIWa and DIWb).
One variable TEMP-EC from the original raw data matrix has been droped because this parameter is coupled or paired with variable EC. And another TEMP (TEM-pH: coupled with pH) is retained for this study which is essentially related to the laboratory room temperature during the analysis and is coupled with the variable pH indeed. Considering the natural properties, to explain the water chemistry it is sufficient to study TEMP with pH instead of using TEMP with EC. As per the international standard practices the laboratory analysis is to be conducted at room temperature ranging from 20 Deg C to maximum 30 Deg C. In this case it has been observed that all the analysis has been conducted within the TEMP range 25.1 to 27.25 with an average 26.1 Deg C which are within the acceptable limits. Hence after this stage the authors conntinued study with 22 variables instead of original 23. To drop variable TEMP-EC (coupled with EC) at thi stage as well as in support of this initial inference we have conducted a single factor ANOVA analysis (Table 4.3) to test a Null Hypothesis at 5% significance level to see that the data or results of variables TEMP coupled with EC indeed came from the sample population of the results of the variable TEMP coupled with pH. Alternatively it could be reasonably assumed that there is no significant (at 5% level) evidence that they came from the different populations. Hence the authors’ decision to drop the variable TEMP coupled with EC have sufficient justification and retaining only one variable TEMP with pH would be