DIETS OF FORKBEARD (Phycis phycis) AND CONGER EEL (Conger conger)
OFF THE AZORES DURING SPRING OF 1996 AND 1997
TELMO MORATO, ENCARNACION SOLÀ, MARIA P. GRÓS & GUI MENEZES
MORATO,T.,E.SOLÀ,M.P.GRÓS &G.MENEZES 1999. Diets of forkbeard (Phycis phycis) and conger eel (Conger conger) off the Azores during spring of 1996 and 1997. Arquipélago. Life and Marine Sciences 17A: 51-64. Ponta Delgada. ISSN 0873-4704.
The forkbeard, Phycis phycis, and conger eel, Conger conger, are two coastal species, with a wide bathymetric and geographical distribution. The longline fleet of the Azores catches these two important commercial species. Few studies on their diet composition were found in literature. Data were collected during the demersal cruise surveys that took place aboard the R/V “Arquipélago” during the spring of 1996 and 1997. Stomachs of 53 forkbeards and 95 conger eels were examined to define their diets. Both species fed primarily on fishes, mainly on two benthopelagic species (Capros aper and Macroramphosus scolopax). However, the relative importance of fish was higher for conger eel than for forkbeard, which fed secondarily on decapods. Prey composition of the diet did not vary between sexes, predator size or areas. However, some differences were found on diet composition between depth strata. Prey composition indicates that both predators have the ability to feed near the bottom on benthic prey or in the water column on benthopelagic species.
MORATO,T.,E.SOLÀ,M.P.GRÓS &G.MENEZES 1999. Dietas da abrótea (Phycis phycis) e do congro (Conger conger) dos Açores durante a primavera de 1996 e 1997. Arquipélago. Ciências Biológicas e Marinhas 17A: 51-64. Ponta Delgada. ISSN 0873-4704.
A abrótea, Phycis phycis, e o congro, Conger conger, são espécies costeiras que apresentam uma vasta distribuição geográfica e batimétrica. Estas espécies tem um elevado valor comercial, sendo alvo da pescaria demersal realizada nos Açores com palangre de fundo. Existem poucos trabalhos publicados sobre os hábitos alimentares destas duas espécies. Os peixes foram amostrados durante os cruzeiros científicos dirigidos ao estudo da pescaria demersal, a bordo do N/I "Arquipélago", durante a Primavera de 1996 e 1997. De modo a descrever a dieta destas espécies, foram analisados os conteúdos estomacais de 53 abróteas e 95 congros. As duas espécies alimentam-se principalmente de peixes, nomeadamente duas espécies bentopelágicas (Capros aper e Macroramphosus scolopax). Contudo, a importância relativa dos peixes foi mais elevada para o congro do que para a abrótea, que se alimenta também de crustáceos decápodes. A composição da dieta não variou entre diferentes sexos, tamanhos ou áreas de captura. Contudo, foram encontradas algumas diferenças na dieta relacionada com a profundidade. O tipo de presas identificadas nos estômagos destas duas espécies, indica que ambas se podem alimentar, tanto junto ao fundo, predando espécie bênticas, como na coluna de água, predando espécies bentopelágicas.
Telmo Morato, Encarnacion Solà, Maria P. Grós & Gui Menezes, Departamento de Oceanografia e Pescas, Cais de Santa Cruz, PT-9901-862 Horta, Açores. Encarnacion Solà present address: Rua Cidade São Paulo 30, PT-7800 Beja, Portugal, Maria P. Grós present address: Direcção Regional do Ambiente, Direcção de Serviços da Conservação da Natureza, Matos Souto, PT-9930 Lajes do Pico, Portugal. e-mail: telmo@dop.uac.pt
INTRODUCTION
In the Azores there is an important longline fishery directed towards demersal deep-water species. This fishery saw a rapid development in the 80’s, but the catch rates of the commercial fleet, have declined in the last few years (MENEZES et al. 1998). The forkbeard, Phycis phycis (L.) and the conger eel, Conger conger (L.) are two important commercial species caught by the longline fleet, in coastal waters and on offshore banks. From 1981 to 1994 forkbeard and conger eel represented 12% and 13%, respectively, of total landings of demersal fisheries in the Azores. During this period, landings increased for both species by about 155% and 400%, respectively (MENEZES &SILVA
1999). Further, MENEZES & SILVA (1999) reported an overall decrease in the relative abundance of these species in the Azores, and proposed an implementation of a TAC (Total Allowed Catch) for 1995 to about 310 mt and 540 mt, of forkbeard and conger eel respectively (SILVA et al. 1998).
Forkbeard and conger eel are benthopelagic fishes usually found on hard and sandy bottoms near rocks to 650 m depth (COHEN et al. 1990). In the Azores forkbeard is more abundant off the island shores between 0-200 m depth, while conger eel is equally abundant in coastal areas and offshore banks between 200-400 m depth (MENEZES et al. 1998). They are both known to be active at night and to hide among rocks during the day. The conger eel may be very sensitive to exploitation because it probably reproduces only once in its lifetime (CAU &MANCONI 1984).
The biology of forkbeard of the Azores has been extensively studied in the last few years. The age and growth of this species was described by several authors (see SILVA 1985,MENEZES et al. 1998). Reproduction, including spawning period, maturity as function of length and age, fecundity and sex-ratio have been described (SILVA 1986, ESTÁCIO et al. (submitted), MENEZES et al. 1998). The biology of the conger eel is being studied in the Azores, but information is not yet available. For both species no data on diet or feeding habits have previously been published for the Azores.
Few studies on feeding in these species are available. PAPACONSTANTINOU & CARAGITSOU
(1989) described the diet of forkbeard of the Eastern Mediterranean Sea, while OLASO & RODRIGUEZ-MARÍN (1995) described the diet of conger eel of the Cantabrian Sea and CAU & MANCONI (1984) the diet of the same species for the Mediterranean.
In our study, we examined the diet of forkbeard and conger eel caught during 1996 and 1997 demersal survey cruises. These cruises take place only during the spring and will permit future comparisons of diets between years.
MATERIAL AND METHODS
DATA COLLECTION
A total of 356 P. phycis and 215 C. conger were caught during a wider research program aimed at studying the Azorean demersal fisheries using longline onboard the R/V “Arquipélago”. Fishes were caught during the 1996 and 1997 demersal survey cruise that took place between March and May and covered coastal areas and offshore banks across the Azores. The longline used in the experiments is identical to the one widely used in the commercial fisheries in the Azores (for more detailed description see SILVA &MENEZES 1996). The standardised longline fishing were performed with ca. 128 hooks (MUSTAD 2335, no 9) per skate mounted on 40 cm branch-lines at ca. 1 m intervals and baited with pieces of salted sardine. Line setting began before sunrise (approx. 5:00h) and hauling started after about 2 hours.
From the fish sampled, total length (TL, to the lowest cm) was measured, and for forkbeard, sex and maturity were determined macroscopically. Identification of sex and maturity of conger eel is very ambiguous and were not recorded due to lack of experienced people on this subject. Stomachs were classified as everted (E), regurgitated (R), with bait (B), empty (0), one quarter-full (1), half-full (2), three quarter-full (3) or full (4). Stomachs of category E, R and B as well as individuals that obviously had eaten hooked fish on the longline, were excluded from further analysis. Stomachs with contents were
placed in plastic bags and stored frozen within about 2 h of capture.
The stomach contents were weighed, fixed in 4% buffered formalin for 24 h, and preserved in 70% alcohol. The items were carefully separated, weighed (after removing the surface water by blotting with tissue paper) and identified to the lowest taxonomic level possible. The individuals of each identified taxon were counted. Whenever fragments were found, the number of individuals was taken as the smallest possible number of individuals from which fragments could have originated.
DIET ANALYSIS
The method of cumulative trophic diversity (HURTUBIA 1973), measured by the Shannon index (as H’= -Σ Pi Log Pi, where Pi is the
proportion of individuals in the ith species), was used to determine the adequacy of the sample size (MAUCHLINE &GORDON 1985).
Three indices were used to describe the diet of fish, the frequency of occurrence (%O), percentage numbers (%N) and weight (%W). HYSLOP (1980) has reviewed these methods. Wet weight was used to determine the latter value, after removal of superficial water from each item with soft tissue paper (GLEN &WARD 1968). The Index of Relative Importance (IRI=(%N + %W) x %FO) of PINKAS et al. (1971) was calculated for each prey category and used for various diet comparisons. For diet comparisons, prey taxa were grouped into categories based on taxonomy and ecology. Prey taxa that occurred exceptionally were included in a higher taxonomic level or in the group “others”.
Ontogenetic differences in diet were examined by grouping fish lengths in four size classes (forkbeard: 20-29.9, 30-39.9, 40-49.9, and 50-69.9 cm TL; conger eel: 73-94.4, 95-114.9, 115-134.9, 135-154.9, and 155-186 cm TL) which were arbitrarily assumed to express shifts in prey composition. Diets were also analysed by sex (for forkbeard), areas (coastal and offshore banks), as well as by depth range (0-100, 101-200, 201-300 and 301-600 m). Data from 1996 and 1997 were combined for all comparisons because the ranks of IRI values for all prey categories between
years were correlated (forkbeard: rs= 0.83, P<
0.04; conger eel: insufficient number of prey categories to perform the analysis).
STATISTICAL ANALYSIS
Differences in the rankings of IRI values for prey categories between three or more groups (e.g. four size classes) were tested for significance with Kendall Coefficient of Concordance (ω) (SIEGEL &CASTELLEN 1988). For paired groups (e.g. males and females), the Spearman rank correlation (rs) was used (FRITZ 1974, ZAR 1996).
RESULTS DIET COMPOSITION
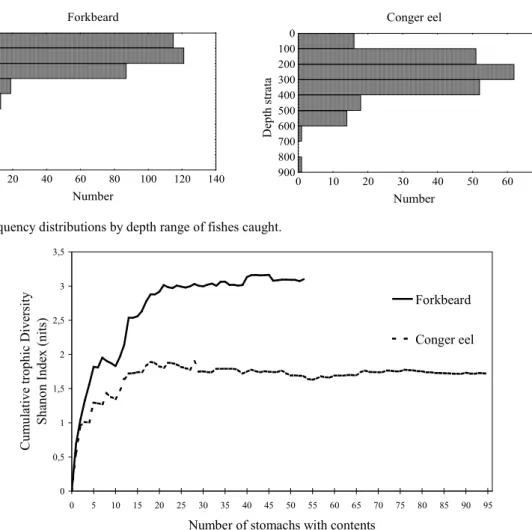
Forkbeard was caught over a bathymetric range of 20 to 500 m, with a single fish caught at 600 m depth (Fig. 1). From the 356 individuals examined 237 had everted stomachs (66.6%), 15 had only bait (4.2%) and 51 (14.3%) had empty stomachs. A total of 53 individuals (14.9%) had stomachs with contents. The fishes with food present ranged in total length (TL) from 24.0 to 64.0 cm. Percent of stomachs with contents was higher for females (22%) than for males (13%) (χ2= 4.64, P< 0.031). Conger eel occurred from 20 to 800 m depth, but the majority of the fishes were caught down to 600 m (Fig. 1). From the 215 conger eels examined, 22 had only bait (10.2%), 74 (34.4%) had empty stomachs and 24 (11.2%) had eaten hooked fish on the longline. A total of 95 individuals (44.2%) had stomachs with contents. The sizes of the fish with food varied from 73 to 186 cm (TL).
Recognisable prey from over 40 different taxa were identified from the 253 prey found in the stomachs of forkbeard. From the conger eel stomachs, 215 prey were identified belonging to about 17 different taxa. Cumulative trophic diversity curves (Fig. 2) achieve asymptotic values quickly, with about 20 stomachs analysed for each species.
The diet of forkbeard consist of a wide variety of organisms dominated by fishes, which occurred in 77.4% of all stomachs with food and represented 80.3% of its weight.
Forkbeard Number D ep th s tr at a 0 100 200 300 400 500 600 700 800 900 0 20 40 60 80 100 120 140 Conger eel Number D ep th s tr at a 0 100 200 300 400 500 600 700 800 900 0 10 20 30 40 50 60 70
Fig. 1. Frequency distributions by depth range of fishes caught.
0 0,5 1 1,5 2 2,5 3 3,5 0 5 10 15 20 25 30 35 40 45 50 55 60 65 70 75 80 85 90 95
Number of stomachs with contents
C u m u la ti v e tr o p h ic D iv er si ty S h an o n I n d ex ( n it s) Forkbeard Conger eel
Fig. 2. Variation of cumulative trophic diversity of forkbeard and conger eel diet with sample size. Forkbeard also feed on reptant and natant
decapods, which occurred in 52.8% and 26.4% of all stomachs, respectively. The principal fish prey found were Macroramphosus scolopax (IRI = 881.8), Capros aper (IRI=841.2), Anthias anthias (IRI=65.6), Chromis limbata (IRI=51.8) and several myctophids such as Ceratoscopelus maderensis (IRI=21.8), Lampanyctus pusillus (IRI=8.0), L. festivus (IRI=4.6) (Table 1). From the decapods identified Homola barbata (IRI=122.3), Liocarcinus corrugatus (IRI=92.7) and Galathea sp. (IRI=60.8) were the most important prey items. Mysids were found in only two forkbeards, but the large number of individuals justify the high value of IRI calculated (IRI=37.8). According to the ecological categories of prey, forkbeard feed
primarily on benthopelagic fishes and epibenthic decapods, and then on benthic and mesopelagic fishes (Table 2).
The diet of conger eel is essentially composed of fish, which occurred in 94.7% of stomachs, accounted for 98.6% of total contents by weight and constituted 96.8% of all food items counted. Other prey types, including decapods and cephalopods contributed little to the overall diet of conger eel. The principal fish prey found were C. aper (IRI=3527.9) and M. scolopax (IRI=555.8), but some important commercial fish species were also identified, such as, Lepidopus caudatus (IRI=36.7), Helicolenus dactylopterus (IRI=31.0) and Pagellus bogaraveo (IRI=29.0) (Table 3).
whether or not these fishes were caught as a result of natural feeding behaviour. Conger eel also consumed some pelagic fishes, such as Scomber japonicus (IRI=36.3) and Trachurus picturatus (IRI=20.4). Conger eel feed almost exclusively on benthopelagic, pelagic and benthic fishes (Table 2).
DIET COMPOSITION BY FISH SIZE CLASSES
Diet composition was relatively homogeneous among forkbeard size groups with fishes and decapods being the main prey categories (Fig. 3). Multiple correlations of IRI values for prey categories by fish length group were significant (ω= 0.87, P< 0.0036). However, there was an apparent increasing consumption of M. scolopax and C. aper, and a declining of crabs of the families Portunidae, and Xanthidae with increasing fish length (Table 4).
For conger eels, fishes compose the diet of all size groups. The consumption of all prey items by all size groups, in terms of percent numbers, were very similar (Table 5). C. aper was the most consumed prey of all size groups except for the 115-134.9, where M. scolopax were the most consumed fish.
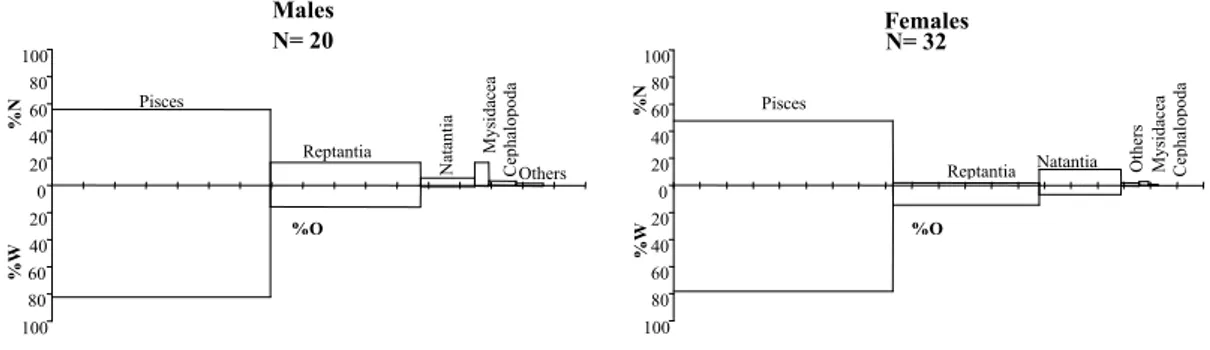
DIET COMPOSITION BY SEX
For forkbeard, the Spearman rank correlation of IRI values for males and females was significant (rs= 0.90, P< 0.037)
representing that the overall diet of males and females was similar (Fig. 4). However, males consumed more M. scolopax and females more C. aper and Portunidae (Table 4). The apparent selection for mysids by the males may not accurately represent the true dietary trend, as only two forkbeards consumed a large number of mysids.
Table 1
Number (n), percent number (%N), percent weight (%W), number of predators with one item (nP) frequency of occurrence (%O) and Index of Relative Importance (IRI) calculated for each prey item found in the stomachs of forkbeard P. phycis. Items n %N %W nP %O IRI Algae 3 1.2 0.4 3 5.7 9.21 Crustacea Mysidacea unidentified 25 9.8 0.2 2 3.8 37.81 Decapoda Natantia Plesionika heterocarpus 1 0.4 0.1 1 1.9 1.00 Plesionika edwardsii 1 0.4 2.7 1 1.9 5.88 Plesionika sp. 1 0.4 0.4 1 1.9 1.46 Pandalina profunda 2 0.8 0.0 2 3.8 3.00 Processa sp. 1 0.4 0.0 1 1.9 0.77 Periclimenes cf. scriptus 1 0.4 0.0 1 1.9 0.78 Caridea unidentified 1 0.4 0.0 1 1.9 0.80 Natantia unidentified 11 4.3 0.1 7 13.2 58.91 Decapoda Reptantia Scyllarus arctus 2 0.8 0.4 2 3.8 4.47 Galathea sp. 9 3.5 1.8 6 11.3 60.80 Munida sp. 1 0.4 1.4 1 1.9 3.45 Paramola cuvieri 4 1.6 0.1 2 3.8 6.34 Homola barbata 11 4.3 4.9 7 13.2 122.34 Latreillia elegans 1 0.4 0.1 1 1.9 0.97 Liocarcinus corrugatus 18 7.1 2.7 5 9.4 92.66 Liocarcinus marmoreus 3 1.2 0.2 2 3.8 5.04 Bathynectes maravigna 3 1.2 2.0 3 5.7 18.09 Pilumnus inermis 3 1.2 0.2 2 3.8 5.19 Xantho sp. 4 1.6 0.4 2 3.8 7.55 Brachyura unidentified 6 2.4 0.9 4 7.5 24.78 Crustacea unidentified 2 0.8 0.1 2 3.8 3.47 Gastropoda 1 0.4 0.0 1 1.9 0.74 Cephalopoda unidentified 1 0.4 0.0 1 1.9 0.81 Octopodidea 4 1.6 0.1 2 3.8 6.32 Pisces Paralepididae unidentified 1 0.4 0.3 1 1.9 1.39 Ceratoscopelus maderensis 6 2.4 1.5 3 5.7 21.76 Diaphus sp. 1 0.4 0.1 1 1.9 0.91 Gonichthys coccoi 2 0.8 0.2 1 1.9 1.92 Lampanyctus festivus 3 1.2 0.0 2 3.8 4.55 Lampanyctus pusillus 5 2.0 0.2 2 3.8 8.04 Myctophum punctatum 1 0.4 0.1 1 1.9 0.93 Myctophidae unidentified 2 0.8 2.1 2 3.8 11.06 Capros aper 27 10.6 19.1 15 28.3 841.21 Macroramphosus scolopax 42 16.5 19.4 13 24.5 881.81 Helicolenus dactylopterus 2 0.8 3.4 2 3.8 15.89 Anthias anthias 4 1.6 10.0 3 5.7 65.58 Apogon imberbis 1 0.4 1.8 1 1.9 4.07 Epigonus sp. 1 0.4 0.0 1 1.9 0.76 Pagrus pagrus 1 0.4 0.2 1 1.9 1.20 Chromis limbata 3 1.2 8.0 3 5.7 51.79 Coris julis 1 0.4 3.6 1 1.9 7.49 Foetorepus phaeton 1 0.4 0.3 1 1.9 1.40 Cubiceps gracilis 1 0.4 0.5 1 1.9 1.64 Pisces unidentified 27 10.6 9.4 16 30.2 603.89 Rock 1
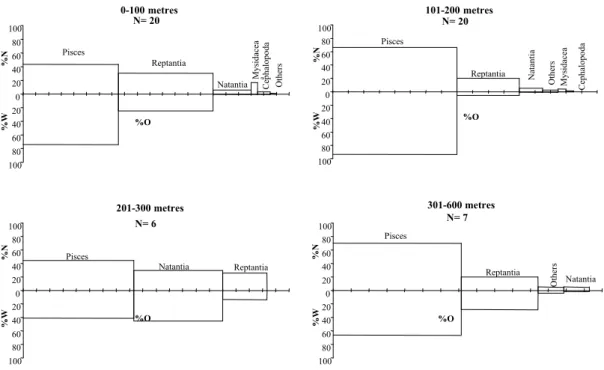
DIET COMPOSITION BY DEPTH RANGE
Fishes and decapods reptants dominated the diet of the forkbeard for the depth ranges study,
except for depth interval 201-300 where natants were the second most important category (Fig. 5). Multiple correlations of IRI values for prey categories between the four depth intervals were significant (ω= 0.86, P< 0.0042).
Table 2
Number (n), percent number (%N), percent weight (%W), number of predators with each item (nP), frequency of occurrence (%O) and Index of Relative Importance (IRI) calculated for each ecological category of prey found in the stomachs of forkbeard P. phycis and conger eel C. conger.
Forkbeard Conger eel
Ecological categories n %N %W nP %O IRI n %N %W nP %O IRI
Algae 3 1.2 0.4 3 5.7 9.2 Zoo-plankton 25 9.8 0.2 2 3.8 37.8 1 0.4 0.4 1 1.1 1.0 Gastropods 1 0.4 0.0 1 1.9 0.7 Benthic decapods 73 28.7 18.6 30 56.6 2681.1 1 0.4 0.4 1 1.1 1.0 Mesopelagic decapods 1 0.4 0.4 1 1.1 1.0 Cephalopods 5 2.0 0.1 3 5.7 11.9 3 1.3 0.9 3 3.2 7.2 Benthic fishes 11 4.3 19.4 8 15.1 357.8 6 2.7 2.7 6 6.3 34.9 Benthopelagic fishes 72 28.3 46.5 25 47.2 3529.3 154 70.0 69.7 67 70.5 9857.3 Pelagic fishes 7 3.1 3.2 6 6.3 40.7 Mesopelagic fishes 22 8.7 5.0 8 15.1 206.9 1 0.4 0.4 1 1.1 1.0 Unidentified fishes 28 11.0 9.4 17 32.1 655.9 42 19.0 19.5 28 29.5 1138.4 Unidentified decapods 14 5.5 0.3 10 18.9 109.5 1 0.4 0.4 1 1.1 1.0 Table 3
Number (n), percent number (%N), percent weight (%W), number of predators with one item (nP) frequency of occurrence (%O) and Index of Relative Importance (IRI) calculated for each prey item found in the stomachs of conger eel, C. conger.
Items n %N %W nP %FO IRI
Crustacea Isopoda 1 0.45 0.21 1 1.05 0.7 Decapoda Natantia 1 0.45 0.01 1 1.05 0.5 Decapoda Reptantia 2 0.90 0.83 2 2.11 3.65 Paguridae unidentified 1 0.45 0.54 1 1.05 1.0 Liocarcinus tuberculatus 1 0.45 0.29 1 1.05 0.8 Cephalopoda 3 1.35 0.39 3 3.16 5.50 Pisces Ceratoscopelus maderensis 1 0.62 0.04 1 1.05 0.7 Macrouridae unidentified 1 0.45 0.67 1 1.05 1.2 Gadella maraldi 1 0.45 1.91 1 1.05 2.5 Capros aper 91 41.01 26.02 50 52.63 3527.9 Macroramphosus scolopax 53 23.89 5.45 18 18.95 555.8 Helicolenus dactylopterus 2 0.90 13.82 2 2.11 31.0 Trachurus picturatus 5 2.25 2.58 4 4.21 20.4 Pagellus acarne 1 0.45 1.29 1 1.05 1.8 Pagellus bogaraveo 3 1.35 7.83 3 3.16 29.0 Mullus sp. 2 0.90 4.10 2 2.11 10.5 Labridae unidentified 1 0.45 1.03 1 1.05 1.6 Foetorepus phaeton 1 0.45 0.69 1 1.05 1.2 Lepidopus caudatus 4 1.80 6.91 4 4.21 36.7 Scomber japonicus 2 0.90 16.32 2 2.11 36.3 Pisces unidentified 42 18.93 9.90 28 29.47 849.7
TL 23-34.9 (cm) 100 80 60 40 20 0 20 40 60 80 100 %O Pisces Reptantia N at an ti a % W % N O th er s M y si d ac ea C ep h al o p o d a TL 35-44.9 (cm) 100 80 60 40 20 0 20 40 60 80 100 %O Pisces Reptantia Natantia % W % N M y si d ac ea TL 45-54.9 (cm) 100 80 60 40 20 0 20 40 60 80 100 %O Pisces Reptantia N at an ti a % W % N Others TL 55-64.9 (cm) 100 80 60 40 20 0 20 40 60 80 100 %O Pisces Reptantia Natantia % W % N
Fig. 3. Relative importance of prey categories in the diet of forkbeard, P. phycis, ranked from highest IRI values for each length class. Where %N is the percent number, %W the percent weight and %O the frequency of occurrence of the prey category. Each tick mark of %O represents 10%.
Table 4.
The percentage number of food categories consumed by forkbeard, P. phycis of each of the four length groups and by females (F) and males (M).
Total length (cm) Sex
20-29.9 30-39.9 40-49.9 50-69.9 F M Mysidacea 5.3 31.9 0.0 0.0 3.3 20.2 Caridea *1 1.8 7.2 2.3 0.0 3.3 3.7 Galatheidae 0.0 5.8 11.4 3.1 6.6 3.7 Homolidae 5.3 11.6 4.5 6.3 7.7 6.4 Portunidae 22.8 11.6 6.8 0.0 19.8 5.5 Xanthidae 8.8 1.4 2.3 0.0 5.5 1.8 Other reptants *2 1.8 0.0 6.8 0.0 3.3 0.9 Cephalopoda 8.8 0.0 0.0 0.0 1.1 3.7 Myctophidae 29.8 1.4 2.3 3.1 9.9 9.2 Caproidae 3.5 14.5 15.9 25.0 18.7 9.2 Macroramphosidae 1.8 8.7 36.4 59.4 13.2 27.5 Serranidae 1.8 1.4 4.5 0.0 0.0 3.7 Other Fishes *3 8.8 4.3 6.8 3.1 7.7 4.6 n 12 16 18 7 32 20
Prey items that occurred in less than 3 predators were grouped in a higher taxonomic level. *1 included Palaemonidae, Pandalidae, Processidae. *2 included Latreillidae, Majidae and Scyllaridae. *3 the combined percentage of Paralepididae, Apogonidae, Callionymidae, Epigonidae, Pomacentridae, Labridae, Sparidae, Scorpaenidae, Nomeidae.
Males N= 20 100 80 60 40 20 0 20 40 60 80 100 %O Pisces Reptantia N at an ti a % W % N Others M y si d ac ea C ep h al o p o d a Females N= 32 100 80 60 40 20 0 20 40 60 80 100 %O Pisces Reptantia Natantia % W % N O th er s M y si d ac ea C ep h al o p o d a
Fig. 4. Relative importance of prey categories in the diet of P. phycis, ranked from highest Index of Relative Importance (IRI) values for males and males. Where, %N is the percent number, %W the percent weight and %O the frequency of occurrence of the prey category. Each tick mark of %O represents 10%.
Table 5.
The percentage number of food categories consumed by conger eel, C. conger of each of the five length groups. Total length (cm) 73-94.4 95-114.9 115-134.9 135-154.9 155-186 Isopoda 0.0 0.0 0.0 3.1 0.0 Penaeidea 0.0 2.0 0.0 0.0 0.0 Reptants *1 0.0 3.9 0.0 0.0 0.0 Cephalopoda 5.6 0.0 1.6 0.0 0.0 Myctophidae 0.0 0.0 0.0 3.1 0.0 Caproidae 50.0 60.8 42.9 56.3 62.5 Macroramphosidae 27.8 25.5 46.0 18.8 0.0 Scorpaenidae 5.6 0.0 1.6 0.0 12.5 Carangidae 11.1 2.0 1.6 0.0 12.5 Sparidae 0.0 2.0 1.6 3.1 12.5 Trichiuridae 0.0 2.0 1.6 3.1 0.0 Other fishes *2 0.0 2.0 3.2 12.5 0.0 n 15 31 24 14 8
Prey items that occurred in less than 3 predators were grouped in a higher taxonomic level, except for Myctophidae. *1 included Paguridae and Portunidae. *2 the combined percentage of Callionymidae, Macrouridae, Labridae, Mugilidae, Moridae and Scombridae.
0-100 metres N= 20 100 80 60 40 20 0 20 40 60 80 100 %O Pisces Reptantia Natantia % W % N O th er s M y si d ac ea a C ep h al o p o d a 101-200 metres N= 20 100 80 60 40 20 0 20 40 60 80 100 %O Pisces Reptantia Nat an ti a % W % N O th er s M y si d ac ea C ep h al o p o d a 201-300 metres N= 6 100 80 60 40 20 0 20 40 60 80 100 %O Pisces Reptantia Natantia % W % N 301-600 metres N= 7 100 80 60 40 20 0 20 40 60 80 100 %O Pisces Reptantia Natantia % W % N O th er s
Fig. 5. Relative importance of prey categories in the diet of forkbeard, P. phycis, ranked from highest Index of Relative Importance (IRI) values by depth range. Where, %N is the percent number, %W the percent weight and %O the frequency of occurrence of the prey category. Each tick mark of %O represents 10%.
However, depth-related differences may occur for some food items (Table 6). Consumption of M. scolopax, Myctophidae, Cephalopoda and Mysidacea decreased in percent number with increasing depth. The Caridea were mainly consumed in the depth interval 201-300 m. An apparent increase in consumption of Caproidea occurred with depth.
For conger eel, the two most consumed fish items showed an identical depth related trend as the one observed in forkbeard. M. scolopax were the most consumed prey, in terms of percent number, at depths less than 200 m (Table 7). Below 200 m, C. aper was the most consumed prey. No apparent trends related to depth were observed for all the other prey items.
DIET COMPOSITION BY COASTAL / OFFSHORE AREAS
For forkbeard, rankings of IRI values for coastal
areas and offshore banks were not significantly correlated (rs= 0.81, P= 0.05). However, these
differences were mainly observed for the less important prey categories such as cephalopods, mysids and “others” (Fig. 6). In what concerns prey items, some important differences were found (Table 6). Myctophids were only found in forkbeards from the offshore banks, while mysids were only found in forkbeards from coastal areas. M. scolopax fishes and Xanthidae and Galatheidae were more important in terms of percent number in coastal areas, while cephalopods were more important in the offshore banks.
The diet of conger eel from coastal areas and offshore banks was very similar (Table 7). However, Sparidae and Scorpaenidae were only consumed in coastal areas, while Myctophidae were only consumed on offshore banks. Contrary to what was observed for forkbeard, conger eel consumed more M. scolopax on the offshore banks than in coastal areas.
Table 6
The percentage number of food categories consumed by forkbeard, P. phycis in four depth strata and in two areas: coastal and off shore banks.
Depth (m) Areas 0-100 101-200 201-300 301-600 Coastal Banks Mysidacea 18.6 5.5 0.0 0.0 21.0 0.0 Caridea *1 0.8 0.0 33.3 7.1 2.5 4.8 Galatheidae 6.8 3.6 0.0 0.0 7.6 1.2 Homolidae 1.7 7.3 46.7 14.3 5.9 9.6 Portunidae 20.3 0.0 0.0 0.0 4.2 22.9 Xanthidae 0.8 9.1 0.0 7.1 5.9 0.0 Other reptants *2 1.7 1.8 0.0 7.1 2.5 1.2 Cephalopoda 3.4 1.8 0.0 0.0 0.8 4.8 Myctophidae 14.4 3.6 6.7 0.0 0.0 24.1 Caproidae 1.7 30.9 0.0 57.1 14.3 12.0 Macroramphosidae 22.9 25.5 6.7 0.0 28.6 9.6 Serranidae 0.8 5.5 0.0 0.0 2.5 1.2 Other Fishes *3 5.9 5.5 6.7 7.1 4.2 8.4 n 2 20 6 7 31 22
Prey items that occurred in less than 3 predators were grouped in a higher taxonomic level. *1 included Palaemonidae, Pandalidae, Processidae. *2 included Latreillidae, Majidae and Scyllaridae. *3 the combined percentage of Paralepididae, Apogonidae, Callionymidae, Epigonidae, Pomacentridae, Labridae, Sparidae, Scorpaenidae, Nomeidae. Coastal areas N= 31 100 80 60 40 20 0 20 40 60 80 100 %O Pisces Reptantia N at an ti a % W % N O th er s M y si d ac ea C ep h al o p o d a Offshore banks N= 22 100 80 60 40 20 0 20 40 60 80 100 %O Pisces Reptantia Natantia % W % N C ep h al o p o d a
Fig. 6. Relative importance of prey categories in the diet of forkbeard, P. phycis, ranked from highest Index of Relative Importance (IRI) values for coastal areas and offshore banks. Where, %N is the percent number, %W the percent weight and %O the frequency of occurrence of the prey category. Each tick mark of %O represents 10%.
Table 7
The percentage number of food categories consumed by conger eel, C. conger in four depth strata and in two areas: coastal and off shore banks.
Depth (m) Areas 0-100 101-200 201-300 301-650 Coastal Banks Isopoda 0.0 3.1 0.0 0.0 1.7 0.0 Penaeidea 0.0 0.0 1.3 0.0 0.0 0.8 Reptants *1 0.0 3.1 0.0 2.1 1.7 0.8 Cephalopoda 0.0 0.0 2.5 0.0 3.4 0.8 Myctophidae 0.0 0.0 0.0 2.1 0.0 0.8 Caproidae 35.7 28.1 48.1 79.2 50.0 52.5 Macroramphosidae 42.9 50.0 38.0 2.1 13.8 38.1 Scorpaenidae 0.0 0.0 2.5 2.1 5.2 0.0 Carangidae 0.0 6.3 0.0 6.3 5.2 1.7 Sparidae 0.0 6.3 2.5 0.0 6.9 0.0 Trichiuridae 0.0 0.0 2.5 2.1 3.4 1.7 Other fishes *2 21.4 3.1 2.5 4.2 8.6 2.5 n 8 21 28 38 32 63
Prey items that occurred in less than 3 predators were grouped in a higher taxonomic level, except for Myctophidae. *1 included Paguridae and Portunidae. *2 the combined percentage of Callionymidae, Macrouridae, Labridae, Mugilidae, Moridae and Scombridae.
DISCUSSION
The low number of stomachs with contents found may be due to several reasons. The fact that the longline is a passive fishing method suggests that fish fed to satiation have a low response to bait odour (LØKKEBORG et al. 1995). This means that fishes with full stomachs will tend not to eat the bait. Another reason is the occurrence of everted stomach caused by the expansion of the swim bladder when fish is brought to surface. Regurgitation of stomach contents, caused by stress, may also occur for fishes caught by hook. This fishing method may also influence the quality of the stomach contents as the hauling can take several hours and the contents may become completely digested and non-identifiable. This sampling method can induce errors in estimation of fullness and food consumption. The longline is also size selective (GRÓS et al. 1995, BJORDAL & LØKKEBORG 1996) which explain the lack of small individuals in the sample. Nevertheless, the demersal cruise surveys in the Azores are the only way to obtain abundant biological data for growth, reproduction, food habits and genetic studies, of several fish species.
Assessing diversity within diets of fish is a difficult task (MAUCHLINE & GORDON 1985), nevertheless, has been used to assess the adequacy of the samples (GROSSMAN et al. 1980). The Shannon index used in the accumulative
trophic diversity achieved asymptotic values, showing that the diet of both species is adequately defined in terms of trophic diversity and ecological constitution.
The forkbeard is a generalised carnivore that preys on a variety of motile organisms, mainly fish and decapods. Conger eel seems to be more specialised in prey upon fishes. Our study has confirmed earlier observations, which described the diet of forkbeard as generalised and composed principally of fishes and decapods (PAPACONSTANTINOU & CARAGITSOU 1989). SEDBERRY & MUSICK (1978) noted a similar diet for the congener Phycis chesteri, which fed on a variety of demersal and pelagic fishes and crustaceans. The dominance of fishes in the diet of conger eel was also reported from the Cantabrian Sea (OLASO & RODRÍGUES-MARÍN, 1995), for fishes with more than 35 cm (TL), and to the central eastern Mediterranean (CAU & MANCONI 1984). Most of the species consumed by both predators live in benthopelagic and benthic environments. Therefore, it is apparent that they are not dependent on live bottom organisms for prey, since they can feed on benthopelagic and even pelagic and mesopelagic preys. Both species are known for displaying nocturnal activity as described by COHEN et al. (1990) for forkbeard and by WIRTZ (1994) for conger eel. The depth distribution of the forkbeards that ate myctophids may indicate
feeding at night. The five myctophid species identified are known for displaying vertical migrations. They are found in less than 200 m depth at night but all are below during the day (NAFPAKTITIS 1977). However, our results did not clarify daily activity of these predators. Thus, it would be desirable to sample in a near future, during 24 hours periods in order to understand the daily feeding activity of these predators.
Although a total of about 40 prey items was identified in the diet of the forkbeard and 20 prey items in the conger eel diet, both species showed a high selection for two fish species (M. scolopax and C. aper). The availability and relative abundance of these two fish species is probably seasonal, being more frequent during the spring and summer (Lisa Borges pers. comm., IPIMAR, Lisboa, Portugal). Thus, this result should be carefully interpreted, and shows the necessity to sample throughout the year in order to adequately describes the trophic resources utilised by these two fish species.
The main components of the diet did not vary significantly with fish length. All the forkbeards examined in this study were greater than 23 cm in length. However, for forkbeard the increasing consumption of C. aper and M. scolopax and the decreasing consumption of portunid and xanthid crabs might be related to a larger prey size preference as the predator grows. OLASO & RODRÍGUES-MARÍN (1995) also reported that the relative importance of decapods appeared to be greater in the diet of conger eel smaller than 35 cm (TL). This result may not be compared with our data, because of the lack of individuals less than 73 cm (TL). Therefore length related variations in the diet of both species might occur in younger and smaller fishes.
For forkbeard, the diet of both sexes was very similar, indicating that there are no apparent prey preferences related to sex. Other studies did not analyse sex related differences on feeding habits, which did not permit a comparison with our results.
Small area and depth related differences in diet composition of forkbeard and conger eel were observed. For both species, the peaks in abundance related to depth of Macroramphosus scolopax and Capros aper as prey match their peaks in abundance in the environment (EHRICH
1984, QUÉRO 1984). The occurrence of myctophids was only observed at the offshore banks, which may reflect the distribution of these preys in the environment. These differences reflect the opportunistic foraging behaviour of both species and suggest that is difficult to make generalisations about feeding habits of any particular species. It seems likely that observed patterns are determined by the responses of fish to habitat-specific features, such as assemblages of prey and predators, as well as by the absolute and relative abundance of potential food items in the environment. However, no data are available on the abundance of the prey organisms in the Azores environment, and therefore it is not clear whether the fish species in this study select their prey preferentially or exploit the food resources in a density-dependent manner.
In conclusion, this study has shown that the general preference of these predators is fish prey. And also that it is difficult to generalise feeding habits of fishes and the necessity of sampling consistently during the year and during 24 hours periods.
ACKNOWLEDGEMENTS
This work is part of a more comprehensive study, which is being carried out at the Department of Oceanography and Fisheries of the University of the Azores with support of the European Union (Design optimisation and implementation of demersal cruise survey in the Macaronesian Archipelagos. Study contracts DG XIV/94/034 and 95/095). Thanks are due to João Gonçalves, Ricardo Serrão Santos, Filipe Porteiro for help with identification of stomach contents, Helena Krug for help with identification of otoliths and to Pedro Afonso, Susana Lopes, José Branco, Angela Canha, Rogério Feio, Domitília Rosa and Jorge Oliveira, as well as all the R/V "Arquipélago" crew members for working overtime at sea.
REFERENCES
BJORDAL, A. & S. LØKKEBORG 1996. Longlining. Fishing News Books, Blackwell Sciences Ltd, U.K. 156 pp.
CAU,A.&P.MANCONI 1984. Relationship of feeding, reproductive cycle and bathymetric distribution in Conger conger. Marine Biology 81 (2): 147-151. COHEN,D.M.,T.INADA,T.IWAMOTO &N.SCIALABBA
1990. FAO Species catalogue. Vol. 10 Gadiform fishes of the world (Order Gadiformes). An annotated and illustrated catalogue of cods, hakes, grenadiers and other gadiform fishes known to date. FAO Fisheries Synopsis 125 (10). Rome, FAO. 442 pp.
EHRICH, S. 1984. Macroramphosidae. Pp. 627 in: P.J. WHITEHEAD, M. -L. BAUCHOT, J.-C. HUREAU, J.
NIELSEN & E. TORTONESES (Eds). Fishes of the North-eastern Atlantic and Mediterranean. Vol. III UNESCO, Paris.
ESTÁCIO S., A.MENDONÇA,H.KRUG,G.MENEZES,J. BRANCO &M.R.PINHO (submitted). Aspects of the reproduction of six demersal species captured in the Azores Archipelago. Arquipélago. Life and Marine Sciences.
FRITZ, E.S. 1974. Total diet comparison in fishes by Spearman rank correlation coefficients. Copeia 1974 (1): 210-214.
GLENN, C.L.& F.J.WARD 1968. "Wet" weight as a method for measuring stomach contents of Walleys, Stizostedion vitreum vitreum. Journal of the Fisheries Research Board of Canada 25 (7): 1505-1507.
GRÓS, M.P., H.M. SILVA & G.M. MENEZES 1995. Estudo preliminar da selectividade do anzol ao goraz, Pagellus bogaraveo e ao boca-negra, Helicolenus dactylopterus. Arquivos do DOP Série Estudos Nº 5/95: 12 pp.
GROSSMAN, G.D., R. COFFIN & P.B. MOYLE 1980. Feeding ecology of the bay goby (Pisces: Gobidae). Effects of behavioural, ontogenetic and temporal variation on diet. Journal of Experimental Marine Biology and Ecology 44: 411-429.
HURTUBIA, J. 1973. Trophic diversity measurement in sympatric predatory species. Ecology 19: 36-58. HYSLOP, E.J. 1980. Stomach contents analysis - a
review of methods and their applications. Journal of Fish Biology 17: 411-429.
LØKKEBORG, S., B.L. OLLA, W.H. PEARSON & M.W. DAVIS 1995. Behavioural response in sablefish Anoplopoma fimbria, to bait odour. Journal of Fish Biology 46: 142-155.
MAUCHLINE, J. & J.D.M. GORDON 1985. Trophic diversity in deep-sea fish. Journal of Fish Biology 26: 527-535.
MENEZES,G.,H.M.SILVA,H.KRUG,E.BALGUERIAS,J. DELGADO, J.G. PÉREZ, I.L. SOLDEVILLA, J.L. NESPEREIRA,D.CARVALHO &J.S.MORALLES 1998. Design optimisation and implementation of demersal cruises surveys in the Macaronesian
Archipelagos. Final report. Arquivos do DOP. Série Estudos 3/98: 162 pp.
MENEZES,G.&H.M.SILVA 1999. Cruzeiros dirigidos às espécies demersais nos Açores. Relatório da 16ª Semana das Pescas dos Açores, 1997: 195-218. NAFPAKTITIS,B.G.,R.H.BACKUS,J.E.CRADDOCK,R.
L.HAEDRICH,B.H.ROBISON &C.KARNELLA 1977. Family Myctophidae. Pp. 13-265 in: R.H. GIBBS JR. (Ed.). Fishes of the Western North Atlantic.
Number one. Part Seven: Order Iniomi
(Myctophiformes). Neoscopelidae and
Myctophidae and Atlantic mesopelagic
zoogeography. Memoir -Sears Foundation for Marine Research. Yale University, New Haven. OLASO,I.&E.RODRÍGUEZ-MARÍN 1995. Alimentación
de veinte especies de peces demersales pertenecientes a la división VIIIc del ICES. Otoño 1991. Informes Técnicos Instituto Español de Oceanografía 157: 56 pp.
PAPACONSTANTINOU, C. & E. CARAGITSOU 1989.
Feeding interactions between two sympatric species Pagrus pagrus and Phycis phycis around Kastellorizo island (Dodecanese, Greece). Fisheries Research 7: 329-342.
PINKAS, L.,M.S.OLHIPHANT & I.L.K.IVERSON 1971.
Food habits of albacore, bluefin tuna and bonito in California waters. California Fish and Game 152: 1-105.
QUERO, J.-C. 1984. Caproidae. Pp. 777-779 in: P.J. WHITEHEAD, M.-L. BAUCHOT, J.-C. HUREAU, J. NIELSEN & E. TORTONESES (Eds). Fishes of the North-eastern Atlantic and Mediterranean. Vol. III UNESCO, Paris.
SEDBERRY, G.R. & J.A. MUSICK 1978. Feeding strategies of some demersal fishes of the continental slope and rise off mid-Atlantic coast of the USA. Marine Biology 44: 357-375.
SIEGEL,S&N.J.CASTELLEN JR.1988. Nonparametric statistics for the behavioural sciences. (2nd Edition). McGraw-Hill Book Co. 399 pp.
SILVA, H.M. 1985. Age and growth of forkbeard Phycis phycis (Linnaeus, 1766) in Azorean waters. ICES CM 1985/G: 72. 11pp.
SILVA H.M. 1986. Reproduction of the forkbeard Phycis phycis (Linnaeus, 1766) in Azorean waters. ICES CM 1986/G: 60.
SILVA, H.M. & G.M. MENEZES 1996. An intensive fishing experiment in the Azores (Study contract 94/028). Arquivos do DOP, Série: Relatórios Internos 1/96: 19 pp.
SILVA, H.M., H.M. KRUG & G.M. MENEZES 1998. Proposta de gestão dos recursos demersais dos Açores. Relatório da 14ª e 15ª Semana das Pescas dos Açores, 1995 e 1996: 195-218.
WIRTZ, P. 1994. Underwater guide, Fish, Madeira, Canary and Azores. Verlag Stephanie Naglschmid. Stuttgart. 159 pp.
ZAR, J.H. 1996. Biostatistical analysis (3rd edition). Prentice Hall International Editions. N.J. 662 pp. Accepted 8 October 1999