Comparing the effectiveness of
different organic growth strategies
for Instagram
Catarina Macedo Pereira
Dissertation written under the supervision of Pedro Rosa
Dissertation submitted in partial fulfilment of requirements for the MSc in
Management with Specialization in Strategic Marketing, at the Universidade
2 ABSTRACT
Title: “Comparing the effectiveness of different organic growth strategies for Instagram” Author: Catarina Macedo Pereira
Instagram is becoming one of the top social networks, having recently reached 1 billion monthly active users. Marketers use it not only for advertising, but also for building up a substantial follower base of potential consumers who can provide insights and grant credibility to the brand. As such, digital marketing experts debate on which is the best strategy to grow organically on Instagram, i.e. to attract followers without relying on paid advertisement. This dissertation empirically tests three organic growth strategies through an experiment performed on two Instagram brand pages – one with an emotional appeal to its content, and the other with a rational appeal. The first strategy (Content strategy) is based on posting content regularly, while also using hashtags and geotags. The other two strategies (Engagement and Follow) rely on interacting with target users, either by writing comments or following them. Throughout four weeks, the daily impacts on follower count and average engagement were tracked.
The results indicate that the Follow strategy is the most effective at generating follower growth, for both emotional and rational brands. On the other hand, having a strong Content strategy is the best way to foster engagement. A key finding is that the growth and engagement generated by the strategies are significantly higher for the emotional brand. This implies that marketers must present their brand’s Instagram content in a more sentimental way, adapting to the visual-oriented culture of this social network, otherwise the results of their organic marketing efforts will not reach their true potential.
Keywords: Social Media, Instagram, Organic Growth, Followers, Engagement, Digital Interactions, Firm-Generated Content
3 SUMÁRIO
O Instagram está a tornar-se numa das principais redes sociais, tendo atingido recentemente mil milhões de usuários ativos mensais. Os profissionais de marketing utilizam-na para fins publicitários, mas também para construir uma rede de seguidores, que concede credibilidade à marca e pode gerar insights. Como tal, vários especialistas debatem qual será a melhor estratégia para crescer organicamente nesta rede, ou seja, atrair seguidores sem depender de investimentos em publicidade.
Esta dissertação testa empiricamente três estratégias de crescimento orgânico através de uma experiência realizada em duas páginas de Instagram - uma com apelo emocional e a outra com apelo racional. A primeira estratégia (“Content strategy”) é baseada na publicação regular de conteúdos, usando hashtags e geotags. As outras estratégias (“Engagement” e “Follow”) focam-se em interações com usuários-alvo, através de comentários ou follows. Ao longo de quatro semanas, os impactos diários na contagem de seguidores e no nível médio de engagement foram monitorizados.
Os resultados indicam que a estratégia Follow é a mais eficaz a gerar crescimento de seguidores, tanto para marcas de apelo emocional como racional. Por outro lado, uma forte estratégia de conteúdo é a melhor forma de promover engagement. A principal descoberta é que os acréscimos de followers e engagement gerados pelas estratégias são significativamente mais altos para a marca emocional do que para a racional. Isso implica que os conteúdos das marcas devem ser apresentados de uma forma mais sentimental, adaptando-se à cultura visual do Instagram, para que os esforços de marketing orgânico sejam mais produtivos.
Palavras-chave: Redes Sociais, Instagram, Crescimento Orgânico, Digital, Seguidores, Interações, Conteúdos
4 ACKNOWLEDGEMENTS
I would like to express my gratitude to my supervisor, Pedro Rosa, for allowing me to perform an experiment, and for guiding me through all the stages of the dissertation process. He constantly demonstrated a willingness to help, which made writing the thesis much easier. Additionally, I want to thank my family and my friends – especially Lourenço, Rodolfo and Joana. Not only were they always available to debate on my work, but they also provided a great deal of moral support. Their encouragement played a crucial part in the completion of this dissertation.
5 TABLE OF CONTENTS
CHAPTER 1: INTRODUCTION ... 10
1.1. Background and problem statement ... 10
1.2. Aims and scope ... 11
1.3. Research methods ... 12
1.4. Relevance ... 12
1.5. Dissertation outline ... 13
CHAPTER 2: LITERATURE OVERVIEW ... 14
2.1. Instagram ... 14
2.2. Social media metrics and customer behavior ... 14
2.3. Organic growth on Instagram ... 15
2.4. Online interactions between brand and consumer ... 16
2.5. Firm-generated content on social media ... 17
2.6. Content appeal ... 19 2.7. Conclusions ... 20 CHAPTER 3: METHODOLOGY ... 22 3.1. Research approach ... 22 3.2. Research methods ... 22 3.2.1. Definition of strategies ... 22 3.2.2. Definition of variables ... 23 3.2.3. Sample description ... 24 3.2.4. Experimental design ... 24 3.2.5. Data collection ... 24 3.2.6. Dataset preparation ... 25 3.2.7. Statistical analyses ... 26
3.2.8. Assumptions of the model ... 27
CHAPTER 4: RESULTS AND DISCUSSION ... 29
4.1. Descriptive statistics ... 29
4.2. Analyzing follower growth ... 30
4.3. Analyzing average engagement ... 32
4.4. Interaction with brand appeal ... 34
4.4.1. Effect of brand appeal on follower growth ... 35
4.4.2. Effect of brand appeal on average engagement ... 38
6
CHAPTER 5: CONCLUSIONS AND LIMITATIONS ... 43
5.1. Conclusions and implications... 43
5.2. Limitations and future research ... 45
7 TABLE OF FIGURES
Figure 1 - Layout of the dataset ... 25 Figure 2 - Split-plot of follower growth ... 37 Figure 3 - Split-plot of the logarithm of average engagement ... 40
8 TABLE OF TABLES
Table 1 - Dependent and independent variables ... 26
Table 2 - Skewness, kurtosis, and normality tests for the dependent variables ... 27
Table 3 - Descriptive statistics for follower growth ... 29
Table 4 - Descriptive statistics for average engagement ... 29
Table 5 - Mauchly's test of sphericity ... 30
Table 6 - Tests of within-subjects effects ... 31
Table 7 - Pairwise comparisons ... 32
Table 8 - Mauchly's test of sphericity ... 33
Table 9 - Test of within-subjects effects ... 33
Table 10 - Pairwise comparisons ... 34
Table 11 - Descriptive statistics by brand ... 35
Table 12 - Tests of within-subjects effects ... 36
Table 13 - Pairwise comparisons ... 37
Table 14 - Tests of within-subjects effects ... 38
9 TABLE OF ANNEXES
Annex 1 – Output of Mixed ANOVA on "growth" with "day of the week"... 51
Annex 2 – Output of Mixed ANOVA on "average engagement" with "day of the week" ... 53
Annex 3 – Test of homogeneity of variances of "growth" by "brand" ... 55
Annex 4 - Test of sphericity on "growth" within strategies ... 55
Annex 5 - Test of homogeneity of variances of "engagement" by "brand" ... 55
Annex 6 - Test of homogeneity of variances of "ln(engagement)" by "brand" ... 56
Annex 7 - Test of sphericity of "ln(engagement)" within strategies ... 56
10 CHAPTER 1: INTRODUCTION
The first chapter starts with a contextualization of the topic of this dissertation, followed by the aim and research questions. Furthermore, the research methods used to answer these questions are described. Lastly, the managerial and academic relevance of this topic is explained, and the outline of the dissertation is drawn.
1.1. Background and problem statement
The rise of social media has completely transformed the field of Marketing. Not only because consumers are now more informed and connected than ever, but also due to the fact that they have integrated these tools into their daily lives. Therefore, brands use social media as a platform to raise awareness, communicate their products and services, and interact with their target audience on a daily basis.
Social media marketers are constantly looking for new ways to gain more followers on their brand pages. This fixation on follower count is justified due to several reasons. To name a few important ones: Firstly, studies have shown that consumers’ online behavior does, in fact, have an effect on offline behavior. The simple act of following a brand’s social media page enhances brand evaluations and purchase intentions (Beukeboom, Kerkhof, & de Vries, 2015), and can even increase conversions (Mochon, Johnson, Schwartz, & Ariely, 2017). Furthermore, the number of followers is seen by consumers as an indicator of reputation and quality – it is crowd-based social proof (Yeoman, 2014). Hence it is a factor that potential consumers may take into consideration when making purchase decisions. Lastly, more followers mean more consumers to interact with, which can potentially bring valuable insights to the firm regarding what consumers desire – brands can perform social listening, collect product feedback, conduct surveys and polls, among other activities (Bernazzani, 2018).
Instagram is a social network that is particularly appealing to marketers due to its quickly growing popularity. Currently one of the largest social networking sites, it has over 1 billion active monthly users (Statista, 2018a). Additionally, 200 million users visit at least one business profile daily (Instagram, n.d.-b), which means there is a massive amount of people that brands can reach to build their follower base.
In order to find the best way to foster growth, brands need to consider the tools available to them. One way that brands can boost the exposure of their posts is to invest in advertising. In fact, global ad spending on Instagram is projected to reach 6.84 billion US dollars in 2018 (Statista, 2018b). There are various formats to choose from, such as photo, video, carousel or
11 stories (Instagram, n.d.-a). However, it is not mandatory to use paid strategies to thrive on Instagram. Organic social media marketing consists of using the free tools provided by a social media platform to publish relevant content and engage consumers, creating a community (Gurd, 2018). In order to grow this community quickly and effectively, digital marketers can engage in growth hacking techniques. Growth hacking generally refers to the process of experimenting with different strategies across various areas of the business (such as marketing, product development, distribution channels, and others) as a means to rapidly grow the customer base, and in digital marketing this concept can also be applied in the context of social media (Patel, n.d.). Brands continuously innovate and experiment with their social media strategies, so that they can grow their follower count (Patel, n.d.).
On Instagram, there are plenty of organic growth strategies that a brand can implement. On one hand there are content-based strategies, which consist of utilizing certain growth tactics on the brand’s posts. This includes, for example, using hashtags and geotags, sharing user-generated content, or doing a giveaway (Potratz, 2018). On the other hand, interaction-based strategies require the brand to act social, taking the time to engage with consumers, with the aim of converting them to followers. As such, brands may respond to their comments, follow their accounts, interact with their posts, or direct message them (Vaynerchuk, 2017; WorkMacro, 2018). Tools have been developed in order to automate these tasks on a large scale, for example FollowLiker for following and engaging, and Instazood for direct messaging (Bost, 2018). In conclusion, there are many organic growth strategies that a brand can experiment with, depending on the amount of effort it is willing to exert. Although the number of suggestions is abundant, there is lack of evidence on the actual effectiveness for either of these strategy types, in terms of the measurable impact that they have on follower count and interaction metrics. 1.2. Aims and scope
The main aim of this dissertation is to compare the effectiveness of different organic growth strategies for Instagram, in terms of the number of additional followers generated, on two different brand pages. Secondarily, it also analyzes the impact of these strategies on the average engagement of the brands’ posts. In order to achieve these objectives, the following research questions are addressed:
RQ1 – Which of the proposed organic growth strategies can generate the most followers? RQ2 – Which of the proposed organic growth strategies can generate the most engagement? RQ3 – Are the impacts of the strategies on followers and engagement moderated by the appeal (emotional versus rational) of the brand page?
12 The selected strategies were implemented throughout four weeks and their daily impacts on followers and average engagement were measured.
Additionally, this dissertation intends to detect if there are differences in effectiveness according to the appeal of the brand page’s content. Two Instagram pages were chosen to integrate this study, which will be referred to as brand A and brand B for the purpose of confidentiality. Brand A promotes historical locations in Lisbon and its content has an emotional appeal. Brand B is an electronics retailer with a rational appeal.
Both of these entities are clients of VAN, the digital marketing agency that collaborated on this study by applying the strategies to the two Instagram pages and providing the performance data for the analyses.
Even though there is a wide array of possible organic growth strategies, this dissertation is limited to three – two interaction-based strategies and one content-based strategy – deriving from the literature overview in Chapter 2. The focus of this dissertation is on organic strategies, which means they are unpaid. Paid strategies, i.e. those that involve investing in ads and promoted posts, are not the object of this analysis.
1.3. Research methods
The research approach utilized in this dissertation is an explanatory (causal) approach. An experiment was specifically designed to answer the research questions, which means the information collected is considered primary data. Throughout four weeks, three different organic growth strategies were tested (one per week), while also including a base week (the first week) in which no growth strategy was in place. The experiment was performed on the Instagram pages of two brands with different content appeals – emotional versus rational. For each page, the daily change in the number of followers and in average engagement, as well as the number of work hours invested in each strategy, were tracked. Ultimately, the main variable in focus is daily follower growth. Secondarily, this dissertation also analyzes the average engagement of the brand page. The data was treated quantitatively, performing all statistical analyses on SPSS.
1.4. Relevance
In subsection 1.1. a case was made for the importance of increasing follower count on social media: Following a brand can affect consumer’s offline behavior, and the number of followers
13 can serve as an indicator of brand quality, as well as facilitate access to valuable consumer insights. Overall, growth is a desirable objective for anyone managing a brand on Instagram. This particular research focusing on organic growth may seem only relevant to brands with reduced marketing budgets that cannot afford to advertise, but the reality is that growing on Instagram through ads can be generally quite ineffective. Among the possible ad objectives on Instagram, the platform does not provide an option to optimize ads for follower acquisition (Facebook, n.d.-a), as opposed to Facebook which allows running Page Promotions with the goal of obtaining followers (Facebook, n.d.-b). Therefore, this dissertation presents an alternative route, by testing concrete organic growth strategies that can be easily replicated on any brand’s Instagram page. Ultimately, from a managerial perspective, these results provide practical insight to marketers who want to grow their follower counts, without having to solely rely on possibly fruitless advertising.
In terms of academic relevance, previous research analyzed content characteristics and brand-consumer interactions on social media in general, without focusing on any particular social network (de Vries, Gensler, & Leeflang, 2012; Hudson, Huang, Roth, & Madden, 2016). This dissertation contributes to the scarce amount of literature focusing on the specificities of interactions and content on Instagram specifically, by using these concepts as the foundations for the strategies. Additionally, this dissertation provides some insight on consumer behavior on social media, specifically regarding reciprocal behavior, as it investigates whether consumers reciprocate other users’ actions (follow someone back, or like a picture of theirs in return, etc.).
1.5. Dissertation outline
Chapter 2 provides an overview of the relevant literature surrounding the topic of organic growth on Instagram, including information on the importance of interactions and firm-generated content. These two concepts are the foundations for the organic growth strategies proposed in the last section of the chapter, which contains the main conclusions and a conceptual framework. Chapter 3 thoroughly describes the research approach and methods used for data collection, dataset preparation and statistical analyses. Chapter 4 presents and discusses the results obtained through the analysis of the data. Finally, Chapter 5 states the main conclusions, as well as the limitations of this dissertation, ending with some possible directions for future research on the topic of organic growth on Instagram.
14 CHAPTER 2: LITERATURE OVERVIEW
2.1. Instagram
Launched in 2010, Instagram is a photo and video-sharing platform, in which users can edit and upload content. Additionally, they can interact with other people’s posts by liking or commenting. Users can follow and be followed, which is equivalent to a subscription that allows them to receive on their feed the most recent content from those that they are following (Stec, 2018).
As opposed to other social networks such as Facebook and Twitter, Instagram does not allow text-only content, therefore creating a very visual-oriented culture (Lee, Lee, Moon, & Sung, 2015). The main motivations for the use of this network are social interaction, archiving personal memories through photography, self-expression, escaping from the reality of the offline world, and peeking on other people’s daily lives (Lee et al., 2015).
In 2012, as Instagram was gaining momentum and its potential was recognized, Facebook decided to acquire its rival for $1 Billion dollars (Rusli, 2012). Since the acquisition, the platform has continued to innovate by implementing new functionalities, such as video-sharing (Instagram Press, 2013), Stories (Instagram Press, 2016a) and IG TV (Instagram Press, 2018). It has gained a spot among the most popular social networking sites, ranking in sixth place, with 1 Billion monthly active users as of July 2018 (Statista, 2018c). Many brands have joined Instagram and incorporated this social network into their digital marketing plan – as of 2017, there were 25 Million active business profiles on Instagram (Statista, 2017). More than 200 Million users visit at least one of these profiles daily (Instagram, n.d.-b).
2.2. Social media metrics and customer behavior
Marketing managers may raise questions regarding the effectiveness of social media. Do the resources invested in this type of marketing actually translate into sales? What is the relation between social media metrics and offline customer behavior? Plenty of past research has studied this issue. Mochon, Johnson, Schwartz and Ariely (2017) performed an experiment on the Facebook page of a health insurer’s wellness program, in which current customers were asked to follow the page and then kept track of point count on the program, discovering that these customers had engaged more in health & wellness activities and therefore increased their number of accumulated points. The simple act of following a brand page – even when instructed by the brand instead of being initiated by the customer – can enhance brand evaluations and purchase intentions (Beukeboom et al., 2015). As discovered by Stephen and Galak (2012),
15 earned social media in the form of online community posts can even provide a greater sales elasticity than traditional earned media (i.e. publicity and press coverage), when the results are adjusted for the frequency of occurrence of each event – the small, yet positive effects of frequent community posting activity add up in the long-term and create a significant impact on sales. Despite the large reach of traditional media, social media outlets are often topic-specific and therefore engage more high-involvement consumers who are interested in that specific niche, ultimately driving sales more efficiently (Stephen & Galak, 2012). Further research by Kumar, Bezawada, Rishika, Janakiraman, and Kannan (2016) demonstrated a positive effect of firm-generated social media content on customer spending and cross-buying, especially when the receptivity of the post (i.e. the total number of likes, comments, and shares on that post) is high.
In conclusion, consumers’ actions on social media – namely following and engaging with a brand – can have an impact on brand evaluations and purchase behavior, which validates the increasing investment that marketers have directed towards social network media. These findings reinstate the importance of growing the number of followers a brand possesses and creating an active community that engages with the brand’s content through likes, comments and shares.
2.3. Organic growth on Instagram
Organic growth is a term more commonly used in a business context, defined as an “increase in a company's sales and profits that is a result of developing its own business activities, rather than buying other companies” (Cambridge Dictionary, n.d.). However, this term can also be transposed into the digital marketing world, in the context of social media. Organic social media marketing consists of using the free tools provided by a social media platform to publish relevant content and engage consumers, creating a community (Gurd, 2018). Therefore, organic growth is a simple concept that revolves around growing the number of followers of a brand profile by utilizing unpaid strategies at the company’s disposal, rather than paying the social network to advertise the page.
Although businesses are investing heavily on paid promotions – in fact, global ad spending on Instagram is projected to reach 6.84 Billion dollars in 2018 (Statista, 2018b) –, ads may not be the most effective route for a brand if its goal is to stimulate follower growth. As opposed to Facebook, Instagram does not provide an option to define follower acquisition as the objective for an ad (Facebook, n.d.-a, n.d.-b). This means that even though the ad reaches a large audience, it cannot be optimized for follower growth.
16 To accelerate organic growth, brands will often engage in growth hacking. This term generally refers to the process of experimenting with different strategies across various areas of the business (such as marketing, product development, distribution channels, and others) as a means to rapidly grow the customer base (Patel, n.d.). In a social media context, brands continuously innovate and experiment with different digital growth hacking tactics in their social media strategies, so that they can grow their follower count quickly through a process of trial and error (Patel, n.d.).
There are many digital marketing gurus and blog sources sharing possible organic growth strategies to implement on Instagram. On one hand, there are content-based strategies, which focus on the creation of regular content that implements certain growth tactics such as scheduling posts, using hashtags and geotags, sharing user-generated content, or including a giveaway (Potratz, 2018). On the other hand, interaction-based strategies require the brand to act social, taking the time to engage with consumers, with the aim of converting them to followers. As such, brands may respond to their comments, follow their accounts, interact with their posts, or direct message them (Vaynerchuk, 2017; WorkMacro, 2018). Constant interaction may seem quite time-consuming, but tools have been developed in order to automate these tasks on a large scale, for example, FollowLiker for following and engaging, and Instazood for direct messaging (Bost, 2018).
Previous research on online interactions and on firm-generated content in a more general manner can bring some insight on the principles at the core of these two types of strategies. The following sections 2.4. and 2.5. shed some light on this research.
2.4. Online interactions between brand and consumer
Social media, as the name suggests, is primarily a platform for engaging in social interactions. Consumers are able to communicate with each other but also with brands. A pioneering exploratory study in this field by Brodie, Ilic, Juric, and Hollebeek (2013) used “netnography” to better understand how consumers engage in virtual brand communities and ultimately discovered that there are five sub-processes of customer engagement: learning, sharing, advocating, socializing, and co-developing. For brands, it is important to foster active engagement on their pages, as it has favorable consequences on consumer loyalty and satisfaction, consumer empowerment, connection and emotional bonding, trust and commitment (Brodie et al., 2013). Positive effects were also verified by Hudson, Huang, Roth, and Madden (2016) in their study focusing on the U.K., U.S., and France, in the sense that
17 cross-national evidence was found to support the claim that social media use has a positive influence on brand relationship quality and word-of-mouth communications.
However, Homburg, Ehm, and Artz (2015) state that even though the returns for relative firm engagement on consumer sentiment (i.e. favorable consumer statements on online posts) are positive, these returns diminish as firm engagement increases. In fact, at very high levels of firm engagement, consumer sentiment can be hindered, in some cases. Therefore, brands should be careful regarding the amount of interaction they engage in, despite the clear benefits that these interactions can provide.
On social media, one simple way to interact with other users that does not require much effort, is to leave a like on their content. Surma (2016) presented evidence for reciprocity behavior on Facebook, through an experiment in which it was discovered that the number of reciprocity likes sent by a user has a significant positive impact on the number of likes received by the user in reciprocation of his actions. Simply put, this means that if a user likes other people’s posts, this user will also receive more likes to his/her own posts as people return the favor to him/her. 2.5. Firm-generated content on social media
Firm-generated content refers to the “messages posted by firms on their official social media pages” (Kumar et al., 2016, p. 3). Due to social media’s interactive nature, it is argued that firm-generated content can help develop and strengthen mutually beneficial relationships between the firm and consumers (Kumar et al., 2016).
Previous research has studied brand content popularity on social media, providing insight on what determines the number of likes, comments, and shares of firm-generated content.
In order to enhance the number of likes, brands can take certain actions, for example making posts highly vivid instead of just plain text, producing content with medium interactivity such as a video rather than a question, making sure the post is at the top of the brand page, and monitoring the share of positive comments, given that they have a favorable effect on likes (de Vries et al., 2012).
If obtaining more comments is the desired goal, then naturally the key is to make posts highly interactive for instance by asking a question which will prompt consumers to answer in the comment section (de Vries et al., 2012). It is also important to note that the existing share of both positive and negative comments on the brand post will also generate more comments, as users will be interested in the discussion and will also want to express their opinions (de Vries et al., 2012). This means that negative comments can actually foster further engagement from consumers trying to defend the brand from that negativity.
18 If the objective is to increase the number of shares, using pleasantly-sounding rhetorical figures such as word repetition and alliteration, posting a sequence of complementary messages, and using images are a few possible ways to achieve this (Villarroel Ordenes et al., 2018). Additionally, users usually respond better to informational or emotional messages over calls-to-action, because the latter exert a demand and consumers don’t like being told what to do (Villarroel Ordenes et al., 2018).
However, all of these findings need to be processed with caution, as these studies usually focus on social networks such as Facebook and Twitter, rather than on the more recent and more visually-oriented platforms like Instagram.
Despite the divergences across social networks, the benefits of effective firm-generated content are clear. As already stated previously in subsection 2.3., firm-generated social media content has been proven to have a positive effect on customer spending and cross-buying (Kumar et al., 2016). This effect is especially strong when the receptivity of the post (i.e. the total number of likes, comments, and shares on that post) is high (Kumar et al., 2016). This is why it is so important for marketers to focus on the growth of social media metrics such as engagement. On Instagram specifically, two easy tactics to increase the engagement on a piece of content is to use hashtags, as well as geotags (i.e. location tagging). Users are able to search and explore hashtags and locations, which means these features have the potential of boosting the exposure of a brand’s post, since it will be displayed on the hashtags’ pages, instead of just the brand’s profile page. A study by Simply Measured (2014) demonstrated that posts with at least one hashtag receive on average 13% more engagement, while posts with a location receive 79% more engagement than those without. The issue of how many hashtags to use, however, is quite ambiguous. Although Instagram allows a maximum of 30 hashtags per post, several studies have been investigating the ideal number of hashtags, coming to very different results. For example, Social Fresh reported seven hashtags, while Track Maven’s report stated that using nine hashtags was ideal, and Klear’s study found that two was the most effective number of hashtags (Benyamini, 2017; Hutchinson, 2016; Keath, 2014).
Additionally, the current algorithm needs to be taken into consideration, as it plays a role in the reach of the brand post. According to an Instagram Press release, users’ feeds stopped being presented in chronological order and instead are based on three main factors (Instagram Press, 2016b): First, the interest that the user will predictably have in the content, given previous interactions with similar content, and the hashtags used. Second, relationship with the account that posted, defined by how frequently the user interacts with that account through likes,
19 comments and direct messages. Third, timeliness of the post, because the algorithm will always favor more recent posts.
2.6. Content appeal
In previous literature, many authors have analyzed sets of social media posts, in an attempt to pinpoint which type of content appeal – often also referred to as message strategy – is linked to a higher number of followers and increased engagement rates.
Ashley and Tuten (2015) studied the creative strategies of a sample of top brands on social media, analyzing the types of appeals they use in their content, and found that functional appeals are the most frequently applied by these successful brands. Nevertheless, according to the results, functional appeals did not have a significant impact on any measure of social media performance – such as number followers or engagement –, while emotional appeals were negatively correlated with the engagement score (Ashley & Tuten, 2015). Additionally, it was discovered that user image appeals (for example “you’re worth it”) were positively correlated with the number of Facebook followers, and experiential appeals (i.e. appealing to the senses) were positively correlated with engagement (Ashley & Tuten, 2015).
Building on these findings, as well as on other scientific literature about this topic, Tafesse & Wien (2018) developed a more comprehensive theoretical framework in which the various appeals were condensed into three main message strategies – informational, transformational, and interactional – that can be paired through different media types (text, image, video). These strategies are based on the classic advertising typologies – informational (rational appeals) and transformational (affective appeals) (Tafesse & Wien, 2018). However, it also includes a third strategy – the interactional strategy – that reflects the interactive nature of social media, in which a brand may share user-generated content or speak directly to the consumer about current events, personal conversations, and experiences with the product/service (Tafesse & Wien, 2018). This study’s findings indicated that the transformational message strategy was the most effective in generating customer engagement, because it elicits an affective response from the consumer (Tafesse & Wien, 2018). Informational and interactional strategies are less effective but can be optimized when paired with the transformational message strategy – for example, informational text with a transformational video (Tafesse & Wien, 2018).
It is important to note that the difference in findings across the scientific papers is partly due to the fact that the message strategies (i.e. brand post appeals) are categorized differently in the studies: For instance, Ashley & Tuten (2015) distinguished between emotional, user image, and
20 experiential appeals, while for Tafesse & Wien (2018) all of these appeals fall under one category, namely transformational messages.
All in all, the topic of which appeal is more effective in generating followers and engagement is very ambiguous, since the definition of the appeals in the previous studies, and their findings, are quite inconsistent. Additionally, both of the scientific papers analyzed data from Facebook, which means that no conclusions can be drawn on their applicability in the context of Instagram. Especially given the fact that Instagram is a platform with a much more visual nature, oriented towards aesthetic and beautiful pictures.
2.7. Conclusions
Taking into consideration the fact that social media follower count has a proven positive impact on offline customer behavior, brands should in fact invest their resources into growing their social media pages, as it will bring economic benefits. Instagram is a booming social network right now which provides the opportunity for brands to reach a lot of potential customers. Nevertheless, there is much to be learned regarding how to interact with consumers on this platform, how to effectively formulate content, and ultimately how to achieve growth organically without relying on advertising. This dissertation aims to bring some insight on possible organic growth strategies for Instagram by conducting an experiment that empirically tests their effectiveness.
As such, three organic growth strategies were selected to be tested in this study, namely two interaction-based strategies (Follow and Engagement strategies) and one content-based strategy (Content strategy). The Follow and Engagement strategies are predicted to be effective on the basis of reciprocity. The aim is to receive reciprocal follows from the target users that the brand starts following, and reciprocal likes and comments from those that the brand engages with. Regarding the Content strategy, all posts will have a location tag and hashtags, which are tactics proven to increase engagement.
Besides the strategies, a further relevant factor is the appeal of the page’s content. The literature overview revealed quite ambiguous results regarding the effectiveness of the various appeals. Hence, this research intends to provide an original input to this ongoing debate, by studying this issue in the context of Instagram, and checking whether the brand page’s appeal acts as a moderator in the effectiveness of the strategies. In terms of the appeals defined, the two brands in this study were simply categorized as either having an emotional or a rational appeal. In conclusion, this dissertation tests the effectiveness of three different organic growth strategies in generating followers and engagement on Instagram. Additionally, the analysis goes
21 even more in-depth by including the brand page’s appeal – emotional versus rational – in order to verify whether this factor influences results.
22 CHAPTER 3: METHODOLOGY
The third chapter starts by describing the research approach employed. Then it is followed by the research methods utilized to define the strategies, the variables, as well as the population and the sample. Additionally, it includes the methods for designing the experiment, collecting the data, preparing the dataset, and performing the statistical analyses.
3.1. Research approach
This dissertation employs an explanatory research approach, meaning that it aims to establish causal relationships between variables (Saunders, Lewis, & Thornhill, 2009). As such, an experiment was designed in order to collect primary data that will aid in answering the Research Questions. This field experiment was conducted on Instagram throughout four weeks, for two different brand pages, gathering quantitative data on the performance of each strategy in a cross-sequential manner (i.e. a mix of cross-sectional and longitudinal time horizons). This means that data is collected at a specific point in time – in this case, daily – for two different pages, but then this observation is repeated every day throughout the week longitudinally.
3.2. Research methods 3.2.1. Definition of strategies
Three Instagram growth strategies were tested in this experiment. One of the strategies is content-based, while the remaining two are interaction-based, and they derive from the research done in the literature overview in Chapter 2. The current subsection explains in detail the strategies designed for this study.
First there is the Content strategy, which consists of regularly publishing two posts per day, while also implementing two growth tactics: using hashtags and geotags (i.e. location tagging). The number of hashtags used was 12 for each post. If the images used were photographed at a given location, it was then specifically geotagged on the post, but if it was just a promotional brand picture, the city of the brand’s origin would be geotagged as a more general location. Secondly, an Engagement strategy (interaction-based) was implemented, which consisted of engaging with 30 users every day. These users were specifically selected due to having recently posted in the target hashtags defined by the brand. The brand would leave a comment on that post, as well as a few likes on other pictures of the user.
Lastly, a Follow strategy (interaction-based) was tested. As the name suggests, this strategy consisted of simply following 150 potential followers per day, as opposed to engaging with
23 users’ content as was done in the Engagement strategy. The users deemed as potential followers were people who had liked the most recent posts from target pages, namely competitors that operate in the same product or service category as the brand. After two days, if the user had not followed the brand back, then the brand would proceed to unfollow that user, in order to not raise the “Following” count too much.
3.2.2. Definition of variables
In order to measure the effectiveness of each strategy in stimulating growth, this dissertation focuses on the number of followers generated by the strategy. Due to the fact that there are daily impacts affecting the analytics of a brand page, the evolution of follower count was measured on a daily basis. Therefore, the main performance metric of this study is number of followers generated per day.
Secondarily, this dissertation also intends to study the impact of each strategy on engagement. Engagement refers to likes and comments on a post. Therefore, in order to measure the changes in the engagement of the page generally – instead of focusing on a single post –, this study utilizes a measure of average engagement of the page. Average engagement is considered for the 5 most recent posts on the page. This metric was measured on a daily basis. Note that even though the 5 most recent posts keep changing as the brand posts new content, this is not a problem for the purpose of this study. The aim of incorporating an engagement variable is to see whether these growth strategies have some spill-over effect on interactions. Users are most likely to engage with the most recent posts, which are at the top of the page, instead of taking their time to scroll down to older posts. This is why the average engagement on the most recent 5 posts is a reasonable metric to track.
In sum, the dependent variables are daily follower growth, and average engagement also tracked on a daily basis.
When it comes to independent variables, the three strategies fall under this category. An additional factor to consider is the different appeals of each brand page, i.e. emotional or rational. Therefore, besides investigating the effectiveness of these strategies per se, the appeal of the brand’s content will also be included in the analysis as a moderating variable, in order to verify whether the choice of emotional versus rational appeal has an influence on the results of these strategies.
24 3.2.3. Sample description
The observations in this experiment are the daily variations in follower count and engagement, for each brand page included in the sample. Only two brands were chosen to integrate this four-week experiment. Hence this small sample is comprised of 56 observations (4 four-weeks x 7 days per week x 2 brand pages), representing 28 observations (daily variations in metrics) for each brand.
3.2.4. Experimental design
A 4 (types of strategies: base case, engagement strategy, content strategy, and follow strategy) by 2 (brand page appeal: rational vs emotional), repeated measures, mixed (within-between) factorial design was employed. Notice that even though there only are three organic growth strategies to test, a base case was included. During the week of the base case (the first week), the brands posted only three to four times per week, without any hashtags at all in the description of the posts, and refrained from interacting with other users. The observations from this first week serve as a baseline in order to compare the effectiveness of the organic growth strategies against the base case.
3.2.5. Data collection
This experiment had a duration of 4 weeks, lasting from the 15th of October until the 9th of
November 2018. As previously mentioned, each week there was a different strategy, starting with the Base case in the first week, then implementing the Content strategy, followed by the Engagement strategy, and lastly the Follow Strategy. This sequence allowed for a smooth progression from the most natural to the least natural type of strategy.
Two Instagram brand pages were specifically chosen to integrate this study on the basis of their diverging content appeals. They are both clients of VAN, a Lisbon-based digital marketing agency, and allowed the use of their profiles to perform this experiment.
The first page belongs to brand A, which promotes historical locations in Lisbon. It is very content-focused, with quality photography evoking nostalgia to those ancient places. Brand A’s page is considered to have an emotional appeal.
The second page belongs to a second-hand electronics retailer that also offers repair services, which was denominated brand B. As opposed to the first page, brand B’s content is much more objective, focused on promotions and hard-selling. Ultimately, brand B’s page possesses a rational appeal.
25 Naturally, the two brand pages should have a comparable starting point for the purpose of this study. The initial follower count is quite similar for the two pages: Brand A’s page had around 2800 followers, while Brand B’s page had 1700 followers, at the start of week 1.
3.2.6. Dataset preparation
Given the fact that this experiment was performed throughout four weeks and data was collected daily, in a longitudinal manner, the dataset needed to be organized in a way that a within-subjects analysis could be performed, comparing the strategies.
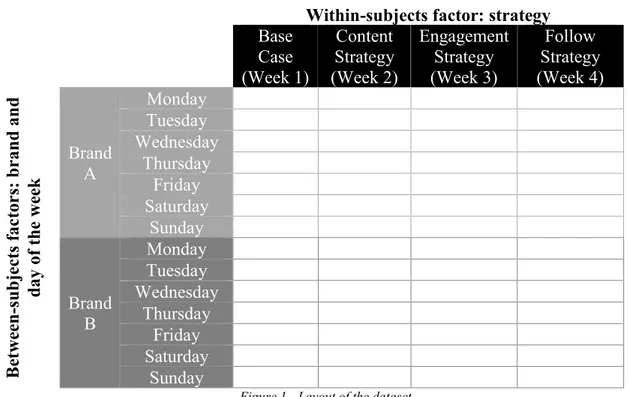
As such, each line of observation, i.e. each subject, is a day of the week (e.g. Monday, Tuesday, etc.) for which measures were taken at four different times – during week 1 (Base Case), week 2 (Content Strategy), week 3 (Engagement Strategy), and week 4 (Follow Strategy). These measures taken are the dependent variables in analysis, so follower growth and average engagement.
Another between-subjects factor that is later taken into consideration in Research Question 3 is the brand, which is a categorical variable with two levels (brand A or brand B). As such, the dataset has 14 lines of observations, i.e. subjects, representing the days, as illustrated in Figure 1.
Within-subjects factor: strategy
Base Case (Week 1) Content Strategy (Week 2) Engagement Strategy (Week 3) Follow Strategy (Week 4) B etw ee n -su b je cts f ac tor s: brand an d d ay of the w ee k Brand A Monday Tuesday Wednesday Thursday Friday Saturday Sunday Brand B Monday Tuesday Wednesday Thursday Friday Saturday Sunday
Figure 1 - Layout of the dataset
Consequently, there are 4 dependent variables measuring growth, and another 4 dependent variables measuring average engagement, making a total of 8 dependent variables. The
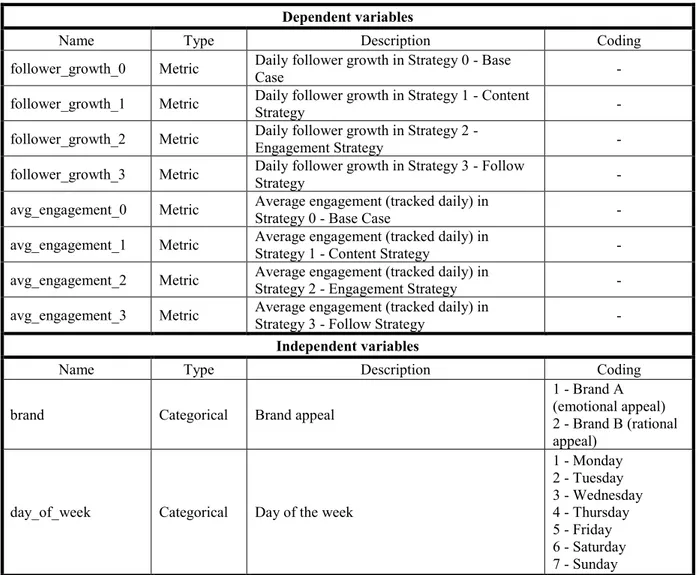
26 independent variables consist of brand and day of the week, both categorical variables. A more technical description of the variables and their coding is presented in table 1.
Table 1 - Dependent and independent variables Dependent variables
Name Type Description Coding
follower_growth_0 Metric Daily follower growth in Strategy 0 - Base Case -
follower_growth_1 Metric Daily follower growth in Strategy 1 - Content Strategy -
follower_growth_2 Metric Daily follower growth in Strategy 2 - Engagement Strategy -
follower_growth_3 Metric Daily follower growth in Strategy 3 - Follow Strategy -
avg_engagement_0 Metric Average engagement (tracked daily) in Strategy 0 - Base Case -
avg_engagement_1 Metric Average engagement (tracked daily) in Strategy 1 - Content Strategy -
avg_engagement_2 Metric Average engagement (tracked daily) in Strategy 2 - Engagement Strategy -
avg_engagement_3 Metric Average engagement (tracked daily) in Strategy 3 - Follow Strategy -
Independent variables
Name Type Description Coding
brand Categorical Brand appeal
1 - Brand A (emotional appeal) 2 - Brand B (rational appeal)
day_of_week Categorical Day of the week
1 - Monday 2 - Tuesday 3 - Wednesday 4 - Thursday 5 - Friday 6 - Saturday 7 - Sunday 3.2.7. Statistical analyses
The research questions will be addressed through statistical inference. Due to the fact that the data derives from the same subjects measured at different points in time, it is appropriate to apply a within-subjects analysis of variance (ANOVA), also known as a repeated measures ANOVA (Tabachnick & Fidell, 2013). In this case, the independent variable “strategy” was measured within subjects.
When between-subjects factors are added to this analysis in order to group observations according to a specific dimension, then it is considered a mixed between-within subjects ANOVA, sometimes also called a split-plot ANOVA (Tabachnick & Fidell, 2013). Since
27 between-subjects factors are also present in this dataset – specifically “brand” and “day of the week” – then the mixed ANOVA is the ideal model to use in case one of these independent variables needs to be incorporated into the analysis.
In conclusion, the answers to the posed research questions will be obtained exclusively through the utilization of repeated measures and mixed ANOVAs.
3.2.8. Assumptions of the model
Some important assumptions have to be tested in order to perform a within-subjects ANOVA, namely sphericity and normality. Sphericity is the condition where the variances of the differences between all combinations of related groups are equal, and normality refers to the (approximate) normal distribution of the dependent variables.
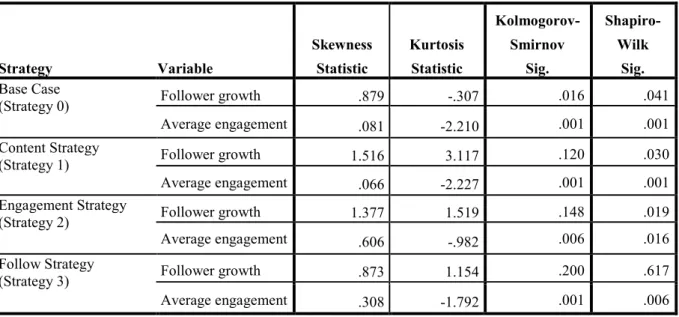
In the case of a mixed between-within-subjects ANOVA, an additional assumption needs to be checked, which is homogeneity of variances (i.e. equal variances) for all comparison groups. The normality tests (Kolmogorov-Smirnov and Shapiro-Wilk), as well as the skewness and kurtosis statistics, for the dependent variables “follower growth” and “average engagement” in each strategy, are presented in Table 2. The normality tests test the hypothesis that the variables follow a normal distribution. The kurtosis and skewness levels must be close to 0 in order to mimic a normal distribution.
Table 2 - Skewness, kurtosis, and normality tests for the dependent variables
Strategy Variable Skewness Statistic Kurtosis Statistic Kolmogorov-Smirnov Sig. Shapiro-Wilk Sig. Base Case
(Strategy 0) Follower growth .879 -.307 .016 .041
Average engagement .081 -2.210 .001 .001
Content Strategy
(Strategy 1) Follower growth 1.516 3.117 .120 .030
Average engagement .066 -2.227 .001 .001
Engagement Strategy
(Strategy 2) Follower growth 1.377 1.519 .148 .019
Average engagement .606 -.982 .006 .016
Follow Strategy
(Strategy 3) Follower growth .873 1.154 .200 .617
Average engagement .308 -1.792 .001 .006
Even though some statistics in the normality tests are statistically significant, the skewness and kurtosis values are not too far from normal. Additionally, ANOVAs are quite robust to
28 violations in the normality assumption. Taking this into consideration, the analysis proceeded with parametric tests.
The remaining assumptions, namely sphericity and homogeneity of variances (in cases of an ANOVA with a between-subjects factor), are tested at the start of each ANOVA. Therefore, the results for the Mauchly and Levene tests of each ANOVA are presented in Chapter 4 in the corresponding sub-sections for each different ANOVA model.
Lastly, it is important to note that, in cases of sphericity violations, robust tests had to be used instead. According to Girden (1992), the rule of thumb for choosing the appropriate robust test is the following: When the Greenhouse-Geiser epsilon in over 0.75, then the Huynh and Feldt test should be used. If it is below 0.75, then the Greenhouse-Geiser statistic is utilized.
29 CHAPTER 4: RESULTS AND DISCUSSION
The present chapter presents the results obtained through the analysis of descriptive statistics and inference. These results are subsequently summarized and discussed in order to fully answer the posed research questions.
4.1. Descriptive statistics
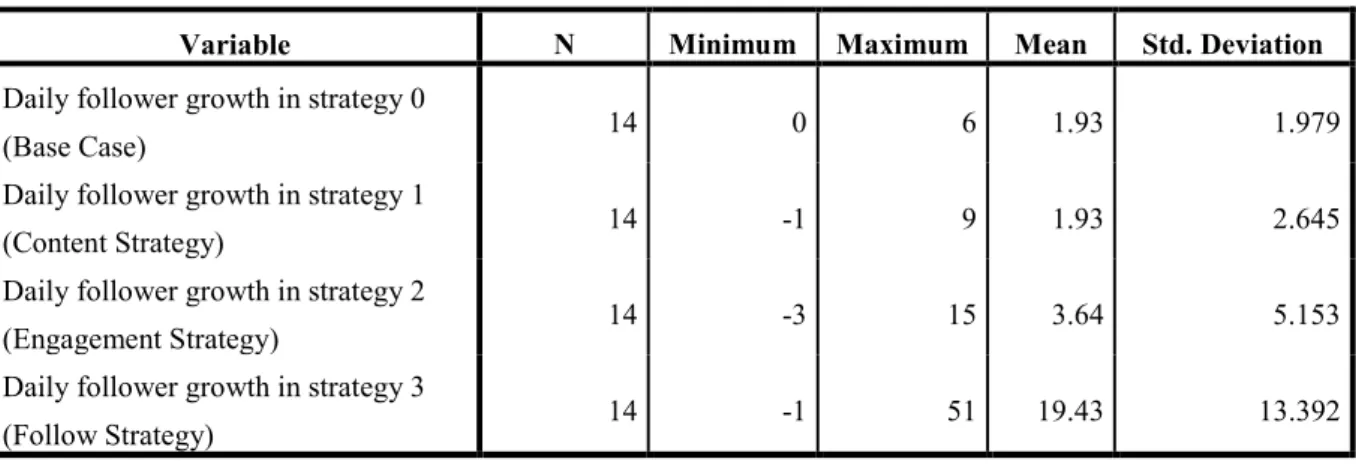
It is important to start out by taking a look at the general picture of the results. The following tables present the descriptive statistics – including minimum, maximum, mean and standard deviation – of the dependent variables follower growth (Table 3) and average engagement (Table 4), for each strategy.
Table 3 - Descriptive statistics for follower growth
Variable N Minimum Maximum Mean Std. Deviation
Daily follower growth in strategy 0
(Base Case) 14 0 6 1.93 1.979
Daily follower growth in strategy 1
(Content Strategy) 14 -1 9 1.93 2.645
Daily follower growth in strategy 2
(Engagement Strategy) 14 -3 15 3.64 5.153
Daily follower growth in strategy 3
(Follow Strategy) 14 -1 51 19.43 13.392
Table 4 - Descriptive statistics for average engagement
Variable N Minimum Maximum Mean Std. Deviation
Average engagement in strategy 0
(Base Case) 14 9 116 55.14 45.956
Average engagement in strategy 1
(Content Strategy) 14 13 169 80.71 66.670
Average engagement in strategy 2
(Engagement Strategy) 14 15 127 53.14 40.362
Average engagement in strategy 3
(Follow Strategy) 14 13 98 47.86 34.322
In terms of follower growth, this preliminary analysis indicates that the Follow strategy is the most effective, reaching a maximum value of 51, and generating on average about 19 followers per day.
30 Looking at the table for average engagement, it can be said that the Content strategy presents a higher mean than the other strategies (Mean=80.71).
Nevertheless, in order to conclusively test whether the differences between the means are statistically significant for each strategy, inference must be performed. The following subsections utilize repeated measures and mixed ANOVA models, so that more reliable conclusions can be drawn regarding the effectiveness of the strategies.
4.2. Analyzing follower growth
Before diving into an analysis that compares follower growth across strategies, it is important to understand whether the day of the week is impacting growth in any way. If the growth registered in this study was affected not only by the strategies in place, but also by significant day of the week effects, this would have to be taken into consideration when interpreting the results. A mixed ANOVA with within-subjects factor “strategy” and between-subjects factor “day of the week” was run in order to investigate this issue. This model, presented in Annex 1, revealed that the day of the week did not have a significant interaction effect (p=0.629) nor main effects (p=0.701) on the dependent variable growth. Consequently, this factor is not significant in the analysis of growth, and will be ignored from this point forward.
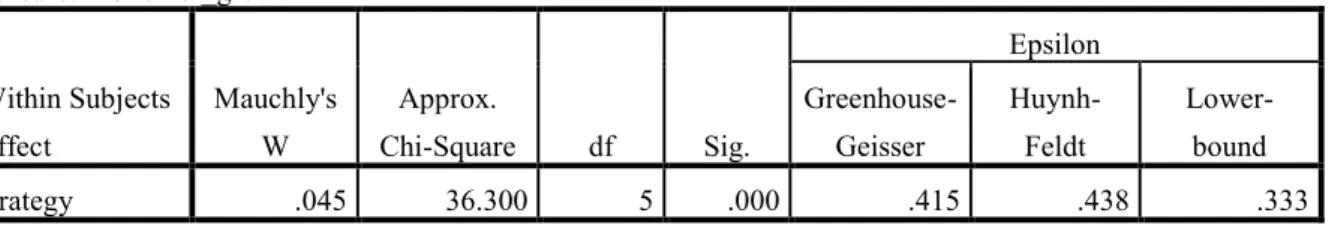
Focusing now on the impact of the strategies, a repeated measures ANOVA with within-subjects factor “strategy” was applied on the measures of follower growth. According to Mauchly’s test (Table 5) the sphericity assumption was violated (p<0.001) which means the Greenhouse-Geisser test must be used instead.
Table 5 - Mauchly's test of sphericity Measure: follower_growth Within Subjects Effect Mauchly's W Approx. Chi-Square df Sig. Epsilon Greenhouse-Geisser Huynh-Feldt Lower-bound strategy .045 36.300 5 .000 .415 .438 .333
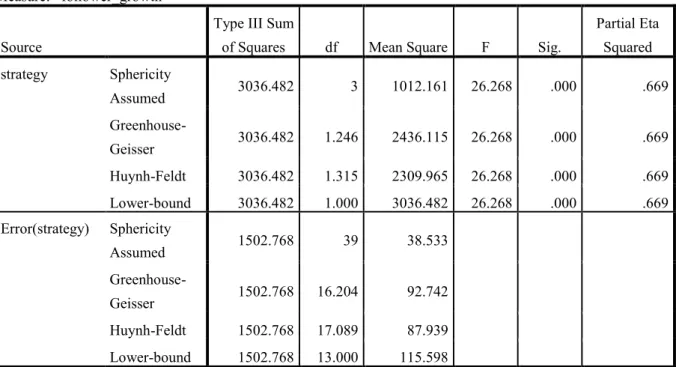
The Greenhouse-Geisser test has the same null hypothesis as the usual sphericity assumed statistic of ANOVA. It tests whether the means are equal for all levels of the independent variable – in this case, for all the strategies. Looking at the output of the within-subjects tests in Table 6, the Greenhouse-Geisser test reveals that there is a significant main effect of strategy
31 on follower growth, with F(1.246,16.204)=26.268 and p<0.001. Therefore, the hypothesis of having equal means among strategies is rejected.
Table 6 - Tests of within-subjects effects Measure: follower_growth
Source
Type III Sum
of Squares df Mean Square F Sig.
Partial Eta Squared strategy Sphericity Assumed 3036.482 3 1012.161 26.268 .000 .669 Greenhouse-Geisser 3036.482 1.246 2436.115 26.268 .000 .669 Huynh-Feldt 3036.482 1.315 2309.965 26.268 .000 .669 Lower-bound 3036.482 1.000 3036.482 26.268 .000 .669 Error(strategy) Sphericity Assumed 1502.768 39 38.533 Greenhouse-Geisser 1502.768 16.204 92.742 Huynh-Feldt 1502.768 17.089 87.939 Lower-bound 1502.768 13.000 115.598
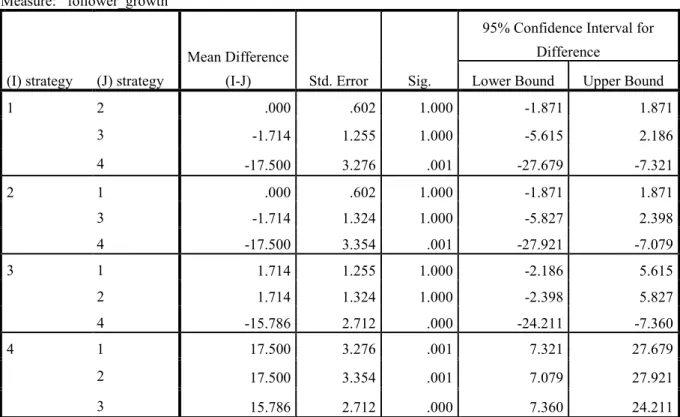
In order to identify where the differences in means occurred, a Bonferroni post-hoc test was performed (Table 7). Looking at the pairwise comparisons between each strategy, it can be concluded that only the fourth strategy (i.e. Follow Strategy) presents a statistically significant difference in means. Namely, it generates a significantly higher follower growth in comparison to all the other strategies (p≤0.001). The other strategies produce very similar results among themselves (no significant p-value).
32 Table 7 - Pairwise comparisons
Measure: follower_growth
(I) strategy (J) strategy
Mean Difference
(I-J) Std. Error Sig.
95% Confidence Interval for Difference
Lower Bound Upper Bound
1 2 .000 .602 1.000 -1.871 1.871 3 -1.714 1.255 1.000 -5.615 2.186 4 -17.500 3.276 .001 -27.679 -7.321 2 1 .000 .602 1.000 -1.871 1.871 3 -1.714 1.324 1.000 -5.827 2.398 4 -17.500 3.354 .001 -27.921 -7.079 3 1 1.714 1.255 1.000 -2.186 5.615 2 1.714 1.324 1.000 -2.398 5.827 4 -15.786 2.712 .000 -24.211 -7.360 4 1 17.500 3.276 .001 7.321 27.679 2 17.500 3.354 .001 7.079 27.921 3 15.786 2.712 .000 7.360 24.211
4.3. Analyzing average engagement
In this sub-section, the focus is on the second dependent variable of this study, which is average engagement. Similar to what was done in the previous analysis, a mixed ANOVA was performed with “day of the week” as the between-subjects factor, and “strategy” as the within-subjects factor. The output for this model is presented in Annex 2. Again, no significant interaction effects (p=0.948) or main effects (p=1.000) was found for “day of the week”, which means this variable had no influence on engagement. Therefore, this factor is disregarded from the analyses from this point forward.
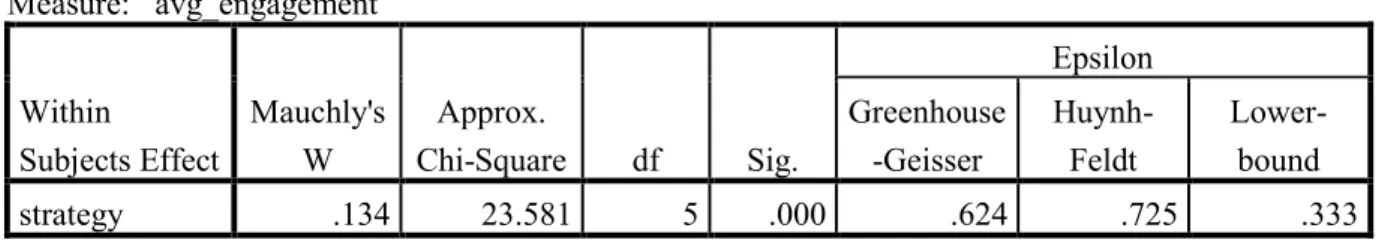
Moving on to an analysis of the strategies alone, a repeated measures ANOVA with within-subjects factor “strategy” was employed. As seen in Table 8, the sphericity assumption was once again violated (p<0.001), meaning that the Greenhouse-Geisser test is the most appropriate in this case.
33 Table 8 - Mauchly's test of sphericity
Measure: avg_engagement Within Subjects Effect Mauchly's W Approx. Chi-Square df Sig. Epsilon Greenhouse -Geisser Huynh-Feldt Lower-bound strategy .134 23.581 5 .000 .624 .725 .333
The Greenhouse-Geisser statistic in Table 9 reads F(1.872,24.335)=7.780 with p=0.003, revealing that the factor “strategy” has a statistically significant effect on engagement. This evidence leads to the rejection of the null hypothesis that the mean of the dependent variable is equal across the different levels of the factor. In fact, it can be concluded that the mean of average engagement does vary significantly in at least one of the strategies. To get further details on this matter, post-hoc tests were performed.
Table 9 - Test of within-subjects effects Measure: avg_engagement Source Type III Sum of Squares df Mean Square F Sig. Partial Eta Squared strategy Sphericity Assumed 9025.429 3 3008.476 7.780 .000 .374 Greenhouse-Geisser 9025.429 1.872 4821.525 7.780 .003 .374 Huynh-Feldt 9025.429 2.175 4149.102 7.780 .002 .374 Lower-bound 9025.429 1.000 9025.429 7.780 .015 .374 Error(strategy) Sphericity Assumed 15081.071 39 386.694 Greenhouse-Geisser 15081.071 24.335 619.734 Huynh-Feldt 15081.071 28.279 533.304 Lower-bound 15081.071 13.000 1160.082
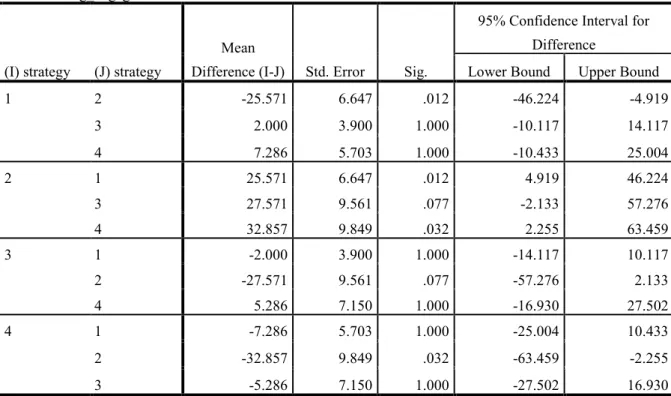
Using the Bonferroni-adjusted pairwise comparisons table (Table 10), it is possible to see the mean differences and their statistical significance. The second strategy (i.e. the Content strategy) shows a statistically significant positive difference, when compared to the Base Case (p=0.012), and to the Follow Strategy (p=0.032). However, when it comes to the third strategy (Engagement strategy), the p-value is somewhat above the usual significance level, namely
34 p=0.077. Therefore, we can conclude that the Content strategy generates significantly higher engagement than the Base case and the Follow strategy, but sensibly the same level of engagement as the Engagement strategy.
Table 10 - Pairwise comparisons Measure: avg_engagement
(I) strategy (J) strategy
Mean
Difference (I-J) Std. Error Sig.
95% Confidence Interval for Difference
Lower Bound Upper Bound
1 2 -25.571 6.647 .012 -46.224 -4.919 3 2.000 3.900 1.000 -10.117 14.117 4 7.286 5.703 1.000 -10.433 25.004 2 1 25.571 6.647 .012 4.919 46.224 3 27.571 9.561 .077 -2.133 57.276 4 32.857 9.849 .032 2.255 63.459 3 1 -2.000 3.900 1.000 -14.117 10.117 2 -27.571 9.561 .077 -57.276 2.133 4 5.286 7.150 1.000 -16.930 27.502 4 1 -7.286 5.703 1.000 -25.004 10.433 2 -32.857 9.849 .032 -63.459 -2.255 3 -5.286 7.150 1.000 -27.502 16.930
4.4. Interaction with brand appeal
So far, the models included all the subjects of the sample in an aggregate manner, providing general results on the effectiveness of the strategies for generating growth and engagement. However, for a more focused analysis, it is possible to incorporate a grouping variable, breaking down the results by group. In this study, the variable “brand” distinguishes observations according to the appeal of the brand’s page – brand A has an emotional appeal, while brand B has a rational appeal. Adding the variable “brand” as a between-subjects factor in the ANOVAs will provide insight on whether the previously obtained results are still accurate, or if the effectiveness of the strategies is influenced by the brand appeal. The following sub-sections 4.4.1. and 4.4.2. present the results of these mixed ANOVA models with dependent measures follower growth, and then average engagement, respectively.
35 4.4.1. Effect of brand appeal on follower growth
First, as always, it is crucial to verify the assumptions of the mixed ANOVA. Levene’s test (Annex 3) validated the homogeneity of variances (all p-values above 0.05). However, according to Mauchly’s test (Annex 4), sphericity was violated (p<0.001), which means the Greenhouse-Geisser corrected statistic must be used instead.
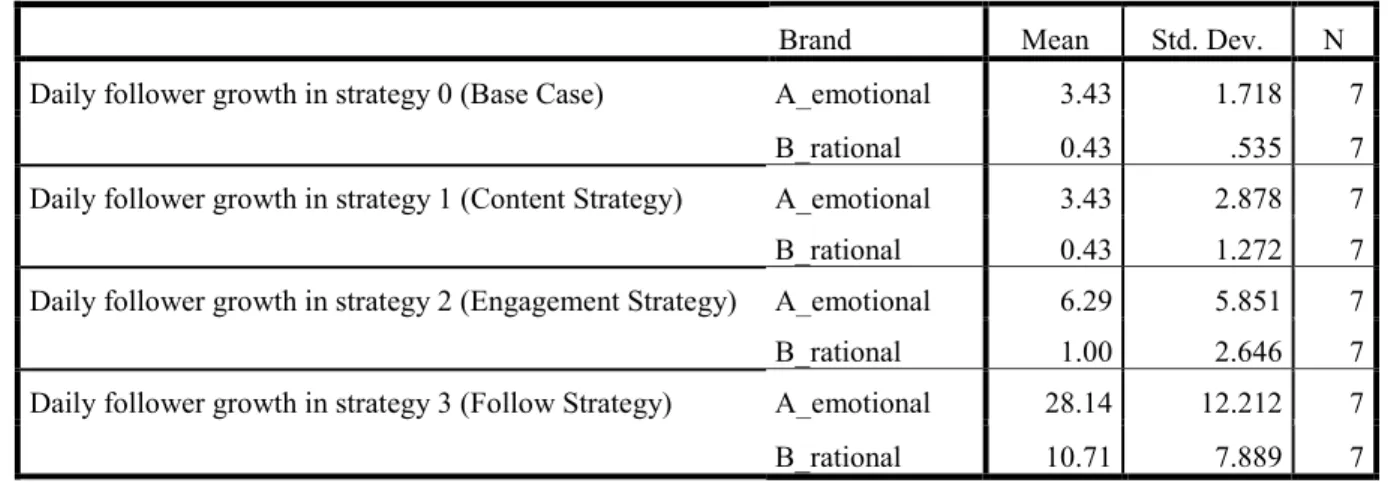
Looking at the descriptive statistics in Table 11, the means of follower growth do seem to diverge between the two brands, in each strategy. However, in order to check whether these differences are statistically significant, it is necessary to look at the results of the mixed ANOVA model.
Table 11 - Descriptive statistics by brand
Brand Mean Std. Dev. N
Daily follower growth in strategy 0 (Base Case) A_emotional 3.43 1.718 7
B_rational 0.43 .535 7
Daily follower growth in strategy 1 (Content Strategy) A_emotional 3.43 2.878 7
B_rational 0.43 1.272 7
Daily follower growth in strategy 2 (Engagement Strategy) A_emotional 6.29 5.851 7
B_rational 1.00 2.646 7
Daily follower growth in strategy 3 (Follow Strategy) A_emotional 28.14 12.212 7
B_rational 10.71 7.889 7
The Greenhouse-Geisser test (Table 12) for “strategy” has an F statistic of F(1.381,16.571)=36.427 and p=0.000, indicating significant main effects of the strategies on follower growth, as was discussed previously. However, since the interaction strategy*brand is also significant (F(1.381,16.571)=6.028, p=0.018), the interaction must be analyzed first before any definitive conclusions can be made regarding the main effects. It is necessary to investigate the simple effects, in order to pinpoint exactly in which strategy the difference in means between brands occurs.
36 Table 12 - Tests of within-subjects effects
Measure: follower_growth Source Type III Sum of Squares df Mean Square F Sig. Partial Eta Squared strategy Sphericity Assumed 3036.482 3 1012.161 36.427 .000 .752 Greenhouse-Geisser 3036.482 1.381 2198.913 36.427 .000 .752 Huynh-Feldt 3036.482 1.632 1860.347 36.427 .000 .752 Lower-bound 3036.482 1.000 3036.482 36.427 .000 .752
strategy * brand Sphericity
Assumed 502.482 3 167.494 6.028 .002 .334 Greenhouse-Geisser 502.482 1.381 363.880 6.028 .018 .334 Huynh-Feldt 502.482 1.632 307.853 6.028 .013 .334 Lower-bound 502.482 1.000 502.482 6.028 .030 .334 Error(strategy) Sphericity Assumed 1000.286 36 27.786 Greenhouse-Geisser 1000.286 16.571 60.364 Huynh-Feldt 1000.286 19.587 51.070 Lower-bound 1000.286 12.000 83.357
The pairwise comparisons in Table 13 provide the simple effects. It analyzes within each strategy whether there is a significant difference between the two brands. In fact, the difference in follower growth between the two brands is significant in each strategy (all p-values≤0.05). Brand A with an emotional appeal always displays a larger follower growth than Brand B (rational appeal), in all strategies. The difference between the brands is especially large in the Follow strategy (i.e. the fourth strategy) – Brand A is able to generate, on average, 17 followers more than Brand B per day. This effect is also clearly visible in the split plot (Figure 2). This means that, even though the Follow Strategy can produce significantly more followers in comparison to the other strategies, this strategy is more effective for pages with an emotional appeal rather than rational.
37 Table 13 - Pairwise comparisons
Measure: follower_growth
strategy (I) Brand (J) Brand
Mean Difference (I-J)
Std.
Error Sig.
95% Confidence Interval for Difference
Lower Bound Upper Bound
1 A_emotional B_rational 3.000 .680 .001 1.518 4.482 B_rational A_emotional -3.000 .680 .001 -4.482 -1.518 2 A_emotional B_rational 3.000 1.190 .027 .408 5.592 B_rational A_emotional -3.000 1.190 .027 -5.592 -.408 3 A_emotional B_rational 5.286 2.427 .050 -.003 10.574 B_rational A_emotional -5.286 2.427 .050 -10.574 .003 4 A_emotional B_rational 17.429 5.495 .008 5.456 29.402 B_rational A_emotional -17.429 5.495 .008 -29.402 -5.456
38 4.4.2. Effect of brand appeal on average engagement
Starting out by checking the model’s assumptions, immediately a problem arises: An important assumption of the mixed ANOVA, homogeneity of variances, is not verified – all p-values are below 0.05 (Annex 5). It would be impossible to proceed with the analysis. In order to overcome this issue, a logarithmic transformation was applied to the dependent variable, which restored the homogeneity of variances (Annex 6). Therefore, the dependent variable under analysis from this point forward is the natural logarithm of the “average engagement” variable.
Mauchly’s test detected no violation to sphericity (Annex 7), which means that the test which assumes sphericity can be used when reading the ANOVA table. As is possible to see in Table 14, there is a statistically significant interaction effect between strategy and brand, with an F-statistic of F(3,36)=10.879 and p=0.000. Again, this means that the simple effects must be interpreted, instead of the main effects.
Table 14 - Tests of within-subjects effects Measure: log_avg.engagement Source Type III Sum of Squares df Mean Square F Sig. Partial Eta Squared strategy Sphericity Assumed 1.219 3 .406 11.315 .000 .485 Greenhouse-Geisser 1.219 2.455 .496 11.315 .000 .485 Huynh-Feldt 1.219 3.000 .406 11.315 .000 .485 Lower-bound 1.219 1.000 1.219 11.315 .006 .485
strategy * brand Sphericity
Assumed 1.172 3 .391 10.879 .000 .476 Greenhouse-Geisser 1.172 2.455 .477 10.879 .000 .476 Huynh-Feldt 1.172 3.000 .391 10.879 .000 .476 Lower-bound 1.172 1.000 1.172 10.879 .006 .476 Error(strategy) Sphericity Assumed 1.292 36 .036 Greenhouse-Geisser 1.292 29.466 .044 Huynh-Feldt 1.292 36.000 .036 Lower-bound 1.292 12.000 .108