Capital structure decisions in the
context of corporate spin-offs
The case of PT Multimedia
Pedro Miguel Delgado Martins
150203012
Advisor: Diana Bonfim
Dissertation submitted in partial fulfillment of requirements for the degree of MSc, at Universidade Católica Portuguesa,
March 2015
Pedro Martins - 150203012
Acknowledgments
The conclusion of this thesis represents the achievement of a long established goal and is one
of the most important moments of my academic career.
I would like to express my gratitude to my academic supervisor Diana Bonfim for the useful
comments, remarks and engagement through the learning process of this master thesis.
I would like to recognize and show my thankfulness to all my co-workers for all the support
throughout this period.
Finally and most importantly, I would like to thank my parents for their love, support and
encouragement.
Pedro Martins - 150203012
Capital structure decisions in the context of corporate spin-offs:
The case of PT Multimedia
Pedro Miguel Delgado Martins
Católica – Lisbon, School of Business and Economics
March 2015
Abstract
In February 2006, Sonae presented a hostile takeover offer for 100% of Portugal Telecom’s
(PT) outstanding shares. If it was accepted, it would have been the largest ever business deal
in Portugal.
Although the offer was rejected, it changed the Portuguese telecommunications industry by
leading to the separation of PT and Portugal Telecom Multimedia (PTM) via spin-off.
In this thesis I examine the motivations for this spin-off transaction and its implications on
both firm’s capital structure decisions.
By comparing each firm debt level (implicit debt level) with the one that would minimize
their cost of capital (optimal debt level), derived via WACC minimization, I conclude that
after the spin-off, the capital allocation efficiency worsened significantly.
Furthermore I argue that in both PT and PTM the deterioration was a direct consequence of
the spin-off. As such, my findings contrast with previous studies that suggest that capital
allocation efficiency improves, or at least remains unchanged, following a spin-off.
Pedro Martins - 150203012
Index of Contents
Chapter 1 – Introduction... 2
Chapter 2 - Literature Review ... 4
2.1 - Traditional theories on Capital Structure: ... 4
2.1.1 – The Trade-off Theory: ... 5
2.1.2 – Pecking order theory: ... 6
2.1.3 – Alternative theories ... 6
2.1.4 – Facts unaddressed by traditional theories ... 7
2.2 – Capital Structure in a corporate group and the impact of a Spin-off ... 8
2.2.1 – Capital structure in a corporate group ... 8
2.2.2 – Spin-off and the effect on the capital structure ... 10
2.3. - Business Line and Country analysis ... 12
2.3.1 – Telecommunications sector: ... 12
Chapter 3 - Company background: ... 13
Chapter 4 – Research Questions and Methodology ... 16
4.1 - Factors influencing PTM’s spin-off decision: ... 16
4.2 – Spin-off impact on PT and PTM’s leverage ... 18
4.3 – Analyzing PT and PTM capital allocation efficiency ... 18
4.3.1 - Computing the Optimal Debt Level: ... 19
4.4 – Industry Peers – Sample selection ... 26
Chapter 5 – Results ... 28
5.1 - Factors influencing PTM spin-off decision: ... 28
5.2 - Spin-off impact on PT and PTM’s leverage. ... 33
5.3 - PT and PTM capital allocation efficiency ... 34
Chapter 6 – Conclusions... 39
Chapter 7 – Limitations ... 41
Reference List ... 42
Articles ... 42
Books ... 44
Companies Annual Reports ... 44
Other Sources ... 45
Appendices ... 47
Appendix A: Factors influencing the spinoff ... 47
Appendix B: Spin-off impact on PT and PTM’s leverage ... 49
Pedro Martins - 150203012
Index of Figures
Figure 1 – ROE – PT vs Industry Peers ... 28
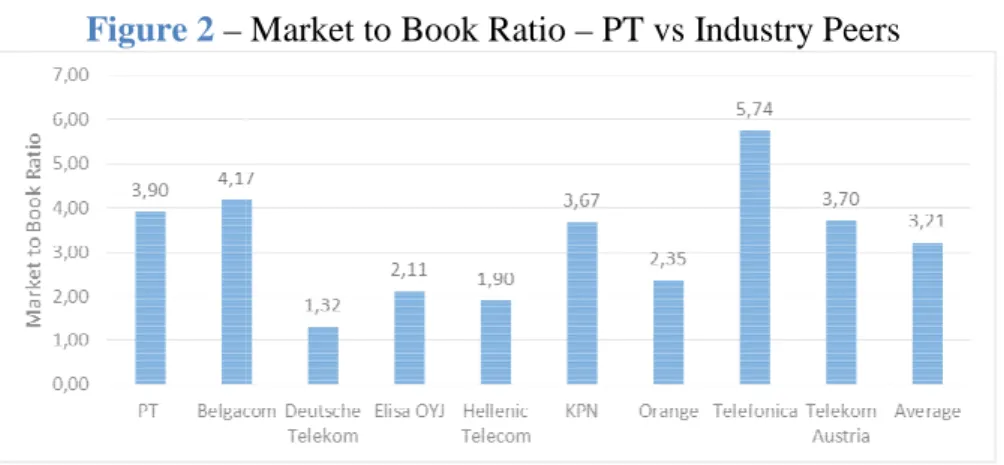
Figure 2 – Market to Book Ratio – PT vs Industry Peers ... 29
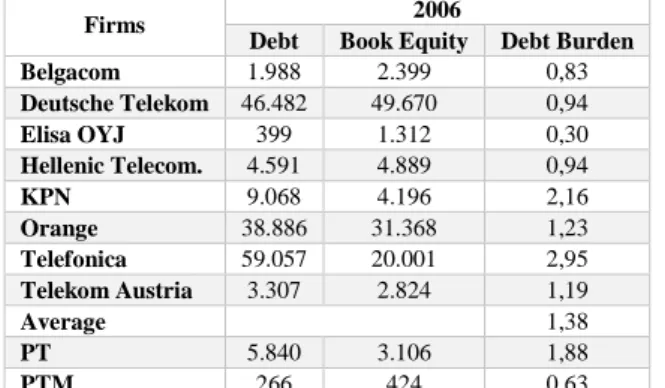
Figure 3 – Debt Burden – PT vs Industry Peers ... 29
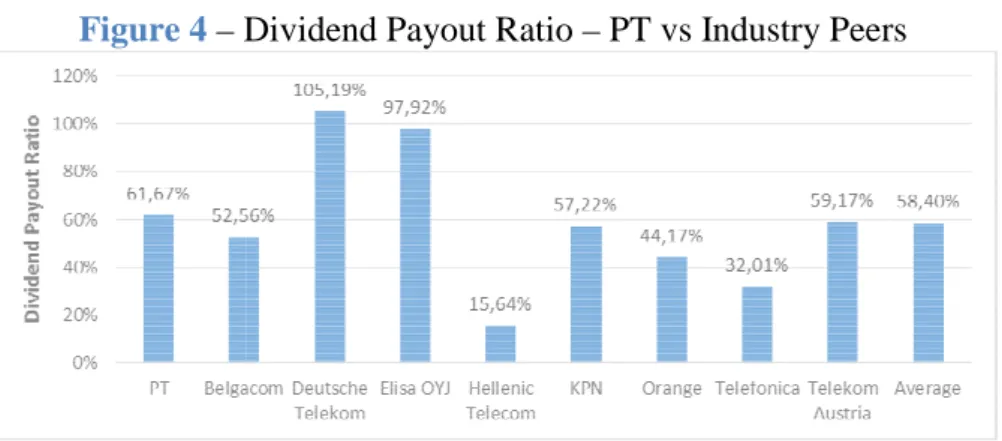
Figure 4 – Dividend Payout Ratio – PT vs Industry Peers ... 30
Figure 5– ROE – PTM vs PT ... 30
Figure 6 – Market to Book Ratio – PTM vs PT ... 31
Figure 7 - Debt Burden - PTM vs PT ... 31
Figure 8 – Dividend Payout Ratio – PT vs PTM... 31
Figure 9 – ∆ Leverage – PT vs Industry Peers ... 33
Figure 10– ∆ Leverage – PTM vs Industry Peers ... 34
Figure 11 – PT – Optimal and Implicit Debt Level ... 34
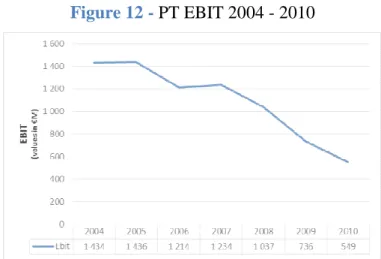
Figure 12 - PT EBIT 2004 - 2010 ... 35
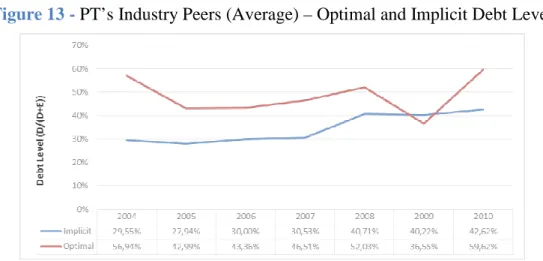
Figure 13 - PT’s Industry Peers (Average) – Optimal and Implicit Debt Level ... 36
Figure 14 – PTM – Optimal and Implicit Debt Level ... 37
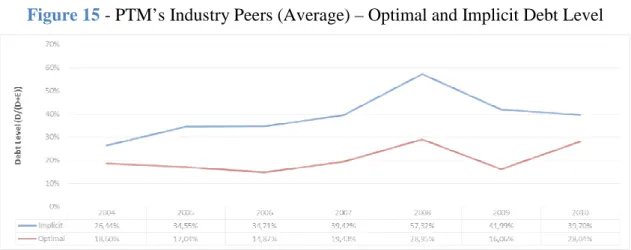
Figure 15 - PTM’s Industry Peers (Average) – Optimal and Implicit Debt Level ... 38
Index of Tables
Table 1 - PT’s Revenue by operational segment (2001-2006) ... 14
Table 2 - List of Stock Exchange Indexes by Country ... 22
Table 3 – ICR and ratings: Low Market Cap Firms ... 23
Table 4 - ICR and ratings: High Market Cap Firms ... 24
Table 5 - Synthetic Rating – Low Market Capitalization Firms ... 25
Table 6 - Synthetic Rating – High Market Capitalization Firms ... 25
Pedro Martins - 150203012
Page 2
Chapter 1 – Introduction
In February 2006, Sonae presented a hostile takeover offer for 100% of Portugal Telecom’s
(PT) outstanding shares. If it was accepted, it would have been the largest ever business deal
in Portugal.
A year later the offer failed, and Sonae was not able to gain control of PT. However, this
event contributed to a significant change in the Portuguese telecommunications sector. Until
that point, PT dominated all the segments of the industry (fixed telephone, mobile telephone,
internet and television), not having to face significant competition (except for the mobile
telephone segment). However as a consequence of the failure of the hostile takeover, PT had
to spin-off one of its largest subsidiaries, Portugal Telecom Multimedia (PTM).
PTM dominated a segment (television), had significant market share in other (internet) and,
soon after the spin-off was announced, began operating in fixed telephone, thus creating a true
competitor to PT.
The main objective of this thesis is two analyze this transaction and the impact it had on PT
and PTM’s capital structure. Based on the existing literature for capital structure decisions,
and more specifically for spin-off transactions, this thesis will focus on answering the
following questions:
-
Which were the factors that motivated the spin-off?
-
What was the immediate impact on leverage for both firms?
-
Did the spin-off increase or decrease the capital allocation efficiency
1
on both firms?
To answer the first question, I analyze the announcement made by PT’s Board. If besides the
two factors officially mentioned to explain this spin-off transaction (increase the remuneration
package so that PT’s shareholders would not accept Sonae’s offer and regulatory pressure)
there were other factors that could have been relevant to this decision.
The second question is to analyze both firms’ leverage on the period around the transaction
and its variation, identifying if it is consistent with the traditional theory on the subject.
Finally, I will compare PT and PTM’s implicit capital structure with its optimal capital
structure and evaluate the impact of the spin-off.
1
It’s the difference between optimal and implicit capital structure. The lower is the difference, between these
Pedro Martins - 150203012
Page 3
In order to estimate the optimal capital structure, I will make a sensitivity analysis, testing
different debt levels. The cost of equity will be valued using CAPM and the cost of debt will
be determined using the Damodaran (2012) approach on synthetic ratings.
In answering all of these questions, I will compare PT and PTM’s results with industry peers
selected from sector indexes, respectively Eurostoxx Telecommunications Index and BI
Europe Cable & Satellite Index.
This thesis is organized as follows: Section 2 presents a literature review on capital structure
decisions, Section 3 has a brief introduction of the PT Group (that includes both firms),
questions and methodology are explained in Section 4, and in Section 5 I review the results.
Finally, Section 6 presents the conclusions and the limitations of the study are presented in
Section 7.
Pedro Martins - 150203012
Page 4
Chapter 2 - Literature Review
2.1 - Traditional theories on Capital Structure:
Companies finance their assets by different forms of funding, both internal and external,
thereby determining their capital structure. If instead of distributing profits from previous
years, companies decide to retain them, they are using internal financing. By contrast, if they
are using the capital markets to obtain funds, they are using external financing. Companies try
to meet their financial needs by mixing these two types of financing and they can change their
capital structure throughout the company life according to their life cycle, market conditions
or preferences of the manager/owner.
The basis of the research in capital structure theory and financing decisions was established
by the work of Franco Modigliani and Merton H. Miller in 1958. They derived the following
rule of optimal investment “(…) the type of instrument used to finance an investment is
irrelevant to the question of whether or not the investment is worthwhile” (Modigliani and
Miller 1958, pp.292).
This proposition was based on a market with certain conditions, like the absence of taxes, no
bankruptcy costs and no agency costs or asymmetry of information. Additionally, it assumed
atomistic competition in the capital markets and easy access to those markets.
These types of conditions are hardly observable in capital markets and that was also assumed
by the authors “Having served their purpose they can now be relaxed in the direction of
greater realism and relevance” (Modigliani and Miller 1958, pp.296).
By eliminating some of these assumptions, different results are obtained. Both Modigliani and
Miller later considered the effect of corporate taxes on capital structure decisions and
concluded: “(…) that the tax advantages of debt financing are somewhat greater than we
originally suggested and, to this extent, the quantitative difference between the valuations
implied by our position and by the traditional view is narrowed.” (Modigliani and Miller
1963, pp.434).
However in the same article, the authors identified some reasons that explain why companies
do not choose to be financed exclusively with debt. For instance, in some cases it might be
cheaper for investors to finance via retained earnings (considering personal income taxes or
some limitations imposed by lenders). So, in order to find the best possible capital structure,
each company must consider the pros and cons of the choice between internal and external
forms of funding. This discussion lays the ground for the trade-off theory.
Pedro Martins - 150203012
Page 5
2.1.1 – The Trade-off Theory:
This theory argues that the financing choice is made by considering the benefits and costs of
increasing (or decreasing) leverage (percentage of the firm’s assets financed by debt).
According to Graham and Leary (2011, pp.9)“(…) the static tradeoff suggests firms choose
their capital structure to balance the benefits of debt financing (e.g. corporate tax savings and
mitigation of agency conflicts between managers and shareholders) with the direct and
indirect costs of financial distress.”. Based on this definition, a number of implications could
be derived, the first one being that profitability and leverage should be positively correlated.
The most profitable firms face the highest marginal tax rates, so the higher the debt, the
higher the tax savings. Another fact that reinforces this finding is that firms with larger profits
face a smaller probability of bankruptcy, which lowers the bankruptcy cost. Debt could also
be used to mitigate the agency costs between managers and shareholders. As more profitable
firms generate more free cash flow, managers without supervision could use it to invest in
riskier projects. So, by issuing debt, the interest payments generated will align the incentives
of managers and shareholders and will force managers to allocate the resources more
efficiently. According to Jensen (1986, pp.325)“The threat caused by failure to make debt
service payments serves an effective motivating force to make such organizations more
efficient”.
There are other implications that can be derived from this theory, such as firms with more
tangible assets that are more redeployable should have higher leverage, because it lowers its
bankruptcy cost. For the same reason, firms with more intangible assets or with high R&D
intensity should be less leveraged. Finally, firms with higher depreciation expenses should
have less leverage, because these expenses generate a tax benefit that will lower the tax
benefits of debt.
This theory assumes that firms have target leverage ratios and some authors such as Jalilvand
and Harris (1984) present evidence that firms manage leverage towards an optimal ratio.
The trade-off theory explains several patterns and trends in the corporate strategy decision
process of firms, but according to authors, like Graham and Leary (2011), there are important
shortcomings, like the fact that many profitable firms facing high marginal tax rates have very
little leverage. Further, directional trade-off predictions explain little of the observed capital
structure variation and the rate of the reversion to target is too slow to be considered a firm’s
priority. There are some authors that defend that a firm can have different debt ratios
Pedro Martins - 150203012
Page 6
starts to use debt as its cash flows become predictable and when the firm reaches its mature
state the debt ratio tends to reach its peak.
So, in order to address these shortcomings, other theories must be considered to explain the
capital structure decision:
2.1.2 – Pecking order theory:
This theory argues, according to Myers (1984) and Myers and Majluf (1984), that firms
choose their capital structure according to a financing hierarchy, where firms usually prefer
internal finance. If external finance is needed, firms issue debt first, then hybrid securities,
like convertible bonds, and only as a last resort issue equity.
Managers prefer to finance via internal financing (retained earnings), and when not enough,
management may also plan to cover part the investments with new debt but, according to
Myers (1984, pp.589) “it tries to restrain itself enough to keep the debt safe”, which means
“reasonably close to default-risk free”. As debt level increases so does the costs of financial
distress (bankruptcy costs) and the financial flexibility of the firm for new issues of debt
becomes smaller.
Only after these possibilities are exhausted would management consider issuing equity, which
is why, according to Graham and Leary (2011, pp.319) “there is a significant negative market
reaction to the announcement of seasoned equity issues”.
However, according to Fama and French (2005) and Leary and Roberts (2010), the pecking
order theory predicts a relatively small number of debt and equity issuance decisions.
Overall both the pecking order and the trade-off theories leave many financing decisions
unexplained and offer some conflicting predictions.
2.1.3 – Alternative theories
The shortcomings of the traditional capital structure theories have created room for different,
more recent, attempts to explain the capital structure decision and two significant ones are the
market timing theory by Baker and Wurgler (2002) and the mechanical stock price
explanation by Welch (2004).
Baker and Wurgler (2002, pp.3) argue that “capital structure is largely the cumulative
outcome of past attempts to time the equity market”, which means, as Antão and Bonfim
(2008, pp.175) stated, that “managers tend to time the market by issuing shares when the
equity market is perceived as more favorable”. These findings are contradictory to the
traditional capital structure theories, because they do not follow the pecking order hierarchy
Pedro Martins - 150203012
Page 7
of financing, as equity could be issued before debt or even before the firm consumes all of its
retained earnings. It also contradicts the trade-off theory of a target leverage ratio.
On the other hand, Welch (2004, pp.107) argues that ‘‘(...) over reasonably long time frames,
the stock price effects are considerably more important in explaining debt-equity ratios than
previously identified proxies’’, which means that the capital structure is primarily affected by
external influences of stock returns instead of being influenced by the decisions undertaken
by the management.
2.1.4 – Facts unaddressed by traditional theories
The theories reviewed in the previous sections present the most comprehensive explanations
on the capital structure decision. However, according to Graham and Leary (2011) there are
several aspects unaddressed or wrongly tackled by those theories like mis-measurement of
variables (leverage, distress costs or tax shields); the effect capital structure has on
non-financial stakeholders, supply conditions in the capital market, non-financial contracting and the
value effects of capital structure.
One aspect not identified in the work of Graham and Leary was the role that internal markets
have in the capital structure decisions inside corporate groups, specifically the role that a
parent company has in financing its subsidiary and how a subsidiary capital structure changes
when it is spun-off.
In the following section I review the literature on those subjects, which are closely related to
the topic of this thesis.
Pedro Martins - 150203012
Page 8
2.2 – Capital Structure in a corporate group and the impact of a Spin-off
2.2.1 – Capital structure in a corporate group
Before reviewing the existing literature about the financing decisions within a corporate group
we must gain an understanding on what defines it.
Using the International Financial Reporting Standards (IFRS) it is possible to present a
definition that is understandable and comparable across international boundaries, and so,
according to IFRS 10 – Consolidated Financial Statements, a corporate group is comprised by
a parent company and subsidiary and the parent controls the subsidiary. According to the
same standard, a parent controls its investee when it has all of the following: power over the
investee; exposure, or rights, to variable returns from its involvement with the investee; and
the ability to use its power over the investee to affect the amount of the investor’s return.
Previous standards, like the International Accounting Standard 27 (IAS 27)
2
, established that
control was presumed when the parent holds more than half of the voting rights of an entity.
As I have presented in the previous section, traditional capital structure theories focus on
standalone companies but as Bianco and Nicodano (2006, pp.938) stated “(…) the capital
structure of group affiliated companies is richer since they have access to both the internal
(within the group) and the external capital market”. This topic will be analyzed further in the
next section.
2.2.1.1 – Debt issuance in a corporate group
Not only is the decision on capital structure more complex because of the access to within the
group financing, it also requires to consider the financial structure of the group as a whole.
In terms of issuing debt, as the parent company faces limited liability in case of the
insolvency of the subsidiary, there is an incentive for issuance of debt by the latter. However,
and as Bianco and Nicodano (2006) argue in their study, this factor could present an incentive
for management to allocate riskier projects to the subsidiary. The lenders, anticipating this
scenario would charge higher interest rates which might offset the advantages of the issuance
of debt by the subsidiary.
The result of their study was that, in their sample, parent companies issue external debt and
are net lenders to their subsidiaries and therefore but they only analyze corporate groups
within a country, but if multinational corporations are considered, where the parent and the
2
Pedro Martins - 150203012
Page 9
subsidiary are present in different markets, facing different tax rates and different bankruptcy
costs, we might obtain different results.
Chowdhry and Nanda (1994, pp.263), argue that the “optimal debt financing strategy for the
subsidiary is determined by the trade-off between tax savings due to the deductibility of
interest expense and bankruptcy costs” and based on their model, they predict that a
subsidiary will have a larger proportion of external debt if it is facing a higher tax rate than
the parent.
So, based on the existing literature an argument can be made that subsidiaries rely primarily
on financing within the group and only issue external debt if the tax advantages offset the
bankruptcy costs.
2.2.1.2– Equity issuances in a corporate group
The adverse selection model of Myers and Majluf (1984) predicts that firms, on average, will
issue stock when managers have private information that their stock is overvalued. Then, in a
parent-subsidiary framework, as Nanda (1991) argues, subsidiary stock issues will occur
when its assets are overvalued and the parent’s assets are undervalued.
Consistent with this hypothesis, Slovin and Sushka (1997, pp.842) analyzed subsidiary equity
issuances and concluded that “Gains in parent value exceed losses sustained by minority
shareholders of issuing subsidiaries so, contrary to prior evidence about negative wealth
effects of seasonal equity issuance, announcements of subsidiary stock offerings increase the
value of the combined enterprise”.
Vijh (2006) presents a different approach to this issue. He argues that, based on a sample of
127 seasoned equity offerings (SEO’s) within parent-subsidiary structures during 1981-2002,
“the market perceives the issuing firm to be overvalued, but perceives no significant new
information concerning the nonissuing firm’s value”(Vijh 2006, pp.1339) . Furthermore, he
identified the three main types of equity issues in these structures and defined them as parent
primary issue, a subsidiary primary issue, and a subsidiary secondary issue of stock held by
the parent and analyzed the motivations behind them. He concluded that both higher prior
year returns and financing deficits were significant factors for both primary issues, but neither
was a significant factor regarding secondary issues.
Vijh (2006) also concluded that the choice between which firm issues stock is driven by the
overvaluation of the issued stock and that funds are not transferred across firms within
corporate group structures.
Pedro Martins - 150203012
Page 10
2.2.2 – Spin-off and the effect on the capital structure
2.2.2.1 – Forms of restructuring
Since I am analyzing the effect that a spin-off had on an entity’s capital structure, in this
section I identify and define the corporate divestiture forms.
There are three major forms in which a firm can divest: sell-offs, equity carve-outs and
spin-offs.
In an asset sell-off, the subsidiary is sold to a third party and the parent firm receives cash in
the transaction.
An equity carve-out occurs when a firm issues equity of a subsidiary. The parent receives
cash and the buyers of the stock are the new shareholders of the firm. However, the parent
firm maintains a controlling interest in the subsidiary that is being carved out.
Finally, the spin-off also involves an equity issuance of a subsidiary, but in this case the
parent firm does not receive cash in the transaction because the new shares are distributed to
the existing shareholders of the parent as a pro rata dividend.
2.2.2 – Vertical divestiture and the decision between spin-off and a carve-out:
Analyzing the vertical
3
divestiture decision, Jain, Kini and Shenoy (2011) suggest that parent
firms are more likely to divest subsidiaries whose industries experience positive demand
shocks and that the firms undertaking these decisions are relatively less productive parent
firms as their assets/subsidiaries are more valuable to other firms in the industry. They also
concluded that “attractive industry financing conditions, particularly in subsidiary firm
industries, instead of internal financing constraints influence integrated firms to consider
financial divestitures” (Jain, Kini and Shenoy (2011, pp.603). Other authors like Duhaime and
Grant (1984) hypothesized several individual factors to be relevant on the divestment decision
and concluded that divestment decisions tend to be made when firm financial strength, as
measured by the ROE
4
, is low by comparison to industry financial strength. Duhaime and
Grant (1984) also concluded that divested units had low competitive and financial strength
and low interdependency with the firm’ other units.
Analyzing the method of vertical divestiture the financial constraints become relevant and
“vertical divestiture is likely to be a carve-out instead of a spin-off in face of tighter financial
3
The disposal of some or all of the subsidiaries, divisions or assets that make up a company’s vertical
combination
4
Pedro Martins - 150203012
Page 11
constraints” as argued by Jain, Kini and Shenoy (2011, pp.605), which means that if the
subsidiary is financed significantly by the parent, it is more likely the parent would decide to
do an equity carve-outs, retaining control of the entity.
Furthermore, Jain, Kini and Shenoy (2011) also conclude that spin-offs are more likely in
larger industries which experience positive demand shocks.
Other authors like Johnson, Klein and Thibodeaux (1996, pp.306) have argued that “firms
engaging in spin-offs are larger, more highly leveraged and have higher asset turnover and
lower real asset growth than their industry rivals”.
2.2.3 – Impact of a spin-off in the capital structure
In spin-offs, managers issue equity of a subsidiary that already exists or could result from
breaking up a company by allocating a segment of the original firm’s assets and liabilities to a
newly formed company.
Since management can arbitrarily choose the financing mix of the new company, this could
imply an incentive to allocate a larger debt load to the subsidiary in order to leave the parent
less leveraged. One example of this was the Marriot spin-off, which, as Parrino (1997, pp.
269) concluded, would have “reduced the value of the assets underlying the bondholder
claims”, without increasing the interest amount paid to the bondholders. However even
without covenant protection, the bondholders were able to force a modification in the spin-off
plan.
These findings are consistent with the work of McNeil and Moore (2005) and Gertner,
Powers and Scharfstein (2002) that concluded that there was no general tendency to
misallocate capital by the parent. On the determinants of debt allocation, John (1993)
concluded that profitability was a significant factor when allocating debt.
Mehrotra, Mikkelson and Partch (2003) were able to establish some relationships between
financial indicators from the companies emerging from the spin-off and the debt ratio. They
concluded that high profitability, higher level (and lower volatility) of cash operating returns,
and larger proportions of assets in property, plant and equipment are positively related to
higher debt ratios.
Analyzing the post spin-off period, several authors have studied the evolution of leverage in
the companies emerging from the transaction. John (1993), Johnson, Klein and Thibodeaux
(1996) and Daley, Mehrotra and Sivakuman (1997) have concluded that there is no significant
change in leverage levels following spin-offs. Other authors, like Michaely and Shaw (1995),
obtained different results, finding that only the spin-off parents decreased debt levels.
Pedro Martins - 150203012
Page 12
Assessing the impact of a spin-off in the capital allocation efficiency, Gertner Powers and
Scharfstein (2002, pp.2504) found that “one of the effects of the spinoff – or even one of the
reasons they are undertaken in the first place- is to increase the efficiency of capital
allocation”, because they found that financing within the group is inefficient on average.
Other authors concluded that the allocation of debt does not change significantly following
the spin-off and that “spinoffs are not commonly motivated by a desire to improve the
allocation of capital, unless most firms are unable to realize intended improvements” McNeil
and Moore (2005, pp. 265). Finally, Johnson, Klein and Thibodeaux (1996) conclude that
both the parent and the subsidiary experience increases in real asset growth following
spin-offs, and the parent firms experience significant improvements in the cash flow margin on
sales.
2.3. - Business Line and Country analysis
2.3.1 – Telecommunications sector:
Since this thesis examines capital structure decisions in a telecommunications company, in
this section I review some of the latest developments in the capital structure decision in this
sector.
In Europe, since the mid 1990’s there was an increasing volume of market reforms.
Cambini and Rondi (2011) characterized the sector in many European countries as being
dominated by an incumbent, with an almost monopolistic position, that competes with smaller
alternative operators.
They also argue that in response to market reforms, many incumbents expanded their activity
by growth through mergers and acquisitions and into related markets.
These companies financed its growth via leverage, specifically when undertaking large
investments and, as Cambini and Rondi (2011) concluded, the increase in leverage also has an
impact in the regulated rates, increasing them. Regulators in order to provide an investment
incentive to the incumbent may raise the access charge, which in turn solidifies incumbent
market position, thus having a negative impact in the competition.
As the result of the increase in leverage, many of major EU telecommunications companies
have large net debt positions.
The United States faces a similar situation, where deregulation caused an abnormal increase
in leverage. According to Leach, Moyen and Yang (2013, pp.334) “this increase is consistent
with the introduction of a new benefit of debt when the product market opens to competition”.
Pedro Martins - 150203012
Page 13
Chapter 3 - Company background:
PT was, in 2007, the largest telecommunications company in Portugal and one of the largest
Portuguese companies overall. It is the incumbent Portuguese operator and provides several
services to its customers, such as:
-
Fixed telephone services;
-
Mobile telephone services;
-
Internet Service Provider;
-
Cable distribution network operator;
-
Data transmission services;
-
Voice over internet services (VoIP).
PT was founded in 1994, resulting from the merger of three independent, publicly owned,
operators: Telefones de Lisboa e Porto, Telecom Portugal and Teledifusora de Portugal. With
the merger, PT became the only national telecommunications operator.
Through the 1990s, the Portuguese government carried out a privatization program. This
occurred in several steps and by the end of 2000 all but 500 "golden shares" (nominal shares
which are able to outvote all other shares in certain specified circumstances) of its capital was
privately owned, making it one of the most privatized European Telecoms.
PT started as a fixed telecommunications operator, but began investing heavily in new
technologies, such as mobile telephone services and internet access service in the 1990’s.
In 2000, the Portuguese telecommunications sector was fully opened to competition and as a
consequence PT’s market share on its most traditional business, fixed telephone services,
dropped significantly(from 92% in 2001 to 71% in 2006)
5
. The same happened to its
contribution to the group revenue, as presented in table 1:
5
Pedro Martins - 150203012
Page 14
Table 1 -
PT’s Revenue by operational segment (2001-2006)
Business
Segments
2001
2002
2003
2004
2005
2006
Value
%
Value
%
Value
%
Value
%
Value
%
Value
%
Fixed
Telephone
Services
2.401
42%
2.248
40%
2.138
37%
2.145
37%
2.050
32%
1.912
30%
Mobile
Telephone
Services –
Portugal
1.172
21%
1.267
23%
1.347
23%
1.462
25%
1.455
23%
1.424
23%
Mobile
Telephone
Services –
Brazil
1.401
24%
1.218
22%
1.362
24%
1.599
27%
2.037
32%
2.105
33%
Multimedia
592
10%
640
11%
684
12%
598
10%
627
10%
664
10%
Other
160
3%
210
4%
246
4%
82
1%
215
3%
238
4%
Total
Revenue
5.726
100%
5.582
100%
5.776
100%
5.886
100%
6.385
100%
6.343
100%
Source: Bloomberg, Portugal Telecom Annual Reports (2002-2007)
Values in €M
PT had also begun to expand internationally, targeting markets in Africa, Asia and South
America. By 2007, PT had a significant shareholder stake in Médi Telecom (Morocco), Unitel
(Angola), MTC (Namibia), CST (Sao Tome e Principe, CVT (Cape Verde), Timor Telecom
(East Timor), CTM (Macao), UOL and Brasilcel (Brazil).
Beginning in 1998, PT and Telefonica (Spanish Telecommunications incumbent) announced
an agreement regarding their Brazilian assets in order to create a strategic joint venture for the
mobile-phone segment in Brazil called Brasilcel, which eventually would control the largest
mobile phone operator in South America (VIVO). As part of the agreement, Telefonica
increased its shareholders stake in PT to 10 percent, becoming at the time the largest
shareholder.
Multimedia Sector
In 1994, PT created TV Cabo Portugal S.A. (TV Cabo), a TV cable and satellite operator,
which shortly after became the operator with the largest market share.
In July 1999, as part of the PT Group reorganization process, PT formed Portugal Telecom
Multimedia (PTM) transferring to the new company TV Cabo, SAPO (internet services
provider) and a minority stake in Páginas Amarelas, the leading Portuguese telephone
directories business.
Pedro Martins - 150203012
Page 15
PTM had its initial public offering (IPO) in November 1999, having PT remained the largest
shareholder (with a stake greater than 58 percent).
In the years following the IPO, PTM acquired Lusomundo, a media holding company in
Portugal, with cinema and movie distribution assets (Lusomundo Audiovisuais) and several
newspapers and radio stations (Lusomundo Media). Later, in 2005, PTM sold Lusomundo
Media.
In January 2007, PTM launched voice telephony services, establishing itself as an integrated
“triple play” operator (telephone, internet and television).
Hostile Takeover offer by Sonae and aftermath:
On February 6, 2006, Sonae SGPS, S.A. and Sonaecom—SGPS, S.A. announced an
unsolicited tender offer for all the outstanding ordinary shares and convertible bonds of PT.
Soon after, they extended the offer for all the outstanding ordinary shares of PTM, which was
conditioned upon the successful purchase of more than 50% of the ordinary shares of PT.
PT’s management advised its shareholders to reject Sonae’s proposal and, contingent to the
failure Sonae’s offer, proposed a revised remuneration package for the 2006-2008 period (up
from Euro 3.0 billion to Euro 3.5 billion)
6
as well as the spin-off of the 58,43% shares PT had
in PTM to all PT shareholders by way of a dividend in kind.
At the extraordinary meeting of shareholders, held on March 2, 2007, the proposal to remove
the 10% voting limitation from the bylaws of PT was rejected. Since this was a necessary
pre-requisite established by Sonae, its takeover offer also failed.
Hence, the spin-off of PTM advanced and it was concluded in 7
th
November 2007
7
.
6
PT Board Press Release – Portugal Telecom approves proposal to spinoff PT Multimedia, to increase the
proposal shareholder remuneration package to Euro 3.5 billion and to contribute Euro 1.0 billion in the pension
funds – 3rd August 2006
7
Pedro Martins - 150203012
Page 16
Chapter 4 – Research Questions and Methodology
4.1 - Factors influencing PTM’s spin-off decision:
On 3
rd
of August 2006, the Board of PT announced the approval of a proposal to spin-off
PTM. At the time, the decision was explained with two main arguments: i) to increase the
remuneration package to prevent Sonae and Sonaecom’s offer from succeeding, and ii) “to
address the concerns regarding access network concentration…”
8
However and focusing
specially in the second argument, although the European Commission
9
and the Portuguese
Competition Authority
10
stated that separation of the local telephone and cable network would
be important to promote competition in local access, there was still no official ruling by any
regulator’s authority that obliged PT to undertake such a decision.
So, in order to better understand this transaction, I am going to investigate if any other
motives were important influences.
Based on the works of Duhaime and Grant (1984) and Decker and Mellewigt (2007), the
following factors may be individually important to influence this divestment decision:
-
Firm financial strength;
-
Unit financial strength;
-
Unit interdependency;
-
Corporate Strategy.
Duhaime and Grant (1984) tested other factors, such as economic growth and managerial
attachment, but were proven less significant. Also, since PT and the majority of its peers are
multinational companies, it would be very difficult to determine the economic growth of the
area in which these companies operate.
Beginning with firm financial strength, based on the existing literature, I defined the
following measures
11
:
1)
Return on equity (ROE) – averaged over the three years prior to the spin-off;
2)
Market-to-book ratio – averaged over the three years prior to the spin-off;
3)
Debt burden – averaged over the three years prior to the spin-off;
4)
Dividend payout ratio – averaged over the three years prior to the spin-off.
8
PT Board Press Release – Portugal Telecom approves proposal to spinoff PT Multimedia, to increase the
proposal shareholder remuneration package to Euro 3.5 billion and to contribute Euro 1.0 billion in the pension
funds – 3rd August 2006
9
European Electronics Communications –Regulation and Markets 2005
10
Relatório Anual de Acompanhamento dos Mercados de Comunicações Electrónicas - 2004
11Pedro Martins - 150203012
Page 17
I derive the hypothesis that PT’s financial strength was important to the decision to spin-off
PTM. This is tested by comparing its financial performance with that of its industry peers,
defined in chapter 4.4. However some indicators might be more important than others, and I,
following the findings of
Duhaime and Grant (1984),
hypothesize that firm financial strength,
measured by ROE, is lower than industry average and other traditional measures are not
significant.
The second factor tested is the unit financial strength and, it is important the emphasize that
PTM is already an independent firm, so the same measures applied to determine the financial
strength of PT can also be used to measure the financial strength of the divested unit, PTM.
Our hypothesis is that the PTM financial strength is lower than PT and so could have been a
motivation for the spin-off.
Unit interdependency can be measured by the levels of technology or facilities shared, but
also by the proportion of significant items from the divesting unit’s balance sheet or income
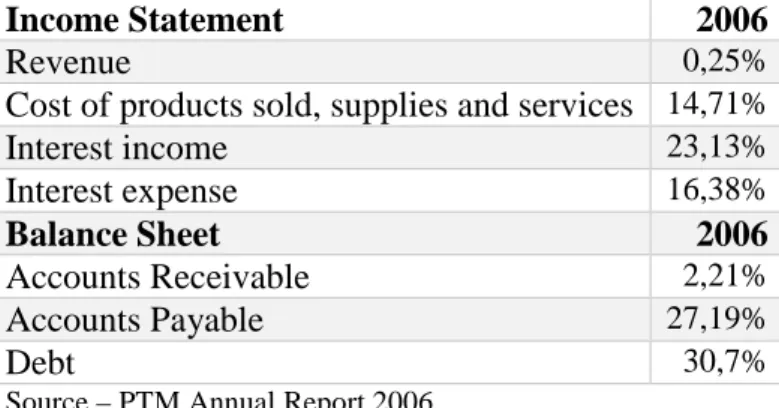
statement with the parent firm. In this case, I will analyze PTM’s annual report in the year
before the spin-off and assess the importance of the transactions with PT (and firms controlled
by PT, or on which PT has significant influence) in the year before the spin-off. I expect that
PTM has low level of interdependency with PT and PT’s other units.
Finally PT’s decision to divest might result from a reorientation of its corporate strategy,
because “simultaneous investment in too many and too diverse technological field or the
performance of redundant activities often result in inefficiency”
12
. In determining the relative
importance of this motivation, I will analyze the annual reports and public statements made
by both firms’ key personnel. I expect that a strategic reorientation of PT could be relevant in
the decision to divest PTM.
12
Pedro Martins - 150203012
Page 18
4.2 – Spin-off impact on PT and PTM’s leverage
On 7th November 2007 PTM was spun-off from PT. It represented significant changes in its
organization, namely at the ownership level, operationally and also presented some challenges
financially.
As it was described in the chapter 2.2, by being part of a corporate group, PTM had access to
financing within the group and so, by leaving that structure, had to adapt the financing mix
available.
I analyze the quarterly evolution of leverage
13
in both PT and PTM, beginning in the year
prior to the spin-off and ending in the year after
14
and compare it with both industry peers.
This thesis, following the findings of John (1993), Johnson, Klein and Thibodeaux (1996) and
Daley, Mehrotra and Sivakuman (1997)
15
, hypothesizes that leverage in both PT and PTM
remains similar to the pre-spin-off levels instead of considering alternative theories like
Michaely and Shaw (1995) that stated that only the spin-off parents decreased debt levels.
4.3 – Analyzing PT and PTM capital allocation efficiency
Existing literature argues that “one of the effects of spin-offs – or even one of the reasons they
are undertaken in the first place – is to increase the efficiency of capital allocation”
16
. This
theory is based on the assumption that financing within the group is inefficient.
Assessing this premise, Mcneil and Moore (2005) concluded that, on average, the capital
allocation efficiency of the parent firms remains unchanged post-spin-off.
This thesis examines which hypothesis is true to PTM’s spin-off case by comparing each firm
proportion of debt in the capital structure
17
(Implicit Debt Level) to the proportion of debt that
would minimize the cost of capital to each firm (Optimal Debt Level). The latter is the one
that maximizes the use of the tax shields and the agency benefits and at the same time
minimizes the distress and agency costs. The same calculations are made for each of PT and
PTM industry peers to make an industry comparison.
13
Debt / Total Assets
14
Since the spinoff date was 7th November 2007, I will consider the previous quarter ending date 30
thSeptember
2007 the reference date
15
Daley, Mehrotra and Sivakumar (1997) concluded that cross-industry spin-offs lead to a small decline in
leverage ratio of the combined assets, but there is no change in leverage associated with same industry spinoffs.
PT and PTM operate in the same industry.
16
Gertner, Powers and Scharfstein (2002, pp.2504)
17Pedro Martins - 150203012
Page 19
4.3.1 - Computing the Optimal Debt Level:
In order to determine the Optimal Debt Level for each year and each firm I made a sensitivity
analysis testing different debt levels. I am testing 10 different debt levels (the first being 0%
and the last being 90%) per year. Having identified the level which resulted in the lowest cost
of capital I use the “goal seek” excel function to determine the exact optimal.
The method used is the weighted average cost of capital (WACC) and the calculations are
made on a yearly basis, starting three years before the spin-off date ending three years after.
18
The weighted-average cost of capital general formula is:
= [
+
+
+
1 −
]
where:
E - Value of Equity;
D - Value of Debt;
Ke - Cost of Equity;
Kd - Cost of Debt;
Tc - Corporate tax rate.
In the process of WACC computation I consider the following assumptions:
-
The capital structure has only two claims (Equity and Debt);
-
The Equity values considered are the market values;
-
The Debt values applied are the book values of debt
19
;
-
The adjustment costs of rebalancing the capital structure are not taken in
consideration;
-
The tax shields are limited by the EBIT value.
-
The corporate tax rate is the marginal tax rate
In order to solve the equation for every company and every year, it is necessary to collect the
following variables:
E – Market value of Equity (obtained from Bloomberg);
D – Book value of financial debt (obtained from each firm’s Annual Report and Bloomberg);
Tc – Marginal Tax Rate (obtained from the OECD).
18
In this case, since the calculations are made on a yearly basis, the spinoff date considered will be 2007.
19Pedro Martins - 150203012
Page 20
Cost of equity
The Cost of Equity is the rate of return investors require on an equity investment in a firm. It
results from a trade-off between risk and return that a specific asset should grant to its holder.
The least risky investments are treasury bills of AAA countries. By comparison, the market
portfolio of common stocks is considered a much riskier investment and therefore investors
require a higher return from the market portfolio than from treasury bills.
Considering just one individual security of the market portfolio, in order to determine its risk,
we must determine how sensitive it is to market movements. This sensitivity is called beta (β).
Stocks with β greater than 1 tend to amplify the overall movements of the market and stocks
with β between 0 and 1 tend to move in the same direction as the market, but not as far. If the
β is negative, its returns tend to move in the opposite direction of the market’s returns.
In order to estimate an accurate projection of the trade-off between risk and return of a single
firm, I use the capital asset pricing model (CAPM) and this model undertakes the following
assumptions:
-
Individual investors are price takers, therefore the security prices are not affected by
the trades they make (perfect competition assumption);
-
Single-period investment horizon;
-
Investments are limited to traded financial assets (it rules out non-traded assets);
-
There are no taxes and transaction costs;
-
Investors are rational mean-variance optimizers;
-
There are homogeneous expectations; all investors analyze securities through the same
lenses of cash flows distribution probabilities
20
.
The model’s message is that, in a competitive market, the expected risk premium varies
proportionally to beta and is defined as:
=
×
or
− " = #
− "
where:
r – Expected stock return;
rf – risk free rate;
20
According to Markowitz Portfolio Theory, all investors will have the same expectations and make the same
Pedro Martins - 150203012
Page 21
rm-rf – expected risk premium on the market.
Based on this formula we derive the following for calculating the cost of equity:
= " + #
− "
where:
rf – Risk free rate
Yield used is the one from Long term (10 years) German Government Bonds, because the
majority of firms analyzed present their financial information in euros.
β
Derived by obtaining the covariance between the daily returns of the firm’s stock in the 5
years previous to the analyzed date, with the daily market returns (in this case the Eurostoxx
Index) in the same period. To compute the values it was used the excel formula “Slope”.
In the WACC minimization process, I will be changing the capital structure and, by that,
changing the applicable β. In order to compute different levels of β I will need to determine
the Unlevered Beta (β
0
), which is obtained by the following equation:
β
%
=
β
[1 + 1 −
∗
]
Market Risk Premium – (rm –rf)
For the country of each firm analyzed, I have identified the most important stock exchange
index presented in table 2:
Pedro Martins - 150203012
Page 22
Table 2
- List of Stock Exchange Indexes by Country
Country
Stock Exchange Index
Austria
ATX
Belgium
BEL20
Finland
OMX Helsinki 25
France
CAC 40
Germany
DAX
Greece
ASE
Netherlands
AEX
Poland
WIG 20
Portugal
PSI 20
Spain
IBEX 35
United Kingdom FTSE 100
United States
S&P 500
For each index, I calculate the total return (including dividends), and compute the monthly
market return for the longest period available (since 1990).
Using that market return, and having obtained, via Bloomberg, the monthly risk free yield
21
I
can determine a Market Risk Premium for every country and period needed, based on the
following formula:
' () *
= 1 +
ℎ()
,-
− 1
Cost of Debt
The cost of debt measures the current cost to the firm of borrowing funds to finance itself. In
general terms, it is defined by the following factors:
-
The risk-free rate that is being negotiated in the markets. As the riskless rate increases,
the cost of debt for firms will also increase;
-
The entity’s default risk. As the default risk of the firm increases, the cost of
borrowing money also increases;
-
The tax advantages of debt. If the tax shields increase, more debt in the overall capital
structure can be used. This can, in turn, increase the cost of debt.
The simplest scenario for estimating the cost of debt occurs when a firm only has tradable
long term bonds (Damodaran, 2012). The cost of debt would then be computed based on the
market price, yield, coupon and maturity of the portfolio of bonds.
21
Pedro Martins - 150203012
Page 23
However, the majority of firms have bonds outstanding that do not trade on a regular basis or
have other instruments of debt, like loans, which create hurdles when computing the cost of
debt.
Since the majority of larger firms are rated, it is possible to estimate their cost of debt by
using their ratings and associated default spreads. However, many companies are not rated.
Then there are two additional alternatives to estimate the cost of debt:
-
Recent borrowing history: by analyzing recent borrowings made by the firm and use
these spreads to come up with a cost of debt;
-
Estimate a “synthetic rating”, based upon its financial ratios.
Damodaran (2012) presented this last hypothesis, and, based on information collected on the
years 1999 and 2000 from the S&P 500 index, he was able to establish the connection
between the interest coverage ratio (ICR)
22
and the rating of the manufacturing companies of
the S&P 500. One important distinction he made was to divide the sample between firms with
market capitalization lower or greater than $2 billion. His conclusions are detailed in tables 3
and 4.
Table 3 –
ICR and ratings: Low Market Cap Firms
ICR
Rating Spread
> 12,5
AAA
0,75%
9,5 – 12,5
AA
1%
7,5 – 9,5
A+
1,5%
6 – 7,5
A
1,8%
4,5 – 6
A-
2%
3,5 – 4,5
BBB
2,25%
3 – 3,5
BB
3,5%
2,5 – 3
B+
4,75%
2 - 2,5
B
6,5%
1,5 – 2
B-
8%
1,25 – 1,5
CCC
10%
0,8 – 1,25
CC
11,5%
0,5 – 0,8
C
12,7%
< 0,5
D
14%
Source – Damodaran (2012)
22
EBIT/Interest Expense
Pedro Martins - 150203012
Page 24
Table 4
-
ICR and ratings: High Market Cap Firms
ICR
Rating Spread
> 8,5
AAA
0,75%
6,5 – 8,5
AA
1%
5,5 – 6,5
A+
1,5%
4,25 – 5,5
A
1,8%
3 – 4,25
A-
2%
2,5 – 3
BBB
2,25%
2 – 2,5
BB
3,5%
1,75 – 2
B+
4,75%
1,5 - 1,75
B
6,5%
1,25 – 1,5
B-
8%
0,8 – 1,25
CCC
10%
0,65 – 0,8
CC
11,5%
0,2 – 0,65
C
12,7%
< 0,2
D
14%
Source – Damodaran (2012)
In this thesis I use the synthetic rating model
23
to estimate the cost of debt. Although the
majority of firms analyzed is covered by a rating agency, in the sensitivity analysis I change
the capital structure of each entity, and so the initial rating would not be representative of the
new capital structure obtained with each new debt level.
I maintain the relation between ICR and rating estimated by Damodaran, but I have updated
the spread associated to each rating with the information from the Reuters Pricing Service
(RPS) for Corporate Bond Spreads
24
.
Since the information obtained from RPS calculates the spread over the US Government
Bonds with the same maturity I determine new spreads for each period analyzed based on the
German Government Bonds. The updated synthetic rating tables computed are presented in
Tables 5 and 6
25
:
23
Damodaran (2012)
24
RPS bases its calculations on a database of over 20.000 bonds prices corporate bonds at a spread above an
underlying treasury issue.
25
Pedro Martins - 150203012
Page 25
Table 5
- Synthetic Rating – Low Market Capitalization Firms
ICR
Rating
Spread
2004
Spread
2005
Spread
2006
Spread
2007
Spread
2008
Spread
2009
Spread
2010
> 12,5
AAA
0,13%
0,68%
0,88%
1,07%
1,65%
0,48%
0,26%
9,5 – 12,5
AA
0,30%
0,80%
1,03%
1,27%
2,00%
1,08%
0,71%
7,5 – 9,5
A+
0,59%
0,93%
1,34%
1,47%
2,25%
1,28%
0,96%
6 – 7,5
A
0,61%
0,95%
1,51%
1,62%
2,40%
1,38%
1,01%
4,5 – 6
A-
0,63%
0,98%
1,71%
1,67%
2,45%
1,48%
1,11%
3,5 – 4,5
BBB
0,79%
1,41%
1,86%
1,79%
2,55%
1,58%
1,16%
3,25 – 3,5
BB+
1,04%
1,51%
1,92%
1,97%
2,85%
1,88%
1,46%
3 – 3,25
BB
1,17%
1,59%
2,20%
2,02%
3,15%
1,98%
1,56%
2,5 – 3
B+
2,10%
2,55%
2,45%
3,03%
5,45%
2,20%
1,99%
2 - 2,5
B
2,65%
2,65%
2,90%
3,66%
6,10%
3,62%
2,49%
1,5 – 2
B-
3,75%
3,95%
4,50%
3,76%
6,45%
4,57%
3,99%
1,5>
CCC
4,45%
4,05%
5,30%
4,23%
6,60%
10,97%
5,29%
Table 6 -
Synthetic Rating – High Market Capitalization Firms
ICR
Rating
Spread
2004
Spread
2005
Spread
2006
Spread
2007
Spread
2008
Spread
2009
Spread
2010
> 8,5
AAA
0,13%
0,68%
0,88%
1,07%
1,65%
0,48%
0,26%
6,5 – 8,5
AA
0,30%
0,80%
1,03%
1,27%
2,00%
1,08%
0,71%
5,5 – 6,5
A+
0,59%
0,93%
1,34%
1,47%
2,25%
1,28%
0,96%
4,25 – 5,5
A
0,61%
0,95%
1,51%
1,62%
2,40%
1,38%
1,01%
3 – 4,25
A-
0,63%
0,98%
1,71%
1,67%
2,45%
1,48%
1,11%
2,5 – 3
BBB
0,79%
1,41%
1,86%
1,79%
2,55%
1,58%
1,16%
2,25 – 2,5
BB+
1,04%
1,51%
1,92%
1,97%
2,85%
1,88%
1,46%
2 – 2,25
BB
1,17%
1,59%
2,20%
2,02%
3,15%
1,98%
1,56%
1,75 – 2
B+
2,10%
2,55%
2,45%
3,03%
5,45%
2,20%
1,99%
1,5 – 1,75
B
2,65%
2,65%
2,90%
3,66%
6,10%
3,62%
2,49%
1,25 – 1,5
B-
3,75%
3,95%
4,50%
3,76%
6,45%
4,57%
3,99%
1,25>
CCC
4,45%
4,05%
5,30%
4,23%
6,60%
10,97% 5,29%
The spread will be added to the risk free rate for each period and it will determine the cost of
debt.
Calculating the Optimal Debt Level:
The key input to determine the cost of debt is the ICR. Since all the firms have positive EBIT,
in the first debt level tested
26
the rating is always AAA, because as there is no debt and no
interest expense, the ICR is always greater than 8.5 or 12.5
27
. In the second level of debt
(10%) I computed the WACC by analyzing if by using the AAA rating I would still have an
26
0% Debt
27
Pedro Martins - 150203012
Page 26
ICR greater than 8.5 or 12.5. If that is true I would maintain the AAA rating and if it is not
true, I would test the next rating.
It is also important to notice that by increasing the proportion of debt in the capital structure I
would also be increasing the β, which resulted in an increase of the cost of equity.
28
Finally, in order to perform the necessary calculations, two additional assumptions are
considered:
-
Ebit is independent from the capital structure and is equal to the reported in the
income statement for each year;
-
Cost of equity must always be greater than the cost of debt. For some observations of
the model, particularly when lower ratings were computed for low levels of debt, the
cost of debt obtained was larger than the cost of equity. In those cases I made the
assumption that the cost of equity would be equal to the pretax cost of debt.
4.4 – Industry Peers – Sample selection
In order to test the proposed methodology and to test if the results are consistent with the
sector, I have selected a sample of industry peers for each firm.
In the case of PT, I identify several telecommunications companies which, for the period
covered (2004-2010), were part of the Eurostoxx Telecommunications (PT was also part of
that index). The firms selected were
29
:
-
Belgacom
-
Deutsche Telekom
-
Elisa OYJ
-
Hellenic Telecommunications
-
KPN
-
Orange
-
Telefonica
-
Telecom Austria
Based on the same criteria, for PTM I selected several firms from the BI Europe Cable &
Satellite Index. However, in this case some of the firms selected were not listed in some years
of our sample. The firms selected were:
28