1876-6102 © 2016 The Authors. Published by Elsevier Ltd. This is an open access article under the CC BY-NC-ND license (http://creativecommons.org/licenses/by-nc-nd/4.0/).
Peer-review by the scientific conference committee of EEIC | CIEE 2016 under responsibility of Guest Editors. doi: 10.1016/j.egypro.2016.12.112
Energy Procedia 106 ( 2016 ) 155 – 165
ScienceDirect
1
stEnergy Economics Iberian Conference, EEIC | CIEE 2016, February 4-5, Lisbon, Portugal,
APEEN (www.apeen.org) and AEEE (www.aeee.es)
Mapping fuel poverty in Portugal
Sofia G. Simoes
a*, Vera Gregório
a, Júlia Seixas
a*
aCENSE – Centre for Environmental and Sustainability Research, Faculdade de Ciências e Tecnologia, Universidade NOVA de Lisboa, 2829– 516 Caparica, Portugal
Abstract
We defined a novel methodology to assess the potential fuel poverty of residential dwellings at LAU2 level combining data on income, level of education, unemployment rate, and number of inhabitants above 65 years old, with both the space heating and cooling gap estimated per household typology. We create an indicator of the share of potential fuel poor inhabitants in each LAU 2 region. We implemented this methodology for 29 municipalities in Portugal. On average 22% of the inhabitants are potentially fuel poor regarding their dwellings’ space heating and 29% regarding space cooling. There is a large variation across the country.
© 2016 The Authors. Published by Elsevier Ltd. Peer-review under responsibility of SINTEF Energi AS.
Keywords: Fuel poverty; residential buildings; thermal comfort; heating and cooling
1. Introduction
There are several definitions of fuel poverty (also known as energy poverty by some authors, including the European Commission), but more commonly the term is used to refer to persons living in households that they cannot afford to heat adequately [1]–[4]. Frequently, other energy uses are also included in the concept [1], [4], although most authors focus on heating. Following the varied definitions of the concept, there are also varied approaches to measure it across the European Union (EU) [2], [3], from considering as fuel poor the households that use 10% more than of their available income to heat their homes up to World Health’s Organization Standards
* Corresponding author. Tel.:+351-212-948-397 x10168; fax:+351-212-948-554. E-mail address: [email protected]
© 2016 The Authors. Published by Elsevier Ltd. This is an open access article under the CC BY-NC-ND license (http://creativecommons.org/licenses/by-nc-nd/4.0/).
(WHO) in the UK [5] and Ireland [6], to simply surveying the number of days that the dwellings have gone excessively cold (or warm), had delays in paying their energy bills, or were disconnected due to debt [7], [8].
Assessing fuel poverty is an area of work mostly developed in the UK [3], [6], [9], where the concept was brought to attention by the seminal work of Brenda Boardman [4]. Since then, studies have been developed for other countries such as for Austria [10], Bulgaria [11], France [12], Italy [13], and Spain [8], [14]. Some overviews have been made for the whole of EU, as [15] that reviewed housing and socio-economic conditions for fourteen countries using Ireland as a benchmark, or the work of [6] that used the EU Survey on Income and Living Conditions (EU-SILC) data to compare 25 EU member states looking at housing conditions, energy inefficiency and energy affordability. According to these studies Portugal, Greece, Italy and Spain were the most fuel poor countries in the EU [16] and, according to the EU-SILC data, Portugal had in 2013 roughly 20-29% of households that were fuel poor. [6] reported similar findings more recently although Southern European countries have been joined by Easter European countries as Bulgaria and Romania. In order to successfully deal with fuel poverty, authors seem to agree that the key defining features of fuel poverty have to be addressed: location, housing quality and income [6], [16].
In this paper, we present a new approach to assess potential fuel poor inhabitants considering such features, focused on space heating and cooling for households. We apply the approach to assess where the fuel poor households are located within 29 municipalities in Portugal under the ClimAdaPT.Local project. ClimAdaPT.Local is an ongoing project leveraging the capacity building at municipalities to develop comprehensive Municipal Strategies for Adapting to Climate Change (MSACC). The paper is organized as follows: section 2 describes the methodology proposed, the results are presented in section 3, and section 4 concludes and highlights some of the needs for improvement.
2. Methodology
2.1. Developed methodological approach
The approach adopted in this paper to assess potential fuel poor follows the framework of [17] to determine whether and to what extent a system is vulnerable to climate change and includes four key components: 1) exposure – variables directly linked to climate parameters (e.g. temperature, precipitation), 2) sensitivity – the degree a system is affected by exposure (e.g. physical attributes of the system, as buildings characteristics), 3) potential impact – measured by the combination between exposure and sensitivity (e.g. the potential impact on thermal comfort), 4) adaptive capacity – the ability of a system to adjust to climate change [18], mostly related with societal environment (e.g. demography, literacy, socio-economic conditions). This approach was initially developed by the authors to assess the climate change vulnerability of residential dwellings regarding thermal comfort [19] and was further adapted to map fuel poverty. The potential impact is stated as the “heating and cooling gap” and the adaptive capacity is adjusted to “capacity to implement alleviation measures”. These are explained more thoroughly in this section.
In this approach, we only look into the residential buildings and their needs aiming to ensure thermal comfort (space heating and cooling). We have adopted the definition of thermal comfort as stated in the Portuguese regulation on the thermal characteristics of buildings (RCCTE) of 2006 [20] which determines that a dwelling should maintain an indoor temperature of 20ºC during the heating season and of 25ºC during the cooling season. This is applicable to the whole of the dwelling and throughout the entirety of the heating and cooling season. The outcomes of fuel poverty are expressed in terms of the senior inhabitants living in civil parishes identified as potentially fuel poor.
As previously mentioned, we adapted the approach described in [17] (Fig. 1) which entails addressing complementarily the potential impact and the capacity to implement measures to reduce potential fuel poverty.
Fig. 1. Schematic representation of the approach to assess potential fuel poverty; authors elaboration over work from [17] 2.2. Capacity to implement alleviation measures
Regarding the capacity to implement alleviation measures, we have built an index to quantify the capacity of each civil parish in the municipality, based on five classes, varying from 0 (minimum capacity) to 5 (maximum capacity), based on detailed statistics data from the National Statistics Institute, most of them at the level of each civil parish, for each of the following variables:
x Age of resident population, particularly the share of resident population with 65 years old or more, being the underlying assumption that older people have more difficulties in adapting to climate changes;
x Average monthly gain in euros, only available at municipality level, to translate the capacity to implement fuel poverty alleviation measures, such as acquiring and using heating and cooling technologies;
x Level of formal education of the resident population, in particular the share of population with a university degree, assuming that persons with higher education have higher income and better access to opportunities to lower their fuel poverty including access to funding opportunities, such as subsidies for retrofitting or for renewable heating and cooling technologies;
x Unemployment rate, reflecting that, in general, unemployed persons will have more economic difficulties. x The five classes of each socio-economic indicator are illustrated in Table 1. These classes were validated with
representatives from 3 Portuguese municipalities who are very aware of climate change adaptation at local level.
The overall capacity to implement alleviation measures was derived through an index, ranging from 0 to 20, that combines a weighted sum as follows: the share of senior citizens weights 1.00, the monthly gain 1.00, the share of population with university degree 0.75 and share of unemployed persons 1.25. These weights appear to be reasonable regarding the results achieved, although additional analysis, namely sensitivity analysis, as well as hands-on by the 29 municipalities in the near future, will be done and adjust if necessary.
Table 1. Five level classes of capacity to implement alleviation measures for each socio-economic indicator Population with 65 years old or
more Average monthly gain in euros
Share of population with
university degree Unemployment rate Attribute range Classes
(0-5) Attribute range Classes (0-5) Attribute range Classes (0-5) Attribute range Classes (0-5) >56% 1 >1801€ 5 >26% 1 >26% 1 41-56% 2 1427-1800€ 4 19-26% 2 19-26% 2 25-40% 3 1050-1426€ 3 12-18% 3 12-18% 3 10-24% 4 683-1049€ 2 5-11% 4 5-11% 4 <10% 5 <683€ 1 <5% 5 <5% 5
2.3. Heating and cooling gap
Regarding the estimation of the heating and cooling gap in thermal comfort, we have developed an approach based on the difference between the final energy consumed for space heating and cooling in reality (stated as REAL FINAL), as reported by the DGEG-General Energy Directorate for year 2013, and the final energy that would be needed to ensure the thermal comfort levels as stated in the national buildings regulation (hereafter referred to as IDEAL FINAL). This was estimated by taking the required heating degree-days (HDD) and cooling degree-days (CDD) for different climatic zones, and the different typologies of buildings characterized by specific construction materials and envelopes. The higher that difference, the higher the heating and cooling gap on thermal comfort. This approach is depicted in Fig. 2.
Fig. 2. Methodology to estimate the heating and cooling gap. ICESD refers to the survey on energy consumption profiles of Portuguese Families [21]
We have estimated the REAL final energy consumption for space heating and cooling in the 29 municipalities based on statistical historical data produced by the National Energy Directorate (DGEG) [21] for each Portuguese
municipality on the sales of electricity, Liquefied Petroleum Gas (LPG), natural gas and diesel to residential consumers. We have then assumed a share of these energy carriers to be consumed in space heating and cooling following the survey of DGEG [22] to residential dwellings in Portugal. For energy consumption of biomass, which is quite significant for space heating in Portugal, we have assumed a value per household estimated by DGEG [21] since there is no robust statistics available.
The final energy consumption associated to the IDEAL thermal comfort was estimated from the calculations required according to the 2006 Regulation for Thermal Comfort Characteristics of Buildings (RCCTE) [20] for a set of typologies of the residential building stock in Portugal, based on the work of [23]. We have considered six residential building types for the civil parishes of each of the 29 municipalities and estimated the useful energy needs in kWh/m2 for space heating and cooling. We then converted the useful energy in final energy using data from the last available population CENSUS [24] on: ownership rate of heating and cooling technologies per civil parish and building type, average area of dwellings per parish, and type of energy carrier consumed for space heating and cooling per residential building type, and average energy efficiencies of space heating and cooling technologies as in Table 2.
Table 2. Average efficiency considered for heating and cooling technologies
Technology Efficiency Reference
Space heating
Open fireplace 0.35
[25] Fireplace with heat recovery 0.60
Closed biomass stove 0.55
Boiler for central heating n.a.
Biomass 0.70 [26] Diesel 0.75 Natural gas 0.75 LPG 0.75 Electric heater 1.00 [25]
GPL heater 0.85 Best guess
Air conditioning (heat pump) 2.20 [25]
Space cooling
Air conditioning 2.38 [25]
Fan 1.00 Best guess
Heat pump 2.30 [26]
The heating and cooling gap per each civil parish was classified in a 20 level index, ranging from 1 (minimum gap) to 20 (maximum gap), that was validated with technicians from municipalities. An index of 20 reveals a maximum gap, which means that highest attention regarding building envelope conditions is required to avoid negative consequences due to the lack of thermal comfort, namely on health.
Finally, the potential fuel poverty of households to climate change regarding thermal comfort was derived through a simple average from the combination of the capacity to implement alleviation measures index with the heating and cooling gap index, ranging from a minimum of 0 to a maximum of 20. We have arbitrarily selected as a threshold to identify potentially fuel poor persons those older than 65 years old and living in a civil parish with a potential fuel poverty index equal or higher to 10.
This methodology may be applied either for the current or for projected climate data, including heat waves episodes, for which the calculation of HDD or CDD may be adjusted.
3. Results
We have applied the previously described approach to the 29 municipalities participating in the ClimAda.PT project, which comprise 679 LAU 2 civil parishes and a total of 2,926,321 inhabitants, i.e. almost 30% of the Portuguese population. These municipalities cover a widely varied context in the country including its two largest cities, as well as medium sized municipalities and several small and mainly rural municipalities. The studied municipalities cover all the different climatic zones in the country and translate fairly well the different demographic and socio-economic contexts across the Portuguese territory (Table 3).
Table 3. Overview of the variability of the socio-economic indicators used to estimate the capacity to implement alleviation measures at NUT 5 level for the 29 municipalities
LAU 2 variables % of population 65
years old or oldera Average monthly income (euros) a
% of population with a university degreea % of population unemployeda Number of residentsa Capacity to implement alleviation measures index (1-20) Maximum 75 1590.60 44 34 66,250 17 Minimum 4 760.00 0 0 41 7 Median 22 927.71 7 12 1,345 12 Average 24 976.20 9 12 4,368 12 a Reference: [24]
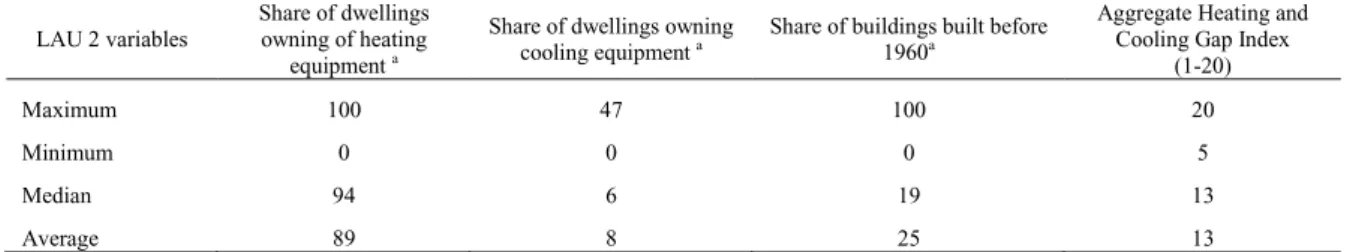
In terms of the heating and cooling gap per LAU 2 civil parish, the 29 municipalities also reflect the large heterogeneity in building types, climate variables and heating and cooling habits across the country (Table 4), with the heating and cooling gap index varying from 5 to the maximum value of 20 reflecting the different building characteristics, climatic zones and behavior of its occupants (ownership of heating and cooling equipment’s and reported energy consumption at municipal level). Although the median for owning a heating device is of 94%, only 6% of the dwellings have some sort of cooling appliance. Although in some civil parishes all buildings are older than 1960 (admittedly only for a few historical areas), in most of them only 19% of buildings are older than 1960.
Table 4. Overview of main variations in the building characteristics and some of the dwellings indicators used to estimate the heating and cooling gap at NUT 5 level for the 29 municipalities
LAU 2 variables
Share of dwellings owning of heating
equipment a
Share of dwellings owning
cooling equipment a Share of buildings built before 1960a
Aggregate Heating and Cooling Gap Index
(1-20) Maximum 100 47 100 20 Minimum 0 0 0 5 Median 94 6 19 13 Average 89 8 25 13 a Reference: [22], [24]
The mapping the potential fuel poor residents resulted in the aggregated values as in (Table 5). In median terms 22% of the residents in these 29 municipalities are persons older than 65 years old that live in civil parishes with a potential heating gap equal or higher than 10. Likewise, in terms of cooling, 29% of the residents and potentially fuel poor in median terms. These values can range between 8-75% of residents for heating and between 10-75% of residents for cooling. Due to the number of civil parishes we have not included here all values and only a simplified statistical analysis. However, our approach allows to map, using a Geographic Information System (GIS) all these variables to identify the most critical areas (Fig. 3 and Fig. 4).
Table 5. Overview of main variations in the potential fuel poor at NUT 5 level for the 29 municipalities per main zones in the country
Number of potential fuel poor residents (older than 65 years and living in a civil parish with a potential
fuel poverty index >= 10)
Regarding Heating Share of residents (%) Regarding Cooling Share of residents (%) 29 Municipalities Total Total 383,086 207,122 Average 665 25 764 30 Maximum 10,496 75 12,115 75 Minimum 16 8 16 10 Median 256 22 212 29
Norte Region Total
Average 428 24 157 34
Maximum 10,496 75 2,449 75
Minimum 16 8 16 10
Median 153 21 102 33
Centro Region Total
Average 487 25 562 29
Maximum 5,796 62 5,796 52
Minimum 45 13 65 14
Median 303 24 299 29
Lisbon Region Total
Average 2,105 22 2,510 25
Maximum 8,138 37 12,115 37
Minimum 188 11 66 14
Median 1,314 20 1,924 26
Alentejo Region Total
Average 472 28 451 29
Maximum 2,411 46 2,411 46
Minimum 92 12 92 12
Median 305 28 230 29
Algarve Region Total
Average 1,239 29 1,341 27
Maximum 3,149 50 3,149 39
Minimum 220 14 282 14
Fig. 4. Overview of the potential fuel poor inhabitants in terms of space heating for the 29 of studied municipalities and civil parishes.
Looking into the five different LAU1 regions (former NUT3), we verify that the parishes with higher share of potential fuel poor persons are located in the Norte region (75% of residents for both heating and cooling). This is the civil parish of Rio de Onor in the municipality of Bragança characterized by its very harsh winters and stifling hot summers, with 75% of inhabitants over 65 years old, but only with 76 residents according to the last population census. On the other extreme of the spectrum, the civil parish of Real in the municipality of Braga (also in the Norte region) has only 8% of its inhabitants potentially fuel poor regarding heating. The climate in Braga is slightly milder than in Bragança but still much harsher than in the Lisbon or Algarve regions. Nonetheless, Braga is one of the youngest municipalities in the country, Real has an educated population and no buildings built before 1960. In terms of minimum share of residents that are potentially fuel poor regarding cooling, again the Norte region leads with a share as low as 10% for the civil parish of Frossos again in Braga where 13% of dwellings own a cooling equipment. Again Rio de Onor has the highest share of potential fuel poor inhabitants regarding cooling.
Note that in Table 5 we only show the values for the civil parishes where we have identified potentially fuel poor dwellings, i.e. with a fuel poverty index for heating and for cooling equal or higher than 10. For example, the civil parish of Real has a fuel poverty index below 10 regarding cooling and thus it does not show up as potentially fuel poor regarding cooling. This is why the number of potentially poor persons regarding heating is much higher than regarding cooling. There are 410 civil parishes with a fuel poverty index for cooling below 10 in the total 679 mapped. In terms of heating only 102 civil parishes are below this threshold. This indicates clearly a different map regarding heating and cooling fuel poverty. This is of relevance as different measures might be necessary for these two different situations. This can be seen in Table 6 where we show the frequency of the heating and of the cooling index classification for the LAU regions.
Table 6. Frequency of the LAU2 classification according to the classes of the heating and the cooling gap LAU3/ gap index classes 1 2 3 4 5 6 7 8 9 10 11 12 13 14 15 16 17 18 19 20 Heating Açores 1 1 1 1 1 1 Alentejo 1 1 4 2 4 13 16 5 Algarve 1 3 2 4 1 Centro 1 1 1 1 8 17 35 34 29 6 2 23 Lisbon 33 3 3 1 3 2 2 1 1 1 6 2 6 20 27 6 1 8 Madeira 1 5 1 1 2 Norte 3 5 31 82 96 47 48 1 Total 33 3 3 1 3 2 0 3 1 3 3 9 18 33 95 160 150 64 54 32 Cooling Açores 1 2 1 2 Alentejo 1 2 2 10 3 8 12 6 1 1 Algarve 1 4 1 4 1 Centro 1 1 2 2 3 15 21 17 23 44 20 6 3 Lisbon 2 4 4 12 13 21 20 19 10 16 4 1 Madeira 1 2 7 Norte 4 2 2 1 4 10 19 24 52 62 53 18 16 3 2 41 Total 5 3 2 3 6 15 41 54 86 115 127 67 57 20 19 4 1 0 0 45
4. Discussion and conclusions
We have implemented an approach to assess and map the potential fuel poor across 29 municipalities in Portugal participating in the Project ClimAdaPT.Local. For the LAU 2 regions, a total of 679 civil parishes were analyzed. In median terms, 22% of the inhabitants are potentially fuel poor regarding the satisfaction of their dwellings’ heating needs and 29% regarding cooling needs. There is a large variation across the country in these indicators. The maximum share of potentially fuel poor inhabitants for heating is 75% and the minimum is 8%. Regarding cooling, the share varies between 22-75%. In our findings we conclude that it is extremely relevant to pay attention to fuel poverty regarding cooling particularly in Southern European countries. In these countries, due to future climate change the occurrence of heat waves with significant impact on public health will increase and with it most probably the share of potential fuel poor.
Our approach allows assessing, through a meaningful sample of the whole country, where the fuel poor are and what are their characteristics. This is considered fundamental by Dubois [16] as it allows for prioritizing the necessary resources for a more precise assessment to learn where and who the fuel poor are. This is, in turn, extremely important since fuel poverty is caused by a blend of motives, which need to be dealt with differently. For example, fuel poor persons can also be economically poor, but this is not always the case. Fuel poor individuals can be elderly and living in isolation or be part of families with young children. They can be more affected by their inability to meet heating or cooling needs. They can live in apartment buildings without any heating appliances or rural houses using wood fires. Different policies need to be defined for these different types of fuel poor individuals. As written by Dubois, we can assess “who can really be helped by fuel poverty policy and who would better be helped by other policies”. This is also supported by Healy [15] that states that “while poverty could in principle be eradicated through rising incomes with some income redistribution, fuel poverty requires more concerted policy action not only through taxation or benefits, but also in crucial investment on building stock”. The assessment presented in this paper was supported by current temperature profiles, but it can be extended to take projected temperature profiles at local level, taken from future climate scenarios and extreme episodes of heat and cold waves.
The approach is relatively easy to implement for a large territory while maintaining a relatively fine geographical disaggregation –we have shown we can “map” the fuel poor potential for a country, a region or a municipality, making use of information available in most of the National Statistic Institutes across the EU. Furthermore, because the approach maps the “heating and cooling gap”, we can identify where improving the building envelope will be more important and where increasing income is more relevant.
Finally, there is substantial room for improvements mainly in what regards data gathering. We have deliberately excluded at this stage the persons living in “unconventional” dwellings, which are probably amongst the most fuel poor ones. Moreover, there is large uncertainty associated to the estimation of the heating and cooling gap since the energy consumption data is only available at municipal level and not disaggregated for heating and cooling. Along these lines, there is also no LAU 2 level data available on the usage of the heating and cooling equipment’s. It could be that in some cases they are not used due to a series of motives. This would influence the size of the heating and cooling gap. Likewise, it was necessary to assume a simplified representation of building typologies for each civil parish and there is no information available of the socio-economic data of the inhabitants of each dwelling. Thus, one may consider equally a wealthy senior citizen living in a luxury condominium perfectly insulated and a low income senior living in degraded apartment. Also, the threshold of 10 taken for the definition of the fuel poverty index is arbitrary and substantial differences in results will occur with a different threshold, which requires a validation process running together with the municipal technicians. Nevertheless, we believe this constitutes a valuable first step towards large scale identification and communication of fuel poverty, namely by associating the results with a GIS, as we have been doing within the ClimAdaPT.Local project.
Acknowledgements
The research work underlying this paper was funded by European Economic Area Financial Mechanism EEA – Grants through the project ClimAdaPT.Local, promoted by the APA-Environment Portuguese Agency. The authors acknowledge the work of Tiago Poças Lopes and of Patrícia Fortes that was very valuable to support the estimation of useful energy needs per dwelling.
References
[1] S. Pye, A. Dobbins, C. Baffert, J. Brajković, I. Grgurev, R. De Miglio, and P. Deane, “Energy poverty and vulnerable consumers in the energy sector across the EU: analysis of policies and measures. Policy Report May 2015/2,” 2015.
[2] C. Liddell and C. Morris, “Fuel poverty and human health: A review of recent evidence,” Energy Policy, vol. 38, no. 6, pp. 2987–2997, Jun. 2010.
[3] H. Thomson, “Fuel Poverty Measurement in Europe: A rapid review of existing knowledge and approaches conducted for Eaga Charitable Trust. Technical Report - January 2013.,” 2013.
[4] B. Boardman, Fuel Poverty: From Cold Homes to Affordable Warmth. London: John Wiley & Sons Ltd, 1991.
[5] T. Sefton and J. Chesshire, “Peer Review of the Methodology for Calculating the Number of Households in Fuel Poverty in England. Final Report to DTI and DEFRA,” 2005.
[6] H. Thomson and C. Snell, “Quantifying the prevalence of fuel poverty across the European Union,” Energy Policy, vol. 52, pp. 563– 572, Jan. 2013.
[7] EUROSTAT, “EU-SILC - EU Survey on Income and Living Conditions,” Luxembourg, 2014.
[8] J. C. Romero, P. Linares, X. L. Otero, X. Labandeira, and A. P. Alonso, “Pobreza Energética en España - Análisis económico y propuestas de actuación,” Vigo, 2014.
[9] R. Walker, P. McKenzie, C. Liddell, and C. Morris, “Estimating fuel poverty at household level: An integrated approach,” Energy Build., vol. 80, pp. 469–479, Sep. 2014.
[10] K.-M. Brunner, M. Spitzer, and A. Christanell, “Experiencing fuel poverty. Coping strategies of low-income households in Vienna/Austria,” Energy Policy, vol. 49, pp. 53–59, Oct. 2012.
[11] S. Bouzarovski, S. Petrova, and R. Sarlamanov, “Energy poverty policies in the EU: A critical perspective,” Energy Policy, vol. 49, pp. 76–82, Oct. 2012.
[12] K. Fabbri, “Building and fuel poverty, an index to measure fuel poverty: An Italian case study,” Energy, vol. 89, pp. 244–258, Aug. 2015.
[13] B. Legendre and O. Ricci, “Measuring fuel poverty in France: Which households are the most fuel vulnerable?,” Energy Econ., vol. 49, pp. 620–628, May 2015.
[14] S. Scarpellini, P. Rivera-Torres, I. Suárez-Perales, and A. Aranda-Usón, “Analysis of energy poverty intensity from the perspective of the regional administration: Empirical evidence from households in southern Europe,” Energy Policy, vol. 86, pp. 729–738, Nov. 2015. [15] J. D. Healy, Housing, Fuel Poverty, and Health: A Pan-European Analysis. Ashgate, 2004.
[16] U. Dubois, “From targeting to implementation: The role of identification of fuel poor households,” Energy Policy, vol. 49, pp. 107– 115, Oct. 2012.
[17] K. Schneiderbauer, S. Fritzsche, P. Bubeck, S. Kienberger, M. Buth, M. Zebisch, and W. Kahlenborn, “The Vulnerability Sourcebook - Concept and guidelines for standardised vulnerability assessments,” GIZ GmbH, Bonn, 2014.
[18] W. N. Adger, “Vulnerability,” Glob. Environ. Chang., vol. 16, no. 3, pp. 268–281, Aug. 2006.
[19] V. Gregório, S. Simoes, and J. Seixas, “Trade- offs between climate change adaptation and mitigation strategies for resilient cities: the case of thermal comfort in households under the ClimAdapt.Local project,” in WSCCA-2015 - World Symposium on Climate Change Adaptation Manchester, UK, 2 – 4 September 2015, 2015.
[20] Decree-Law 80/2006. RCCTE - Regulamento das Características de Comportamento Térmico de Edifícios de 4 de Abril 2006 [Regulation of Thermal Behaviour Characteristics of Buildings of 4th April 2006]. Lisbon: Government of Portugal, 2006, pp. 2468– 2513.
[21] DGEG, “Energy consumption per municipality and per activity sector for 2012,” Lisbon, 2015. [22] DGEG and INE, “ICESD - 2010 Survey on Energy Consumption in Households,” Lisbon, 2010.
[23] T. P. Lopes, “Potencial de poupança de energia na climatização de edifícios habitacionais. Dissertação apresentada na Faculdade de Ciências e Tecnologia da Universidade Nova de Lisboa para obtenção do Grau de Mestre em Engenharia do Ambiente, perfil Gestao e Sistemas A,” Lisbon, 2010.
[24] INE, “Population CENSUS 2011,” Lisbon, 2011.
[25] J. P. Gouveia, P. Fortes, and J. Seixas, “Projections of energy services demand for residential buildings: Insights from a bottom-up methodology,” Energy, vol. 47, no. 1, pp. 430–442, 2011.
![Fig. 1. Schematic representation of the approach to assess potential fuel poverty; authors elaboration over work from [17]](https://thumb-eu.123doks.com/thumbv2/123dok_br/15257857.1025045/3.816.130.610.94.371/schematic-representation-approach-assess-potential-poverty-authors-elaboration.webp)