R E S E A R C H A R T I C L E
Open Access
Exercise induction of gut microbiota modifications
in obese, non-obese and hypertensive rats
Bernardo A Petriz
1,5†, Alinne P Castro
2,4†, Jeeser A Almeida
1,3,5, Clarissa PC Gomes
1, Gabriel R Fernandes
1,
Ricardo H Kruger
2, Rinaldo W Pereira
1,3and Octavio L Franco
1,3,4*Abstract
Background: Obesity is a multifactor disease associated with cardiovascular disorders such as hypertension. Recently, gut microbiota was linked to obesity pathogenesisand shown to influence the host metabolism. Moreover, several factors such as host-genotype and life-style have been shown to modulate gut microbiota composition. Exercise is a well-known agent used for the treatment of numerous pathologies, such as obesity and hypertension; it has recently been demonstrated to shape gut microbiota consortia. Since exercise-altered
microbiota could possibly improve the treatment of diseases related to dysfunctional microbiota, this study aimed to examine the effect of controlled exercise training on gut microbial composition in Obese rats (n = 3), non-obese Wistar rats (n = 3) and Spontaneously Hypertensive rats (n = 3). Pyrosequencing of 16S rRNA genes from fecal samples collected before and after exercise training was used for this purpose.
Results: Exercise altered the composition and diversity of gut bacteria at genus level in all rat lineages. Allobaculum (Hypertensive rats), Pseudomonas and Lactobacillus (Obese rats) were shown to be enriched after exercise, while Streptococcus (Wistar rats), Aggregatibacter and Sutturella (Hypertensive rats) were more enhanced before exercise. A significant correlation was seen in the Clostridiaceae and Bacteroidaceae families and Oscillospira and Ruminococcus genera with blood lactate accumulation. Moreover, Wistar and Hypertensive rats were shown to share a similar microbiota composition, as opposed to Obese rats. Finally, Streptococcus alactolyticus, Bifidobacterium animalis, Ruminococcus gnavus, Aggregatibacter pneumotropica and Bifidobacterium pseudolongum were enriched in Obese rats. Conclusions: These data indicate that non-obese and hypertensive rats harbor a different gut microbiota from obese rats and that exercise training alters gut microbiota from an obese and hypertensive genotype background.
Keywords: Gut microbiota, Obesity, Hypertension, Exercise, Lactobacillus Background
Exercise practice is a non-pharmacological treatment for a series of diseases [1]. Along with dietary control, appropriate exercise programs are proposed to treat and attenuate obesity [2] and its associated cardiovascular disorders such as hypertension [3]. It is known that hyper-tension and obesity frequently coexist [4], affecting millions of people worldwide [5].
Gut microbiota have been recently indicated as having a close relationship with obesity, where the microbiota of an obese subject presents an enhanced ability to har-vest energy and accumulate fat [6]. The gut harbors the greatest density of these microorganisms in the body (e.g. ~up to 1.5 kg in the human gut) [7] with Firmi-cutes, Bacteriodetes and Actinobacteria constituting the dominant phyla [8]. Moreover, obesity is associated with reduced microbiota diversity at phylum level [9], seen in rodents and in humans [10,11].
The gut is a dynamic environment, highly exposed to environmental factors such as diet [12], antibiotics [13], pathogens [14] and lifestyle [15], which constantly interact with microbial communities. In addition, gut microbiota is also shaped throughout life by host-related factors such as host-genotype [16]. Disturbance within gut microbiota
* Correspondence:ocfranco@gmail.com
†Equal contributors
1Centro de Análises Proteômicas e Bioquímicas, Programa de Pós-Graduação em Ciências Genômicas e Biotecnologia da Universidade Católica de Brasília, Brasília, DF, Brazil
3
Programa de Pós-Graduação em Educação Física, Universidade Católica de Brasília, Brasília, DF, Brazil
Full list of author information is available at the end of the article
© 2014 Petriz et al.; licensee BioMed Central Ltd. This is an Open Access article distributed under the terms of the Creative Commons Attribution License (http://creativecommons.org/licenses/by/2.0), which permits unrestricted use, distribution, and reproduction in any medium, provided the original work is properly credited. The Creative Commons Public Domain Dedication waiver (http://creativecommons.org/publicdomain/zero/1.0/) applies to the data made available in this article, unless otherwise stated.
has been reported to influence host susceptibility to pathogens and pathological conditions such as gastro-intestinal inflammatory diseases and obesity [17]. More-over, hypertension induction was also seen to alter gut microbiota [18].
It has been proposed that dysbiosis and pathologies asso-ciated with unbalanced gut microbiota may be prevented or treated with prebiotics, probiotics and fecal microbiota transplantation [19,20]. In addition, controlled exercise in-tensities are related to protective effects on the gastrointes-tinal tract, including a reduced risk of colon inflammation and cancer [21]. It is proposed that exercise may reduce intestinal transit time, diminishing the contact between the colon and cancer-promoting agents [22].
Recently, exercise has also been shown to induce al-terations within microbiota composition [22,23], which suggests that exercise may be included as a possible therapeutic factor along with diet, prebiotics and other treatments. Since exercise plays a prominent role in meta-bolic regulation and energy expenditure, it might modulate host-microbiota interaction, affecting the host metabolism. Although these relations are still unknown, exercise may enhance the strategies for obesity control, along with other actions such as microbiota transplant [20].
Although voluntary exercise was shown to alter micro-biota in non-pathological animals [22-24], its effects on gut microbiota still need to be further investigated in pathologic phenotypes and through controlled parame-ters such as exercise volume and intensity. Therefore, in the present study, we proposed to examine the effect of controlled moderate exercise intensity on gut microbial status in rats with different phenotypes, by using pyrose-quencing of 16S RNAs genes from fecal microbiota samples. To our knowledge, this is the first study to use controlled exercise parameters and distinct animal strains with different obesity and hypertension genotypes.
Analyzing 16S rRNA sequences revealed a similar microbiota profile shared between Wistar and Hypertensive rats, with both being divergent from Obese rats. Exercise was shown to enhance bacterial diversity and to alter microbial communities at the species level in all animal lineages. Thus, these data contribute to the emerging knowledge regarding the effect of exercise on gut micro-biota, but further studies should be performed to establish the mechanism by which exercise signals in the bacterial community and to determine the impact of these modula-tions on host homeostasis.
Methods
Animals
Animals were obtained from the Federal University of São Paulo, Brazil (UNIFESP) and started the experi-ment at ~18 weeks of age. Three different strains from two different genotypes were used: an obese genotype,
homozygous (fa/fa) obese Zucker rats [25] (Obese rats; n = 5, 389.4 ± 21 g) and a hypertensive genotype, spon-taneous hypertensive rats (Hypertensive rats; n = 5, 227.4 ± 29.3 g), a strain obtained by the selective breeding of Wistar-Kyoto rats with high blood pressure [26]. A strain of Wistar rats (WR; n = 5, 223.2 ± 27.3 g) was used as normotensive control for SHR and as a non-obese pheno-type [26] (Additional file 1). All animals were allocated to collective cages according to their lineages, being kept in a 12 h light–dark cycle environment, with food and water ad libitum. All experimental procedures and interventions in the present study, involving animal-welfare, were carried out in strict accordance with the recommendations in the Guide for the Care and Use of Laboratory Animals of the National Institutes of Health and were approved by the local ethics committee for standards in animal use, at the Institute of Biological Sciences, University of Brasilia, Brazil (UnBDOC no. 48695/2010); these were also in ac-cordance with international standards. After experimental procedures, all animals were deeply anesthetized with 2% Xylazine (50 mg.kg−1) and 10% Ketamine (80 mg.kg−1) and euthanized by cervical dislocation. Through the entire experiment, all efforts were made to minimize animal suffering.
Exercise training
Before the training period, all animals underwent a familiarization period on a treadmill device (Li 870, Letica Scientific Instruments, Barcelona, Spain) for 2 weeks to reduce external stress. Duration and speed on treadmill were increased progressively (up to 12.5 m.min−1 for Obese rats; 20 m.min−1for Hypertensive and Wistar rats) as previously described [27,28]. In addition, blood pressure of Wistar and Hypertensive rats was measured by the tail-cuff method [29] at the beginning of the experiment to characterize the hypertensive phenotype from the SHR strain (171.4 ± 7.7 mm.Hg−1 for Hypertensive rats and 128 ± 5.9 mmHg−1for Wistar rats) (Additional file 2). As regards the Obese rats group (obese (fa/fa) Zucker rat), these animals are homozygous for the fa allele and are one of the most common models of genetic obesity where rats normally exhibit hyperlipidemia, hyperinsulinemia, hyperphagia and a significant weight gain by the 3rd to the 5th week of age [25]. In this model, conflicting results were reported on whether these obese Zucker rats are hypertensive compared to the lean control rats, showing that blood pressure is not elevated in this model [30,31]. However, the obesity phenotype may enhance arterial per-ipheral resistance and the animal may develop hyperten-sion secondary to obesity and to secondary mechanisms [32,33]. Considering that obese Zucker rats do not present a regular pattern of blood pressure as reported by different studies, the systolic blood pressure was not measured in this group.
After the adaptation period, all animals were trained for 30 min per day, 5 days per week for 4 weeks. Running intensity was set corresponding to maximal lactate steady state (MLSS), previously identified in obese Zucker rats [28] and SHR rats [27]. Therefore, for Obese rats, running velocity was set at 12.5 m.min−1and for Hypertensive and Wistar rats at 20 m.min−1. A new MLSS identification was performed after the fourth week of exercise training to as-sess each animal’s cardiovascular adaptation.
Blood lactate analysis
Capillary blood samples (10μL) were collected through a small incision in the distal portion of the tail of the animals at rest and every 5 min during the MLSS test. Capillary blood samples were placed in microtubes (0.6 mL) containing 20 μL of 1% sodium fluoride and stored at −20°C. Analyses were performed by electro-enzymatic method with YSI 1500 Sports (Yellow Springs, OH, USA). The MLSS was considered when there was no increase over 1 mmol.L−1of blood lactate from 10 to 25 min of exercise tests [34].
Fecal DNA extraction and barcoded pyrosequencing of the 16S rRNA gene
Fecal content from all animals was individually collected in three replicates before exercise training period and in vivo 24 h after the last session of exercise (Additional file 1). Fecal samples were stored in RNA later® (Life technologies) until samples were frozen at −80°C. Three out of five individual fecal samples from each animal lineage were randomly selected. Fecal microbial DNA was extracted from ~0.25 g using the PowerFecal DNA Isolation Kit (MoBio, Carlsbad, CA, USA) according to the manu-facturer’s instructions. The triplicate DNA extractions were not pooled.
The bacterial community partial 16S rRNA gene was amplified with primer pair 787 F-1492R [35]. For pyrose-quencing analysis, the primer set was modified, where the forward primer included the Roche 454-A pyrosequencing adapter and a 12-bp barcode (unique to each sample), while the reverse primer included only the Roche 454-B pyrosequencing adapter. The 20 μl reaction mixture for the PCR contained approximately 10 ng of metagenomic fecal DNA, 1X PCR buffer (Invitrogen), 3.0 mM MgCl2, 10 pmol of each primer, 0.25 mM dNTP, and 1.5 U Taq DNA polymerase (Invitrogen). The cycling protocol started with an initial denaturation step of 3 min at 95°C, followed by 25 cycles of denaturation for 30 s at 95°C, annealing for 30 s at 58°C, and extension for 1.40 min at 72°C, followed by a final extension for 7 min at 72°C and cooling to 10°C. Finally, the rRNA amplicons from bacterial communities were purified with the QIAquick PCR Purification Kit (Chatsworth, CA). The concentrations of the rRNA ampli-cons were measured by Qubit fluorometer (Invitrogen),
and subsequently the massively parallel GS FLX Titanium technology was performed in the Roche 454 Life Sciences Corporation, Branford, CT, USA.
Analysis of 16S rRNA sequences
A total of 1,398,681 16S rRNA sequences were obtained by the 454 GS FLX Titanium sequencer. All the 16S amplicons were processed by the quantitative insights into microbial ecology (QIIME) pipeline version 1.6.0-dev [36]. Briefly, all the 16S rRNA amplicons were sorted by their barcodes, and subsequently the reads with a length less than 180 bp, ambiguous sequences, bases with Phred values of <30 and their primers, barcodes and adaptor sequences were removed. The remaining sequences were submitted to Denoiser algorithm [37] to remove pyrose-quencing errors. Operational taxonomic units (OTUs) were clustered at 97% similarity using an‘open-reference’ OTU picking protocol, where sequences are clustered against the Greengenes database [38] using Uclust [39]. One of the most-abundant reads from each OTU was aligned using the PyNAST algorithm [36]. The chimeric OTUs were de-tected with ChimeraSlayer [40], and taxonomic classifica-tions were assigned with the naïve Bayesian classifier of the Ribosomal Database Project (RDP) classifier [41] applying 80% of confidence threshold. Shannon indices and observed richness were used to evaluate community richness, and the unweighted Unifrac algorithm was performed to generate principal coordinate plots (PCoA).
Statistical analysis
Statistical differences between the groups pre-exercise and after exercise were tested using the analysis of simi-larities (ANOSIM) by permutation of group membership with 999 replicates [42], and bivariate relationships were measured with Pearson correlations and regression analysis available through QIIME [36]. Statistical tests on the taxonomic differences between samples were calculated by Welch’s t-test combined with Welch’s inverted method for calculating confidence intervals (nominal coverage of 95%), using the Statistical Analysis of Metagenomic Profiles (STAMP) software version 2.0.0 (STAMP) [43].
Accession number
The 454 FLX Titanium flowgrams (sff files) have been submitted to the National Center for Biotechnology Information (NCBI) Sequence Read Archive database, project number: PRJNA246617.
Results
Effect of exercise training on aerobic capacity
After four weeks of treadmill running exercise at moder-ate intensity, a novel MLSS assessment evidenced that all animals from each group had enhanced their aerobic capacity as demonstrated by improvement in the MLSS
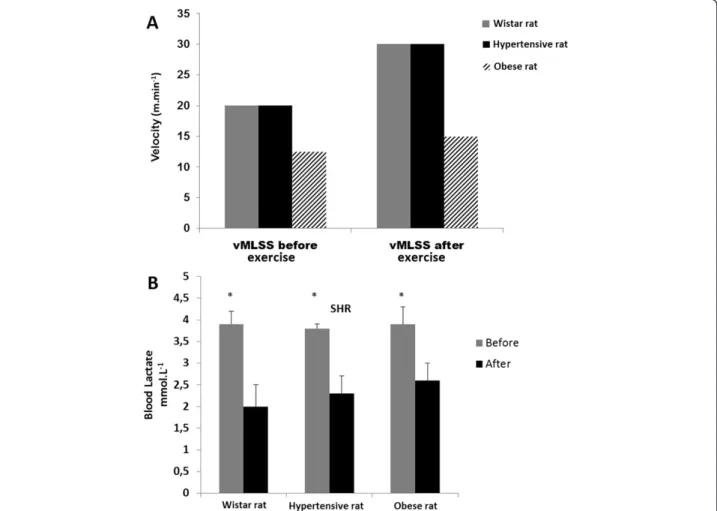
corresponding velocity (15 m.min−1 for Obese rats and 30 m.min−1for Hypertensive and Wistar rats) (Figure 1A). Furthermore, when comparing the initial and final velocity of exercise, a significant reduction was evidenced in blood lactate concentration (BLC) of ~49% for Wistar rats ~39% for Hypertensive rats and ~33% for Obese rats. This reduc-tion in BLC (before vs. after exercise training) demonstrates the effectiveness of the proposed exercise training intensity for all animals (p < 0.01) (Figure 1B).
Composition of fecal microbiota in rat lineages
After quality filtering, 889,124 out of 1,398,681 sequences were obtained from fecal samples collected pre-exercise and post-exercise, after 4 weeks of moderate exercise training (Additional file 1). An average of 49,951 denoised sequences per animal were obtained (average read length of 524.8) which composed an average of 583.1 distinct observed OTUs. Post-training samples presented a higher Shannon
index compared to pre-training samples (6.4 ± 0.5 vs. 6.8 ± 0.2) (Additional file 3). Detailed sequencing information from all individual rats is presented in (Additional file 3).
Bacterial diversity was assessed by rarefaction measure of observed species against the number of sequences per sample, and the observed OTUs were identified with 97% of identity. Here, the rarefaction measure showed that species diversity (Additional file 4: A; Wistar rats; B; Hypertensive rats and C; Obese rats) reached a plateau tendency in all samples as the number of sequences increased, indicating that in the present study more sequences are unlikely to yield many additional species. As demonstrated in Additional file 4, the rarefaction curves revealed that OTU richness in post-exercise fecal samples is more species-rich than those found in the pre-exercise fecal samples. This was further evi-denced in hypertensive rats and obese rats samples (Additional file 4B and C).
Figure 1 Training parameters. Comparison between exercise training velocity from MLSS (vMLSS) before and after four weeks of treadmill running exercise at moderate intensity, indicating that all animals from each group enhanced their aerobic capacity as demonstrated by improvement in the MLSS corresponding to velocity (15 m.min−1for Obese rats and 3 0 m.min−1for Hypertensive and Wistar rats) (A). When the initial and final velocity of exercise training was compared, a significant reduction was evidenced in BLC of ~49% for Wistar rats, ~39% for Hypertensive rats and ~33% for Obese rats (p < 0.01) (B).
The relative abundance of the main dominant bacterial phylum from all fecal samples collected before and after exercise training is shown in Additional file 5A. Here, Firmicutes and Bacteroidetes are the most dominant phyla, followed by Proteobacteria. Firmicutes was shown to be enhanced after exercise training (1.1 fold change, p < 0.05) (Additional file 5B), thus being more evidenced in Obese rats (Obese rats; 0.69 ± 0.03 vs. Exercised Obese rats; 0.78 ± 0.04, p < 0.05). On the other hand, Proteobacteria were shown to be 1.8 fold reduced after exercise training (p < 0.05) (Additional file 5C). The Bacteroidetes phylum was shown to be 1.3 fold reduced after exercise only in Wistar rats (Wistar rats; 0.23 ± 0.04 vs. Exercised Wistar rats; 0.17 ± 0.03, p < 0.05).
Composition of bacterial communities before, during and after exercise training
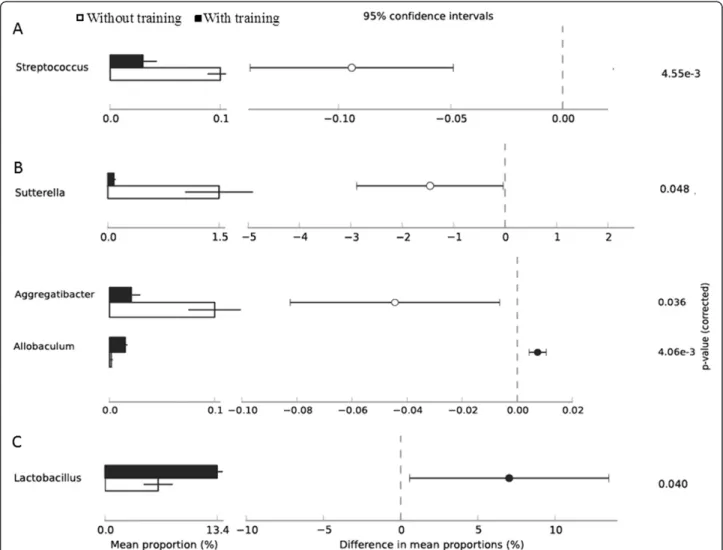
The relative abundance at bacterial genus level for all animal lineages in response to exercise training was assigned only to those that presented a minimum vari-ation at significant level (p < 0.05) (Figure 2). In Wistar rats (A), Streptococcus was the only genus that presented a significant alteration within its abundance, while untrained rats were more enriched with Streptococcus when com-pared to post-exercise (p < 0.05) (Figure 2A). In hyperten-sive rats, three genera (Allobaculum, Aggregatiobacter and Sutterella) were shown to be altered by exercise training. Despite minimal variation in the relative abundance of Allobaculum between pre-exercise and post-exercise samples, this genus was enriched by exercise training (p < 0.05) (Figure 2B). This was in contrast to Allobaculum, Aggregatibacter and Suturella where both were more abun-dant in pre-exercise samples (Figure 2B). Aggregatibacter presented a minimal variation in their relative abundance in fecal samples pre- and post-exercise training; however, exercise was shown to reduce the abundance of this genus (p < 0.05) (Figure 2B). The Suturella genus was also shown to be more enriched pre-exercise, with a greater relative pro-portion of all in this genus in hypertensive rats (p < 0.05). In Obese rats, Pseudomonas and Lactobacillus were both sig-nificantly altered after exercise training (Figure 2C). Minimal variation in Pseudomonas relative abundance was observed between samples (P < 0.05), while Lactobacillus presented the higher relative abundance after exercise from all iden-tified genera (p < 0.05) (Figure 2C).
The proportion of sequences (%) of the main bacterial species from fecal samples collected before and after exercise training is shown in box plots (Figure 3). In pre-exercise fecal samples (Figure 3A and B), only two species (Bacteroides acidifaciens and Ruminococcus flavefaciens) presented a significant differential abundance, in contrast to fecal samples post-exercise training, where six species (Streptococcus alactolyticus, Bifidobacterium animalis, Ruminococcus gnavus, Aggregatibacter pnemotropica and
Bifidobacterium pseudolongum) presented a differential abundance (Figure 3C-G). From all samples (pre and post-exercise) only one species (Ruminococcus flavefaciens) was less abundant in obese animals (Figure 3B), with all other species being significantly more enriched in the obese animals (Figure 3C-G).
Regarding pre-exercise samples, the proportion of sequences from the Bacteroides acidifaciens species was significantly more abundant in Obese rats than in Wistar and Hypertensive rats (p < 0.05) (Figure 3A). However, an opposite profile is observed in sequences attributed to the Ruminococcus flavefaciens species, where greater abundance is seen in Wistar rats followed by Hypertensive rats, with no abundance seen in Obese rats (p < 0.05) (Figure 3B). After exercise training, the proportion of sequences indicated that all listed species (Streptococcus alactolyticus, Bifidobacterium animalis, Ruminococcus gnavus, Aggregatibacter pneumotropica and Bifidobacterium pseudolongum) were more abundant in Obese rats compared to Wistar and Hypertensive rats lineages (Figure 3C-G respectively). The relative abundance of Streptococcus alactolyticus in Obese rats diverged signifi-cantly from Hypertensive and Wistar rats (p < 0.05), while a diminished proportion of sequences was seen in both rat strains (Figure 3C). The Bifidobacterium animalis species was seen to be highly enriched in Obese rats (p < 0.05) and absent in Wistar and Hypertensive rats (Figure 3D). In relation to Ruminococcus gnavus, this species was poor in Wistar and almost absent in Hypertensive rats, but more abundant in Obese rats (Figure 3E). The Aggregatibacter pneumotropicaspecies presented a similar profile to the previous species, being also more abundant in Obese rats compared to Wistar and Hypertensive rats (p < 0.05) (Figure 3F). Lastly, from the Actinobacteria phylum, Bifidobacterium pseudolongum abundance was almost exclusive to Obese rats (p < 0.05), being almost absent in Hypertensive rats and completely absent in Wistar rats group (Figure 3G).
Principal coordinates analysis (PCoA)
Principal coordinates analysis (PCoA) of unweighed UniFrac distances was calculated and compared be-tween all fecal samples collected pre and post-exercise from the three rat lineages in order to observe similarity in microbiota composition and the effect of exercise training (Figure 4). All three biological replicates from each animal lineage (Wistar, Hypertensive and Obese rats) were shown to cluster with a high correlation between them (R = 0.79, P < 0.001). UniFrac (PCoA) analysis showed that Wistar and Hypertensive rats share a similar bacterial composition, thus clustering far from Obese rats, indicating a distinct bacterial community composition between these rat lineages (Figure 4). It also indicated that microbiota from Wistar, Hypertensive and Obese rats were significantly
altered by exercise training, where pre-exercise samples clustered significantly far from fecal samples collected after four weeks of exercise training (Figure 4). However, even though exercise altered microbial community composition in every animal lineage, Wistar and Hypertensive rats still maintained a similar bacterial composition, still clustering far from Obese rats microbiota (Figure 4).
Correlation of bacterial abundance and lactate concentration
As shown in Figure 1A, when comparing the initial and final velocity of exercise training, a significant reduction in BLC was evidenced in all rat lineages, where lower BLC (means of 2.3 mmol.L−1, Figure 1B) is associated to an improved aerobic capacity from trained status when compared to higher BLC (3.8 mmol.L−1) from untrained rats (pre-exercise samples from all rat lineages). Therefore, fecal bacterial communities were plotted against BLC to establish a correlation between microbial abundance and training status (Figure 5). OTUs from two bacterial
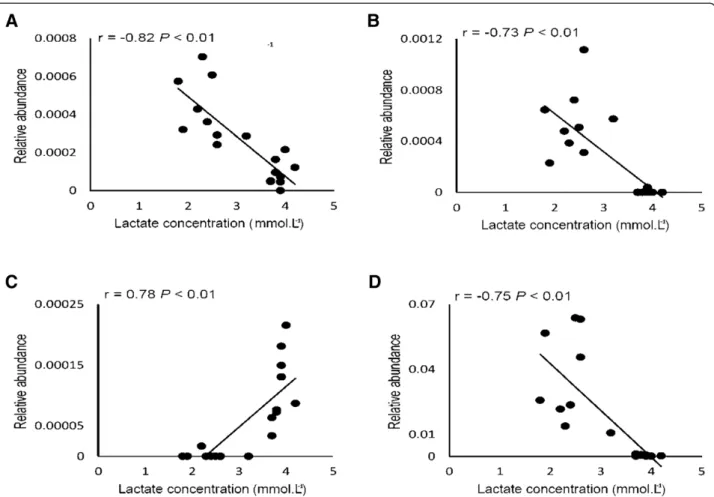
families (Clostridiaceae and Bacteroidaeae) and two genera (Oscillospira and Ruminococcus) were found to be significantly correlated with BLC. The OTU abundance from both bacterial families was negatively correlated to BLC (Clostridiaceae, R =−0.82 P < 0.01; Bacteroidaceae, R =−0.73 P < 0.01). In both cases, higher abundance in OTUs was observed to correlate with lower lactate con-centrations, indicating that exercise training may be fa-vorable to the proliferation of these OTUs from both bacterial families (Figure 5A and B). The relative abundance of OTUs from Bacteroidaceae family was shown to be close to zero when BLC reached ~4 mmol.L−1(Figure 5B), being associated with untrained status. Regarding the genera, the abundance of OTUs from Oscillospira and Ruminococcus genera presented divergent correlations with BLC. OTUs from Oscillospira were shown to be positively correlated to BLC (R = 0.78 P < 0.01) and Ruminococcus was negatively correlated (R =−0.75 P < 0.01) (Figure 5C and D). The OTUs from Oscillospira genus were shown to be almost
Figure 2 Effect of exercise on Genus relative abundance. Proportion of relative abundance for the statistical analyses of Genus level profiles distributed in Wistar rats (A), Hypertensive rats (B) and Obese rats (C). The genera were altered between without exercise training (white bar) and with exercise training (black bar). Features with aα-value of < 0.05 were considered significant.
absent in lower lactate concentrations, increasing their abundance with higher concentrations over 3.5 mmol.L−1, which indicates that exercise training may be seen as an unfavorable factor for a specific OTU from Oscillospira genus and its proliferation in gut environment (Figure 5C). However, the OTUs from Ruminococcus microbial genus were shown to be more abundant at lower lactate concentration and with almost no abundance at higher BLC, indicating that exercise training may also influence proliferation in this genus.
Discussion
Several environmental [44] and host-related factors [16] are known to affect gut microbiota composition. This dynamic ecosystem, highly susceptible to external agents, has a sym-biotic link with host health homeostasis. In this context, imbalanced gut microbiota has been associated with the de-velopment of inflammatory gastrointestinal diseases, obesity and altered metabolic status [19].
Recently, physical activity was shown to modulate gut microbiota in diet induced obesity [24], and in healthy ro-dents, altering the microbiota diversity and composition [23] and increasing n-Butyrate concentration in the cecum [22]. In contrast to some of these previous studies that used
PCR-TGGE [22] and PCR-DGGE of bacterial 16S rRNA genes [23], here a robust pyrosequencing of the 16S rRNA genes was used, along with controlled exercise training pa-rameters to investigate this relationship in non-pathologic and pathologic rat models.
Rarefaction measurements and Shannon index indicated that exercise training enhances bacterial diversity in non-pathological Wistar rats and in Obese and Hypertensive rats (Additional file 3 and Additional file 4). Here, Firmicutes and Bacteroidetes were found to be the most predominant phyla in all animal lineages (Additional file 5A). This predominance was also seen in mice cecum [6], and in exercised rats [23]. Considering all rat lineages, exer-cise was shown to enhance Firmicutes abundance and to diminish Proteobacteria content (Additional file 5B, C). Thus, Firmicutes were more abundant in post-exercise samples compared to pre-exercise in obese rats (Obese rats; 0.69 ± 0.03 vs. Exercised Obese rats; 0.78 ± 0.04, p < 0.05), while Bacteroidetes was shown to be reduced after training only in WR (Wistar rats; 0.23 ± 0.04 vs. Exercised Wistar rats; 0.17 ± 0.03, p < 0.05). Moreover, Bacteroidetes have been reported to be diminished in obese mice [10], while the ratio of Firmicutes to Bacteroidetes was shown to change in favor of Bacteroidetes in overweight and
(See figure on previous page.)
Figure 3 Species abundance profile of fecal sample before and after exercise training. Box plot showing the distribution in the proportion of sequences (%) of main species of each rat lineage (A; Bacteroides acidifaciens, B; Ruminococcus flavefaciens, C; Streptococcus alactolyticus, D; Bifidobacterium animalis, E; Ruminococcus gnavus, F; Aggregatibacter pneumotropica, G; Bifidobacterium pseudolongum) without exercise training (white box) and with exercise training (black box). The median value is shown as a line within the box and the mean value as a star, p-value for statistical significance was defined as p≤ 0.05.
Figure 4 Effect of exercise training on bacterial community. Principal coordinates analysis (PCoA) of unweighted UniFrac distances generated from fecal samples in Wistar rats (squares), Hypertensive rats (circles) and Obese rats (diamonds) collected from triplicate rats without exercise training (white symbols) and with exercise training (black symbols). The result of the ANOSIM similarity analyses confirmed that samples harbor a distinct bacterial community.
obese subjects, compared to the lean group [45]. Thus, as previously stated by Harris et al., [7] studying gut microbiota and their relation with metabolic disorders revealed that there is no difference between obese and lean individuals at phylum level. However, data here re-ported showed a significant alteration in bacterial com-munity abundance at phylum as well as at genus levels (Figure 2), which could be associated with the effects of exercise and/or pathological conditions.
Furthermore, our study revealed a significant alteration in bacterial community abundance at genus and species level as an effect of exercise and/or pathological stimuli (Figure 2).
In accordance with the PCoA analysis presented in this study (Figure 4), other studies have also reported a distinction between non-obese and obese microbiota from Zuckerfa/farats [46] and ob/ob mice [10]. We also reported that Wistar and Hypertensive rats share a similar microbiota composition (Figure 4). In a similar way, it was reported that rats treated with nitric oxide synthase inhibitor NG-nitro-L-arginine methyl ester (L-NAME)
develop hypertension, with a variation in cecal microbiota compared to control normotensive rats [18]. Regarding the effect of exercise, PCoA analysis demonstrated that four weeks of moderate exercise training significantly al-tered microbiota composition in all rat lineages (Figure 4). According to our results, different exercise volumes, 6 days [23], and 5 [22] and 12 weeks [24] of voluntary running exercise, were shown to alter microbiota composition, indicating that the microbial community is affected even by a few days of exercise. Together, these data suggest that besides other well-known factors, exercise may be seen as a potential environmental factor capable of modulating gut microbiota.
Here, exercise was also shown to significantly alter six bacterial genera (Figure 2). Fecal samples were more enriched with Allobaculum (Hypertensive rats), Pseudomonas (Obese rats) and Lactobacillus (Obese rats) after exercise training, while Streptococcus (Wistar rats), Aggregatibacter (Hypertensive rats) and Sutturela (Hypertensive rats) were shown to be more abundant before exercise training was performed(Figure 2). The
Figure 5 Microbial abundance and blood lactate concentration correlation. Correlations between the relative abundances of the bacterial communities (OTUs) and blood lactate concentration (mmol.L−1). Gut microbiota profile was determined by 16S rRNA pyrosequencing for Wistar rats, Hypertensive rats and Obese rats in fecal samples. Pearson correlation coefficients (r) are shown for each taxon (A; Clostridiaceae, B; Bacteroidaceae, C; Oscillospira, D; Ruminococcus), with the associated FDR-corrected P values.
Lactobacillus genus presented higher abundance after exercise only in Obese rats (13.4% p < 0.05) (Figure 2C). In agreement with our data, the recent study of Queipo-Ortuno et al. [23] revealed that Lactobacillus was also en-hanced with exercise in lean rats, with a longer exercise stimulus (6 weeks). Lactic acid bacteria (LAB), represented in our study by Lactobacillus (enriched after exercise), are associated with the mucosal surface of the small intestine and colon in animals, where they produce lactic acid though homo or heterofermentative metabolism [47]. In this second process, besides lactic acid, CO2, acetic acid and/or ethanol are produced [48], which may contribute to a more acidic environment [48]. It has been reported that LAB in the gastrointestinal tract leads to positive health benefits with influence on microflora, modulation of mucosal immunity and exclusion of pathogens [47]. The enrichment of Lactobacillus in Obese rats after exercise may have some influence on gastrointestinal acidity trough the production of acidic compounds (e.g. lactic acid, acetic acid); however, this parameter was not measured in the present study. The capillary blood lactic acid was measured in order to establish aerobic capacity and thus to be used as a parameter for adaptation to exercise. More-over, the lactate produced by Lactobacillus bacteria is con-verted into butyrate in the gut through bacteria such as B. Coccoides and E. rectale, also found to be enhanced after exercise [23]. Furthermore, butyrate is shown to be related to mucin synthesis and gut epithelium protection [49]. In another study, Matsunomo et al. [22] showed that exercise altered microbiota and enhanced n-butyrate concentration in rats’ cecum. Therefore, enhanced Lactobacillus found in Obese rats group may possibly have a positive role in the gastrointestinal environment of these animals. It has been reported that obesity-associated gut microbiota is enriched in some species of Lactobacillus (e.g. Lactobacillus reuteri) [50] while other species (e.g. Lactobacillus gasseri BNR17) are involved in metabolism regulation [51], presenting anti-obesity effects [52].
In our study, the Sutterela genus was more abundant before exercise training in Hypertensive rats (Figure 2B). The role of this genus in inflammatory bowel disease has been recently investigated with no relation being found [53]. Nevertheless, more research is needed to understand the relation of Sutturela with exercise and its possible gastrointestinal protective effect.
It is observed that these alterations in genera are not consistent across all host phenotypes. We believe that part of this inconsistency may be related to the biologic differences peculiar to each host genotype used in the study. Obesity has been shown to modulate gut microbiota [10,11], while no study has shown this yet in a hypertensive phenotype. Furthermore, as a first exploratory study to use different genotypes with different pathologies, it is interesting to note that the gut microbiota of 3 different
phenotypes (and 2 genotypes) was possibly altered by an external factor such as exercise.
Seven bacterial species were shown to have a significant differential abundance altered between the three animal lin-eages (Figure 3). From fecal samples collected pre-exercise, only Bacteroides acidifaciens and Ruminococcus flavefaciens presented a significant differential abundance (Figure 3A and B). While Bacteroides acidifaciens was more enriched in Obese rats compared to Wistar and Hypertensive rats (Figure 3A), Ruminococcus flavefaciens showed an opposite profile, being more enriched in Wistar rats followed by Hypertensive rats and significantly depleted in Obese rats (Figure 3B). B acidifaciens has recently been shown to have an important role in the production of imunoglobulin (IgA) in the large intestine of mice [54]. This production plays an adaptive role in the intestinal mucosal immune system [55]. Since IgA is enhanced in metabolic disorders [56], the relative abundance of Bacteroides acidifaciens in Obese rats (Figure 3A) may be associated with the role of gut microbiota in the inflammatory signalling peculiar to obesity [57]. Otherwise, Ruminococcus flavefaciens is a cellulolytic bacterium present in the rumen of mammals, and it has been shown to be inhibited by probiotic supple-mentation (L. acidophilus NCFM) in young rats [58]. Our data indicate that the obesity phenotype from obese rats may suppress this particular species.
In samples collected after training, Streptococcus alactolyticus, Bifidobacterium animalis, Ruminococcus gnavus, Aggregatibacter pnemotropicaand Bifidobacterium pseudolongum were all more abundant in Obese rats (Figure 3C-G). Streptococcus alactolyticus and Bifidobacterium animalis species were shown to be present in the gut of obese rats. In contrast to our data, Bifidobacterium is often associated with lean pheno-types [19]; however, our study showed that this species was completely absent in non-obese Wistar rats and Hypertensive rats (Figure 3D). Regarding the relative abundance of Ruminococcus gnavus in Obese rats, this species is known to have an antibacterial effect and to protect the host from pathogens [59], also found to be reduced in colon cancer tissue [60]. However, this species was also shown to be enhanced in diverticulitis [61], which is commonly associated with obesity [62]. Bifidobacterium pseudolongum was another species almost exclusively in Obese rats (Figure 3G). Moreover, the content of this spe-cies was shown to be enhanced in obese mice induced by diet and probiotic administration, when compared to a group of mice without probiotic supplementation [63].
In the present study, the MLSS was used to assess aerobic improvement as a result of four weeks of exercise training at moderate intensity [2]. Thus, after exercise training, a significant reduction in BLC was observed in all rat line-ages (Figure 1B), which is associated with an improved aerobic capacity when compared to higher BLC from
untrained rats (Figure 1B). The OTUs from Oscillospira and Ruminococcus families were found to be negatively correlated with BLC (Clostridiaceae, R =−0.82, P < 0.01; Bacteroidaceae, R =−0.73 P < 0.01) as were the OTUs from Ruminococcus genus (R =−0.75 P < 0.01). In these three cases, the greatest relative abundance of OTUs in both families is correlated with lower BLC, indicating that ex-ercise training may be favorable to the proliferation of these specific OTUs (Figure 5A, B and D). Otherwise, OTUs from Oscillospira presented a positive correlation with BLC (R = 0.78, P < 0.01) (Figure 5C). The relative abundance within these OTUs is seen to increase when the concentration of lactate goes over ~3.5 mmol.L−1. Since lower BLC during the MLSS test was associated with a more trained status, this result may indicate that exercise training may affect the abundance of the OTUs from this genus.
Conclusions
These findings suggest that exercise training is capable of altering gut microbiota at genus level, with significant alteration in bacterial composition and diversity in obese, non-obese and hypertensive rats. Exercise was shown to enhance the relative abundance of three genera, with Lactobacillus being the most abundant, while another three genera were shown to be more abundant before exercise training (Streptococcus, Aggregatibacter and Sutterella). Non-obese Wistar rats and spontaneously hypertensive rats were shown to share similar microbiota, unlike Obese rats. Rat lineages were also shown to harbor a differential abundance at species level, and six species were shown to be significantly more abundant in obese rats. Two bacterial families (Clostridiaceae and Bacteroidaceae) and two genera (Oscillospira and Ruminococcus) were also shown to sig-nificantly correlate with blood lactate accumulation, while exercise was shown to be favorable to the two families and Ruminococcus genus in opposition to Oscillospira. In conclusion, this is the first study to use controlled ex-ercise parameters to assess gut bacterial community modification in three different animal lineages, which may reflect the potential of exercise to alter gut microbial community. However, the effect of exercise on the acidity of lumen or fecal samples was not measured, which limits us in establishing a direct link between exercise and gut alteration by acidic induction. Thus, more studies are necessary to establish these modifications as possible therapeutic implications for obesity or hypertension treat-ment through the modulation of gut microbiota.
Additional files
Additional file 1: Experimental design. Obese rats (n = 3), Wistar rats (n = 3) and Hypertensive rats (n = 3) were used to verify the effect of four weeks of moderate exercise training on gut microbiota. Fecal samples were collected before and after exercise training. After DNA extraction,
barcoded pyrosequencing of the rRNA genes was used to determine the gut microbiota modifications.
Additional file 2: Characterization of the hypertensive phenotype. Histogram of blood pressure profile from Wistar rats and spontaneously Hypertensive rats measured by the tail-cuff method at the beginning of the experiment. Hypertensive rats showed a significantly higher systolic blood pressure (171.4 ± 7.7 mmHg) when compared to Wistar rats (128 ± 5.9 mmHg), indicating the hypertensive phenotype of this rat group.
Additional file 3: Table with the frequency of bacterial communities pre and post exercise training revealed by 16S rRNA pyrosequencing analysis.
Additional file 4: Microbial alpha diversity. Rarefaction curves for fecal samples, each with at least 23,000 16S rRNA sequences. Each line connects an average number (±SD) of observed 97% OTUs for (A) Wistar rats; (B) Hypertensive rats and (C) Obese rats. The color blue indicates the richness of bacterial communities without training and red indicates with training.
Additional file 5: Composition of fecal microbiota population of Wistar, Hypertensive and Obese rats before and after exercise training. Bacterial distribution evaluated at the main phylum taxonomical level in fecal samples from Wistar, Hypertensive and Obese rats, collected from triplicate rats before and after four weeks of exercise training (A). Results are shown for the independent samples described in Additional file 3, where the letter“E” represents the samples with exercise training. Boxplots of Firmicutes (B) and Proteobacteria (C) abundance pre and post-exercise.
Competing interests
The author(s) declare that they have no competing interests.
Authors’ contributions
BAP: Conceived the study, and carried out all experimental procedures and drafted the manuscript, APC: carried out the bioinformatics design, performed the statistical analysis and revised the manuscripts, JAA: carried out the experimental procedures and revised the manuscript, CPCG: carried out the experimental procedures and revised the manuscript, GRF: carried out the bioinformatics and statistics design and revised the manuscript, RHK: participated in the study design and revised the manuscript, RWP: participated in the study design and revised the manuscript, OLF: participated in the study design, revised all experimental procedures and drafted and revised the manuscript. All authors read and approved the final manuscript.
Acknowledgments
The authors acknowledge grant support from CNPq, CAPES, FAPDF and Catholic University of Brasilia– Brazil.
Author details
1Centro de Análises Proteômicas e Bioquímicas, Programa de Pós-Graduação em Ciências Genômicas e Biotecnologia da Universidade Católica de Brasília, Brasília, DF, Brazil.2Laboratorio de Enzimologia, Departamento de Biologia Celular, Universidade de Brasília, Brasília, DF, Brazil.3Programa de
Pós-Graduação em Educação Física, Universidade Católica de Brasília, Brasília, DF, Brazil.4Universidade Católica Dom Bosco, Pos-Graduação em
Biotecnologia, Campo Grande, MS, Brazil.5UDF centro Universitário, Brasília, DF, Brasil.
Received: 3 December 2013 Accepted: 17 June 2014 Published: 21 June 2014
References
1. WHO: Global Recommendations on Physical Activity for Health. Geneva, Switzerland: WHO Library Cataloguing-in-Publication Data; 2010. 2. Almeida JA BAP, Gomes CP, Araujo RC, Pereira RW, Franco OL: Exercise
training at MLSS decreases weight gain and increases aerobic capacity in obese zucker rats. Int J Sports Med 2014, 35(3):199–202.
3. Halliwill JR, Buck TM, Lacewell AN, Romero SA: Postexercise hypotension and sustained postexercise vasodilatation: what happens after we exercise? Exp Physiol 2013, 98(1):7–18.
4. Mende CW: Obesity and hypertension: a common coexistence. J Clin Hypertens (Greenwich) 2012, 14(3):137–138.
5. Haslam DW, James WP: Obesity. Lancet 2005, 366:1197–1209.
6. Turnbaugh PJ, Ley RE, Mahowald MA, Magrini V, Mardis ER, Gordon JI: An obesity-associated gut microbiome with increased capacity for energy harvest. Nature 2006, 444(7122):1027–1031.
7. Harris K, Kassis A, Major G, Chou CJ: Is the gut microbiota a new factor contributing to obesity and its metabolic disorders? J Obes 2012, 2012:879151. 8. Qin J, Li R, Raes J, Arumugam M, Burgdorf KS, Manichanh C, Nielsen T, Pons
N, Levenez F, Yamada T, Mende DR, Li J, Xu J, Li S, Li D, Cao J, Wang B, Liang H, Zheng H, Xie Y, Tap J, Lepage P, Bertalan M, Batto JM, Hansen T, Le Paslier D, Linneberg A, Nielsen HB, Pelletier E, Renault P, et al: A human gut microbial gene catalogue established by metagenomic sequencing. Nature 2010, 464(7285):59–65.
9. Turnbaugh PJ, Hamady M, Yatsunenko T, Cantarel BL, Duncan A, Ley RE, Sogin ML, Jones WJ, Roe BA, Affourtit JP, Egholm M, Henrissat B, Heath AC, Knight R, Gordon JI: A core gut microbiome in obese and lean twins. Nature 2009, 457(7228):480–484.
10. Ley RE, Backhed F, Turnbaugh P, Lozupone CA, Knight RD, Gordon JI: Obesity alters gut microbial ecology. Proc Natl Acad Sci U S A 2005, 102(31):11070–11075.
11. Ley RE, Turnbaugh PJ, Klein S, Gordon JI: Microbial ecology: human gut microbes associated with obesity. Nature 2006, 444(7122):1022–1023. 12. Murphy EF, Cotter PD, Healy S, Marques TM, O'Sullivan O, Fouhy F, Clarke
SF, O'Toole PW, Quigley EM, Stanton C, Ross PR, O'Doherty RM, Shanahan F: Composition and energy harvesting capacity of the gut microbiota: relationship to diet, obesity and time in mouse models. Gut 2010, 59(12):1635–1642.
13. Perez-Cobas AE, Gosalbes MJ, Friedrichs A, Knecht H, Artacho A, Eismann K, Otto W, Rojo D, Bargiela R, Von Bergen M, von Bergen M, Neulinger SC, Daumer C, Heinsen FA, Latorre A, Barbas C, Seifert J, Dos Santos VM, Ott SJ, Ferrer M, Moya A: Gut microbiota disturbance during antibiotic therapy: a multi-omic approach. Gut 2012.
14. Nelson AM, Walk ST, Taube S, Taniuchi M, Houpt ER, Wobus CE, Young VB: Disruption of the human gut microbiota following Norovirus infection. PLoS One 2012, 7(10):e48224.
15. Santacruz A, Marcos A, Warnberg J, Marti A, Martin-Matillas M, Campoy C, Moreno LA, Veiga O, Redondo-Figuero C, Garagorri JM, Azcona C, Delgado M, Garcia-Fuentes M, Collado MC, Sanz Y: Interplay between weight loss and gut microbiota composition in overweight adolescents. Obesity (Silver Spring) 2009, 17(10):1906–1915.
16. Nicholson JK, Holmes E, Kinross J, Burcelin R, Gibson G, Jia W, Pettersson S: Host-gut microbiota metabolic interactions. Science 2012, 336(6086):1262–1267. 17. Fei N, Zhao L: An opportunistic pathogen isolated from the gut of an
obese human causes obesity in germfree mice. ISME J 2013, 7(4):880–884. 18. Xu J, Ahren IL, Prykhodko O, Olsson C, Ahrne S, Molin G: Intake of blueberry
fermented by lactobacillus plantarum affects the Gut microbiota of L-NAME treated rats. Evid Based Complement Alternat Med 2013, 2013:809128. 19. Million M, Raoult D: The role of the manipulation of the gut microbiota in
obesity. Curr Infect Dis Rep 2013, 15(1):25–30.
20. Aroniadis OC, Brandt LJ: Fecal microbiota transplantation: past, present and future. Curr Opin Gastroenterol 2013, 29(1):79–84.
21. De Oliveira EP, Burini RC: The impact of physical exercise on the gastrointestinal tract. Curr Opin Clin Nutr Metab Care 2009, 12(5):533–538. 22. Matsumoto M, Inoue R, Tsukahara T, Ushida K, Chiji H, Matsubara N, Hara H:
Voluntary running exercise alters microbiota composition and increases n-butyrate concentration in the rat cecum. Biosci Biotechnol Biochem 2008, 72(2):572–576.
23. Queipo-Ortuno MI, Seoane LM, Murri M, Pardo M, Gomez-Zumaquero JM, Cardona F, Casanueva F, Tinahones FJ: Gut microbiota composition in male Rat models under different nutritional status and physical activity and its association with serum leptin and ghrelin levels. PLoS One 2013, 8(5):e65465. 24. Evans CC, LePard KJ, Kwak JW, Stancukas MC, Laskowski S, Dougherty J,
Moulton L, Glawe A, Wang Y, Leone V, Antonopoulos DA, Smith D, Chang EB, Ciancio MJ: Exercise prevents weight gain and alters the gut microbiota in a mouse model of high fat diet-induced obesity. PLoS One 2014, 9(3):e92193. 25. Zucker LM, Antoniades HN: Insulin and obesity in the Zucker genetically
obese rat“fatty”. Endocrinology 1972, 90(5):1320–1330.
26. Okamoto AK: Development of a strain of spontaneously hypertensive rat. Jap Circ J 1963, 27:282–293.
27. Almeida JA, Petriz BA, Gomes CP, Pereira RW, Franco OL: Assessment of maximal lactate steady state during treadmill exercise in SHR. BMC Res Notes 2012, 5:661.
28. Almeida JA, Petriz BA, Gomes CP, Rocha LA, Pereira RW, Franco OL: Determination of the maximal lactate steady state in obese Zucker rats. Int J Sports Med 2013, 34(3):214–217.
29. Fritz M, Rinaldi G: Blood pressure measurement with the tail-cuff method in Wistar and spontaneously hypertensive rats: influence of adrenergic- and nitric oxide-mediated vasomotion. J Pharmacol Toxicol Methods 2008, 58(3):215–221.
30. Barringer DL, Bunag RD: Uneven blunting of chronotropic baroreflexes in obese Zucker rats. Am J Physiol 1989, 256(2 Pt 2):H417–H421.
31. O’Donnell MP, Kasiske BL, Cleary MP, Keane WF: Effects of genetic obesity on renal structure and function in the Zucker rat II. Micropuncture studies. J Lab Clin Med 1985, 106(5):605–610.
32. Alonso-Galicia M, Brands MW, Zappe DH, Hall JE: Hypertension in obese Zucker rats. Role of angiotensin II and adrenergic activity. Hypertension 1996, 28(6):1047–1054.
33. Kurtz TW, Morris RC, Pershadsingh HA: The Zucker fatty rat as a genetic model of obesity and hypertension. Hypertension 1989, 13(6 Pt 2):896–901. 34. Billat VL, Sirvent P, Py G, Koralsztein JP, Mercier J: The concept of maximal
lactate steady state: a bridge between biochemistry, physiology and sport science. Sports Med 2003, 33(6):407–426.
35. Armougom FDR: Exploring microbial diversity using 16S rRNA high-throughput methods. J Comput Sci Syst Biol 2009, 2(1):74–92. 36. Caporaso JG, Kuczynski J, Stombaugh J, Bittinger K, Bushman FD, Costello
EK, Fierer N, Pena AG, Goodrich JK, Gordon JI, Huttley GA, Kelley ST, Knights D, Koenig JE, Ley RE, Lozupone CA, McDonald D, Muegge BD, Pirrung M, Reeder J, Sevinsky JR, Turnbaugh PJ, Walters WA, Widmann J, Yatsunenko T, Zaneveld J, Knight R: QIIME allows analysis of high-throughput community sequencing data. Nat Methods 2010, 7(5):335–336.
37. Reeder J, Knight R: Rapidly denoising pyrosequencing amplicon reads by exploiting rank-abundance distributions. Nat Methods 2010, 7(9):668–669. 38. DeSantis TZ, Hugenholtz P, Larsen N, Rojas M, Brodie EL, Keller K, Huber T,
Dalevi D, Hu P, Andersen GL: Greengenes, a chimera-checked 16S rRNA gene database and workbench compatible with ARB. Appl Environ Microbiol 2006, 72(7):5069–5072.
39. Edgar RC: Search and clustering orders of magnitude faster than BLAST. Bioinformatics 2010, 26(19):2460–2461.
40. Haas BJ, Gevers D, Earl AM, Feldgarden M, Ward DV, Giannoukos G, Ciulla D, Tabbaa D, Highlander SK, Sodergren E, Methe B, DeSantis TZ, Human Microbiome C, Petrosino JF, Knight R, Birren BW: Chimeric 16S rRNA sequence formation and detection in Sanger and 454-pyrosequenced PCR amplicons. Genome Res 2011, 21(3):494–504.
41. Wang Q, Garrity GM, Tiedje JM, Cole JR: Naive Bayesian classifier for rapid assignment of rRNA sequences into the new bacterial taxonomy. Appl Environ Microbiol 2007, 73(16):5261–5267.
42. Clarke KR: Non-parametric multivariate analyses of changes in community structure. Aust J Ecol 1993, 18:117–143.
43. Parks DH, Beiko RG: Identifying biologically relevant differences between metagenomic communities. Bioinformatics 2010, 26(6):715–721.
44. Natividad JM, Verdu EF: Modulation of intestinal barrier by intestinal microbiota: pathological and therapeutic implications. Pharmacol Res 2013, 69(1):42–51. 45. Schwiertz A, Taras D, Schafer K, Beijer S, Bos NA, Donus C, Hardt PD:
Microbiota and SCFA in lean and overweight healthy subjects. Obesity (Silver Spring) 2010, 18(1):190–195.
46. Waldram A, Holmes E, Wang Y, Rantalainen M, Wilson ID, Tuohy KM, McCartney AL, Gibson GR, Nicholson JK: Top-down systems biology modeling of host metabotype-microbiome associations in obese rodents. J Proteome Res 2009, 8(5):2361–2375.
47. Klaenhammer T, Altermann E, Arigoni F, Bolotin A, Breidt F, Broadbent J, Cano R, Chaillou S, Deutscher J, Gasson M, van de Guchte M, Guzzo J, Hartke A, Hawkins T, Hols P, Hutkins R, Kleerebezem M, Kok J, Kuipers O, Lubbers M, Maguin E, McKay L, Mills D, Nauta A, Overbeek R, Pel H, Pridmore D, Saier M, van Sinderen D, Sorokin A, et al: Discovering lactic acid bacteria by genomics. Antonie Van Leeuwenhoek 2002, 82(1–4):29–58. 48. Makarova K, Slesarev A, Wolf Y, Sorokin A, Mirkin B, Koonin E, Pavlov A,
Pavlova N, Karamychev V, Polouchine N, Shakhova V, Grigoriev I, Lou Y, Rohksar D, Lucas S, Huang K, Goodstein DM, Hawkins T, Plengvidhya V, Welker D, Hughes J, Goh Y, Benson A, Baldwin K, Lee JH, Diaz-Muniz I, Dosti
B, Smeianov V, Wechter W, Barabote R, et al: Comparative genomics of the lactic acid bacteria. Proc Natl Acad Sci U S A 2006, 103(42):15611–15616. 49. Peng L, Li ZR, Green RS, Holzman IR, Lin J: Butyrate enhances the
intestinal barrier by facilitating tight junction assembly via activation of AMP-activated protein kinase in Caco-2 cell monolayers. J Nutr 2009, 139(9):1619–1625.
50. Armougom F, Henry M, Vialettes B, Raccah D, Raoult D: Monitoring bacterial community of human gut microbiota reveals an increase in Lactobacillus in obese patients and Methanogens in anorexic patients. PLoS One 2009, 4(9):e7125.
51. Xie N, Cui Y, Yin YN, Zhao X, Yang JW, Wang ZG, Fu N, Tang Y, Wang XH, Liu XW, Wang CL, Lu FG: Effects of two Lactobacillus strains on lipid metabolism and intestinal microflora in rats fed a high-cholesterol diet. BMC Complement Altern Med 2011, 11:53.
52. Kang JH, Yun SI, Park HO: Effects of Lactobacillus gasseri BNR17 on body weight and adipose tissue mass in diet-induced overweight rats. J Microbiol 2010, 48(5):712–714.
53. Mukhopadhya I, Hansen R, Nicholl CE, Alhaidan YA, Thomson JM, Berry SH, Pattinson C, Stead DA, Russell RK, El-Omar EM, Hold GL: A comprehensive evaluation of colonic mucosal isolates of Sutterella wadsworthensis from inflammatory bowel disease. PLoS One 2011, 6(10):e27076.
54. Yanagibashi T, Hosono A, Oyama A, Tsuda M, Suzuki A, Hachimura S, Takahashi Y, Momose Y, Itoh K, Hirayama K, Takahashi K, Kaminogawa S: IgA production in the large intestine is modulated by a different mechanism than in the small intestine: Bacteroides acidifaciens promotes IgA production in the large intestine by inducing germinal center formation and increasing the number of IgA+ B cells. Immunobiology 2013, 218(4):645–651.
55. Peterson DA, McNulty NP, Guruge JL, Gordon JI: IgA response to symbiotic bacteria as a mediator of gut homeostasis. Cell Host Microbe 2007, 2(5):328–339.
56. Rodriguez-Segade S, Camina MF, Carnero A, Lorenzo MJ, Alban A, Quinteiro C, Lojo S: High serum IgA concentrations in patients with diabetes mellitus: agewise distribution and relation to chronic complications. Clin Chem 1996, 42(7):1064–1067.
57. Hotamisligil GS: Inflammation and metabolic disorders. Nature 2006, 444(7121):860–867.
58. Kaplan CW, Astaire JC, Sanders ME, Reddy BS, Kitts CL: 16S ribosomal DNA terminal restriction fragment pattern analysis of bacterial communities in feces of rats fed Lactobacillus acidophilus NCFM. Appl Environ Microbiol 2001, 67(4):1935–1939.
59. Dabard J, Bridonneau C, Phillipe C, Anglade P, Molle D, Nardi M, Ladire M, Girardin H, Marcille F, Gomez A, Fons M: Ruminococcin A, a new lantibiotic produced by a Ruminococcus gnavus strain isolated from human feces. Appl Environ Microbiol 2001, 67(9):4111–4118.
60. Chen W, Liu F, Ling Z, Tong X, Xiang C: Human intestinal lumen and mucosa-associated microbiota in patients with colorectal cancer. PLoS One 2012, 7(6):e39743.
61. Hansen SG, Skov MN, Justesen US: Two cases of Ruminococcus gnavus bacteremia associated with diverticulitis. J Clin Microbiol 2013, 51(4):1334–1336.
62. Strate LL, Liu YL, Aldoori WH, Syngal S, Giovannucci EL: Obesity increases the risks of diverticulitis and diverticular bleeding. Gastroenterology 2009, 136(1):115–122. e111.
63. Park DY, Ahn YT, Park SH, Huh CS, Yoo SR, Yu R, Sung MK, McGregor RA, Choi MS: Supplementation of Lactobacillus curvatus HY7601 and Lactobacillus plantarum KY1032 in diet-induced obese mice is associated with gut microbial changes and reduction in obesity. PLoS One 2013, 8(3):e59470.
doi:10.1186/1471-2164-15-511
Cite this article as: Petriz et al.: Exercise induction of gut microbiota modifications in obese, non-obese and hypertensive rats. BMC Genomics 2014 15:511.
Submit your next manuscript to BioMed Central and take full advantage of:
• Convenient online submission
• Thorough peer review
• No space constraints or color figure charges
• Immediate publication on acceptance
• Inclusion in PubMed, CAS, Scopus and Google Scholar
• Research which is freely available for redistribution
Submit your manuscript at www.biomedcentral.com/submit