Universidade de Aveiro Departamento de Engenharia Mecˆanica 2016
Edgar Jos´
e Ferreira
S˜
ao Bento Martins
Aplica¸
c˜
ao e caracteriza¸
c˜
ao de revestimentos de
´
oxido de grafeno em fibras ´
oticas para
Universidade de Aveiro Departamento de Engenharia Mecˆanica 2016
Edgar Jos´
e Ferreira
S˜
ao Bento Martins
Application and characterization of graphene oxide
coatings onto optical fibers for sensor development
Universidade de Aveiro Departamento de Engenharia Mecˆanica 2016
Edgar Jos´
e Ferreira
S˜
ao Bento Martins
Application and characterization of graphene oxide
coatings onto optical fibers for sensor development
Disserta¸c˜ao apresentada `a Universidade de Aveiro para cumprimento dos requisitos necess´arios `a obten¸c˜ao do grau de Mestre em Engenharia Mecˆanica, realizada sob a orienta¸c˜ao cient´ıfica da Doutora Paula
Alexandrina de Aguiar Pereira Marques, Investigadora Principal do Departamento de Engenharia Mecˆanica da Universidade de Aveiro e co-orienta¸c˜ao cient´ıfica da Doutora N´elia Jord˜ao Alberto, Investigadora de P´os Doutoramento do Instituto de Telecomunica¸c˜oes e do Centro de Tecnologia Mecˆanica e Automa¸c˜ao da Universidade de Aveiro.
O j´uri
Presidente Doutor V´ıtor Manuel Ferreira dos Santos
Professor Associado da Universidade de Aveiro
Arguente Doutor Rog´erio Nunes Nogueira
Investigador Principal no Instituto de Telecomunica¸c˜oes
Co-orientadora Doutora N´elia Jord˜ao Alberto
Investigadora de P´os Doutoramento do Instituto de Telecomunica¸c˜oes e do Centro de Tecnologia Mecˆanica e Automa¸c˜ao da Universidade de Aveiro.
Agradecimentos Agrade¸co aos meus pais todos os valores que me transmitiram e todo o apoio dado ao longo de 17 anos de estudos, desde o primeiro dia na Escola Prim´aria at´e este momento.
`
A minha irm˜a pelo apoio e carinho que sempre me trasmitiu.
Aos meus colegas e amigos por todos os momentos fant´asticos que pass´amos juntos durante este percurso.
Aos v´arios clubes por onde passei como atleta que ajudaram na minha forma¸c˜ao como ser humano.
Aos docentes do Departamento de Engenharia Mecˆanica pelos ensinamentos transmitidos.
Ao Mestre Andr´e Gir˜ao pela ajuda na prepara¸c˜ao do ´oxido de grafeno. `
A Professora Florinda Costa, aos Mestres Ant´onio Fernandes e Nuno Santos do Departamento de F´ısica pela realiza¸c˜ao das an´alises de SEM e Raman. Ao Doutor Igor Bdikin pela realiza¸c˜ao da an´alise de AFM.
Ao Mestre Daniel Duarte pela ajuda no tratamento de dados das redes de Bragg inclinadas.
Ao Professor Victor Neto pela motiva¸c˜ao que me transmitiu ao longo do processo e pelos bons conselhos que me deu.
`
A Doutora Paula Marques por toda a ajuda na realiza¸c˜ao da disserta¸c˜ao e na escrita deste documento.
`
A Doutora N´elia Alberto por toda a ajuda na montagem experimental e no tratamento de dados. Obrigado tamb´em por n˜ao me deixar relaxar e conseguir ter um trabalho completo e de qualidade.
Ao Instituto de Telecomunica¸c˜oes, Departamento de Engenharia Mecˆanica, Centro de Tecnologia Mecˆanica e Automa¸c˜ao e Departamento de F´ısica, pelas condi¸c˜oes e disponibilidade de equipamentos para a realiza¸c˜ao deste trabalho.
Palavras-chave Fibra ´otica, ´oxido de grafeno, nanomateriais, redes de Bragg em fibra ´otica, sensores
Resumo Nos ´ultimos anos, o uso da fibra ´otica cresceu consideravelmente, sendo os sensores uma das suas maiores aplica¸c˜oes. Esta tecnologia tem diversas vantagens sobre os sensores convencionais tais como: imunidade a inter-ferˆencias eletromagn´eticas, biocompatibilidade e elevada sensibilidade. No entanto, h´a interesse cient´ıfico e industrial em melhorar o seu desempenho (sensibilidade, resolu¸c˜ao do sensor e gama de trabalho), sendo o revesti-mento da fibra ´otica com diversos materiais um dos procedimentos que poder´a ser usado para alcan¸car esse objectivo.
O ´oxido de grafeno ´e um derivado do carbono que resulta da exfolia¸c˜ao da grafite. Este nanomaterial consiste em folhas semelhantes `as do grafeno mas possui grupos funcionais de oxig´enio que podem reagir f´ısica ou quimi-camente com diversas esp´ecies.
No ˆambito desta disserta¸c˜ao foram revestidas fibras ´oticas com ´oxido de grafeno atrav´es da deposi¸c˜ao por camadas. Nos revestimentos variou-se o processo de deposi¸c˜ao e o n´umero de camadas. A caracteriza¸c˜ao foi feita atrav´es de espectroscopia de Raman, microscopia electr´onica de varrimento e microscopia de for¸ca at´omica. Para averiguar a integridade dos revesti-mentos imersos em solu¸c˜ao aquosa, foram realizados testes de lix´ıvia¸c˜ao. Os resultados da caracteriza¸c˜ao dos revestimentos confirmam a presen¸ca de ´
oxido de grafeno na superf´ıcie da fibra ´otica.
Depois de garantir a qualidade dos revestimentos procedeu-se ao desenvolvi-mento e caracteriza¸c˜ao dos sensores baseados em fibra ´otica com revesti-mentos de ´oxido de grafeno. Foram testadas duas configura¸c˜oes diferentes baseadas em redes de Bragg uniformes e inclinadas. Os sensores foram tes-tados sem e com revestimento a varia¸c˜oes de ´ındice de refra¸c˜ao, variando o procedimento de deposi¸c˜ao do ´oxido de grafeno e o n´umero de camadas. A corros˜ao do ferro ´e um dos maiores problemas enfrentados pelos engen-heiros. ´E a degrada¸c˜ao gradual dos metais provocada por rea¸c˜oes qu´ımicas resultantes da intera¸c˜ao do metal e o meio ambiente. Neste trabalho pretendeu-se, ainda, investigar a possibilidade do ´oxido de grafeno estab-elecer liga¸c˜oes qu´ımicas com o ferro, e assim permitir detectar o fen´omeno da corros˜ao. Neste caso os sensores foram testados em solu¸c˜oes de nitrato de ferro(III).
Verificou-se que h´a altera¸c˜ao das caracteristicas dos espetros das redes de Bragg quando s˜ao imersos em diferentes solu¸c˜oes, no entanto os resultados n˜ao s˜ao muito conclusivos quanto `as diferen¸cas entre os procedimentos de deposi¸c˜ao e ao n´umero de camadas.
Keywords Optical fiber, graphene oxide, nanomaterials, fiber Bragg gratings, sensors Abstract In the last years, the use of optical fibers has grown considerably, being
sensors one of the biggest applications. This technology has several ad-vantages over conventional sensor such as: immunity to electromagnetic interferences, biocompatibility and high sensitivity. However, there is a sci-entific and industrial interest to improve the sensor performance (sensitivity, resolution and working range). Coating the optical fiber sensor with differ-ent materials is one proceeding that can be used to achieve this goal. Graphene oxide is a carbon derivative which results from the exfoliation of graphite. This nanomaterial consists in graphene like sheets with oxy-gen functional groups that can react physicaly or chemically with different species.
In this work several optical fibers samples were coated with GO through the layer by layer method. Two different proceedings were tested as the influ-ence of the number of of graphene oxide layers. The coating characterization was made through Raman spectroscopy, scanning electron microscopy and atomic force microscopy. To test the integrity of the coatings immersed in aqueous solutions, a leaching test was carried out. The results of the characterization confirm the presence of graphene oxide in the optical fiber surface.
After ensuring the quality of the graphene oxide coatings, it was carried out the development and characterization of optical fiber based sensors with graphene oxide coatings. Were tested two different sensor configurations, one based in uniform Bragg gratings and the other in tilted Bragg grat-ings. The sensors were tested without and with coating to refractive index variations, changing the proceeding to deposit the graphene oxide and the number of layers.
Iron corrosion is one of the biggest problems faced by engineers. It is the gradual degradation of the metal by chemical reactions produced by the interactions of the metal with the environment. In this work, it was studied the possibility of the graphene oxide interact with the iron ion in order to detect the corrosion phenomenon. In this case, the sensors were tested in iron(III) nitrate solutions.
It was verified that there are alterations of the Bragg gratings spectra charac-teristics when they were immersed in different solutions, however the results are not conclusive concerning the influence of the coating proceeding used and the influence of the number of layers.
Contents
Contents i
List of figures iii
List of tables vii
Nomenclature ix
1 Motivation and objectives 1
2 Theoretical introduction 3
2.1 Bragg gratings in optical fiber . . . 3
2.1.1 Fiber optic . . . 3
2.1.2 Uniform fiber Bragg gratings . . . 4
2.1.3 Tilted fiber Bragg gratings . . . 5
2.1.4 Bragg gratings inscription . . . 7
2.2 Carbon nanostructures . . . 8
2.2.1 Graphene . . . 8
2.2.2 Graphene oxide . . . 10
2.2.3 Reduced graphene oxide . . . 10
2.3 Fiber optic sensors with graphene related coatings . . . 11
3 Graphene oxide coatings 13 3.1 Preparation of the graphene oxide solution . . . 13
3.2 Optical fiber coating with graphene oxide . . . 14
3.3 Graphene oxide coatings characterization . . . 16
3.3.1 Scanning electron microscopy . . . 16
3.3.2 Raman spectroscopy . . . 18
3.3.3 Atomic force microscopy . . . 21
3.3.4 Leaching test . . . 21
3.3.5 Conclusions . . . 26
4 Sensor development 27 4.1 Preparation of the GO coated Bragg grating based sensors . . . 27
4.2 Sensor characterization to refractive index variations . . . 30
4.2.1 FBG based sensor . . . 30
4.2.2 TFBG based sensor . . . 34 i
4.2.3 Conclusions . . . 37
4.3 Sensor characterization using iron(III) nitrate solutions . . . 38
4.3.1 FBG based sensor . . . 38 4.3.2 TFBG based sensor . . . 41 4.3.3 Conclusions . . . 43 5 Final considerations 45 5.1 Conclusions . . . 45 5.2 Future work . . . 46 References 47 ii
List of figures
2.1 Basic structure of an optical fiber with the typical dimensions . . . 3
2.2 Total internal reflection in a optical fiber . . . 4
2.3 Fiber Bragg grating structure and spectral response . . . 5
2.4 Schematic representation of a TFBG . . . 5
2.5 Transmission spectrum of a 8o TFBG immersed in water . . . 6
2.6 Savitzky-Golay method to calculate the smoothed value for a TFBG immersed in solutions with different refractive indices . . . 7
2.7 FBG inscription through the phase mask method . . . 8
2.8 TFBG inscription through the inclination of the phase mask, adapted from [21] 8 2.9 Different carbon structures: buckyballs, nanotubes, graphite (left to right) [23] 9 3.1 Results of the Zetasizer analysis a) before ultrasonic treatment, b) 1 hour, c) 2 hours and d) 3 hours of ultrasonic treatment . . . 14
3.2 Average size of the GO sheet as function of the ultrasonic treatment time . . 14
3.3 Schematic representation of the experimental setup used to coat the optical fibers . . . 16
3.4 SEM images of some GO coated optical fibers: a) F1A, b) F3A, c) F5A-1, d) F1B, e) F3B and f) F5B-1 . . . 17
3.5 SEM images of the GO coated fibers with five layers through the different proceedings: a) F5A-1, b) F5A-2, c) F5A-3, d) F5B-1, e) F5B-2 and f) F5B-3 18 3.6 Raman spectra of GO coatings produced with proceeding A, for samples with 1, 3 and 5 layers . . . 19
3.7 Raman spectra of GO coatings produced with proceeding B, for samples with 1, 3 and 5 layers . . . 19
3.8 Raman spectra of GO coatings produced with proceeding A, for three samples with 5 layers . . . 20
3.9 Raman spectra of GO coatings produced with proceeding B, for three samples with 5 layers . . . 20
3.10 AFM results: a) FO, b) F5A-1 and c) F5B-1 . . . 21
3.11 Leaching test experimental setup . . . 22
3.12 SEM images of the GO coated optical fibers prepared using proceeding A. Before the leaching test: a) F1A, b) F3A, and c) F5A After the leaching test: d) H1A, e) N1A and f) N5A . . . 23
3.13 SEM images of the GO coated optical fibers prepared using proceeding A. Before the leaching test: a) F1B, b) F3B, and c) F5B After the leaching test: d) H1B, e) N3B, f) N3B and g) N5B . . . 24
3.14 Raman spectra of the samples produced through proceeding A before and after
the leaching test . . . 25
3.15 Raman spectra of the samples produced through proceeding B before and after the leaching test . . . 25
4.1 Implemented experimental setup used for the Bragg gratings inscription . . . 27
4.2 a) FBG and b) TFBG based sensor configuration . . . 28
4.3 Variation of the refractive index as function of the solution concentration a) saccharose and b) Iron(III) nitrate solutions . . . 29
4.4 Experimental setup and respective schematic representation used to character-ize the response of the a), b) FBG and c), d) TFBG based sensors to refractive index variations . . . 30
4.5 Reflection spectra of the FBG5A sensor a) without and b) with GO coating for solutions with different RI . . . 30
4.6 a) Bragg wavelength and b) Peak intensity variation with different refractive indices for the uncoated and coated FBG5A sensor . . . 31
4.7 IntRFBG for the uncoated and GO coated FBG5A sensor as function of the RI 31 4.8 IntRFBG the FBG5B sensor, without and with the GO coating . . . 32
4.9 IntRFBG for the coated FBG5A and the FBG5B sensors . . . 32
4.10 IntRFBG for the a) FBG1A and for the b) FBG3A sensors . . . 33
4.11 IntRFBG for the GO coated FBG1A, FBG3A and FBG5A sensors . . . 33
4.12 Transmission spectra of the uncoated TFBG5A sensor immersed in solutions with different refractive indices: a) RI = 1.3327, b) RI = 1.3885 and c) RI= 1.4236 . . . 34
4.13 Transmission spectra of the GO coated TFBG5A sensor immersed in solutions with different refractive indices: a) RI = 1.3327, b) RI = 1.3885 and c) RI= 1.4236 . . . 34
4.14 Variation of the normalized S as function of the refractive index, for the un-coated and GO un-coated TFBG5A sensor . . . 35
4.15 Variation of the normalized S with the change of RI for the TFBG5B sensor, without and with GO coating . . . 35
4.16 Variation of the normalized S as function of the RI, for the GO coated TFBG5A and the TFBG5B sensors . . . 36
4.17 Variation of the normalized S with the change of RI for the TFBG3B sensor, without and with GO coating . . . 36
4.18 Variation of the normalized S as function of the refractive index, for the GO coated TFBG3B and TFBG5B sensors . . . 37
4.19 Reflection spectra of the a) uncoated and b) GO coated FBG5A sensor im-mersed in iron (III) nitrate solutions . . . 38
4.20 IntRFBGfor the FBG5A sensor in iron(III) nitrate solutions, without and with GO coating . . . 38
4.21 IntRFBGfor the FBG5B sensor immersed in iron (III) nitrate solutions, without and with GO coating . . . 39
4.22 IntRFBGfor the GO coated FBG5A and FBG5B sensors immersed in iron (III) nitrate solutions . . . 39
4.23 IntRFBG for the a) FBG1A and FBG3A sensors immersed in iron (III) nitrate solutions, without and with GO coating . . . 40
4.24 IntRFBGfor the GO coated FBG1A, FBG3A and FBG5A sensors immersed in iron (III) nitrate solutions . . . 40 4.25 Transmission spectra of the uncoated TFBG3B sensor immersed in iron(III)
nitrate solutions with different refractive indices: a) RI = 1.3327, b) RI = 1.3368 and c) 1.3562 . . . 41 4.26 Transmission spectra of the GO coated TFBG3B sensor immersed in iron(III)
nitrate solutions with different refractive indices: a) RI = 1.3327, b) RI = 1.3368 and c) 1.3562 . . . 41 4.27 Variation of the normalized S in different iron(III) nitrate solutions, for the
uncoated and GO coated TFBG3B sensor . . . 42 4.28 Variation of the normalized S in different iron(III) nitrate solutions for the
TFBG1B sensor, without and with GO coatings . . . 42 4.29 Variation of the normalized S in different iron(III) nitrate solutions, for the
GO coated TFBG1B and TFBG3B sensors . . . 43
List of tables
2.1 Graphene properties [9; 23; 25; 26] . . . 9
2.2 Optical fiber sensors with graphene related coatings . . . 12
3.1 Stages of the coating proceeding . . . 15
3.2 Identification of the optical fibers samples coated with GO . . . 15
3.3 Identification of the optical fibers samples coated with GO prepared for the leaching test . . . 22
4.1 Identification of the Bragg grating based sensor characterized using different solutions . . . 29
Nomenclature
Acronyms¯
xi Ith value of the smoothing function θT F BG Tilt angle of the Bragg grating
xi Ith value of the transmission spectrum in the linear scale Λ Periodic modulation of the refractive index (FBG) λB Reflected Bragg wavelength (FBG)
ΛTFBG Tilted fiber Bragg period
λTFBG Core resonance mode wavelength (TFBG) λiCladding Wavelength of the ith cladding mode
AFM Atomic force microscopy
ci Ion molar concentration
eFBG Etched fiber Bragg grating FBG Uniform fiber Bragg grating
FO Fiber optic
GO Graphene oxide
I Ionic strength
IntRFBG Intensity ratio of the uniform fiber Bragg grating based sensor neff Effective refractive index of the fiber core (FBG)
nieff,cladding Effective refractive index of the ith cladding mode at λicladding nieff,core Effective refractive index of the core mode
ONA Optical network analyzer PFresnel Fresnel reflected intensity
Ppeak Intensity of the FBG reflection peak ix
rGO Reduced graphene oxide
RH Relative humidity
RI Refractive index
S Standard deviation estimator
SEM Scanning electron microscopy
SPF Side-polished fiber
TFBG Tilted fiber Bragg grating
zi Charge number
Chemical compounds and chemical formulas
Ag Silver
Au Gold
Con A Concanavalin A
Fe Iron
Fe(NO3)3 Iron(III) nitrate
H2O Water
H2SO4 Sulfuric acid
HCl Hydrochloric acid
HF Hydrofluoridric acid
HNO3 Nitric acid
KClO3 Potassium chlorate KMnO4 Potassium permanganate
KrF Krypton fluoride
NaCl Sodium chloride
NaOH Sodium hydroxide
NH3 Ammonia
NO2 Nitrogen dioxide
PDDA Poly(diallyldimethylammonium chloride) PSS Poly(sodium styrene sulfonate)
Chapter 1
Motivation and objectives
In the last years, the optical fiber technology has grown considerably, and one of the most relevant applications is for sensing [1]. For instance, optical fiber based sensors are used for structural health monitoring [2], to monitor the respiratory movement [3], or even to detect and quantify the amount of dissolved hydrogen in transformer oil [4]. This type of sensors has several advantages over the conventional sensing schemes, such as: immunity to electromag-netic interference, inability to conduct electric current, biocompatibility and high sensitivity [5]. However, there is an permanent struggle to improve the sensors performance regarding its sensitivity, resolution and work range. A method to obtain this desired improvement is to coat the optical fiber with different materials. For instance, Wong, W. et al. [6] developed a polyvinyl alcohol coated photonic crystal optical fiber for relative humidity (RH) measure-ment and this coating improved the sensor sensitivity in the 50% to 90% RH range. Coelho, L. et al [7] developed a zinc oxide coated optical fiber which improved the refractive index properties of the fiber long period grating inscribed in the referred fiber.
There is an increasing interest in graphene and graphene based materials due to their exceptional properties. Graphene oxide (GO) is a nanomaterial that results from chemical exfoliation of graphite. This carbon based nanomaterial consists in graphene like sheets with reactive oxygen functional groups which allows the GO to establish chemical and physical interactions with diverse chemical species, nanoparticles, biostructures or even ions [8; 9].
The advantages of using optic fiber as sensing technology and the ability of GO to interact with other species can be a winning combination for a new generation of sensors. However, in order to explore simultaneously the advantages of the optical fiber technology and the GO properties is necessary to ensure that optical fiber is properly coated with GO.
In this work, two deposition procedures were tested, and after the optical fibers were coated, the GO coatings were characterized through scanning electron microscopy (SEM), Raman spectroscopy and atomic force microscopy (AFM). Leaching tests were also carried out in order to investigate if there is any change in the coating characteristics after the GO coated optical fiber is immersed in different environments (water and sodium chloride solution). This is the first stage of this work which aims to ensure coatings with quality to develop sensors.
After that the coating quality is guaranteed, two different sensors were developed based on Bragg gratings. One of them based on uniform fiber Bragg gratings and the other based on tilted fiber Bragg gratings. The sensitivity of sensors without and with GO coatings to refractive index (RI) variations was determined.
As referred previously, one of the most interesting properties of GO is the ability to interact with different species. Therefore, one of the objectives of this work was to explore that characteristic and to develop an optical fiber sensor based on Bragg gratings with GO coatings in order to detect the presence of the ferric ion in aqueous solutions. Iron (Fe) is the most widely used of all the metals and indispensable in engineering applications and structural components for buildings. Corrosion is a natural process which converts a metal to a more stable form in a given environment. It is the gradual destruction of materials by chemical reaction with the environment. Iron corrosion involves the formation of the Fe2+ and/or Fe3+ from the iron metal [10]. The detection of the corrosion phenomenon in an early stage may avoid severe structural damage and even prevent health problems.
Chapter 2
Theoretical introduction
2.1
Bragg gratings in optical fiber
2.1.1 Fiber optic
An optical fiber is composed by two cylindrical concentric parts: core and cladding, as presented in Figure 2.1. Usually, the core and cladding diameters are 9 μm and 125 μm, re-spectively. In addition to the core and cladding, there is a polymeric coating that protects the fiber from external damage, increasing the diameter to 250 μm. Regarding the composition, the optical fiber is essentially produced in silica or polymeric materials [5].
Figure 2.1: Basic structure of an optical fiber with the typical dimensions
The transmission of electromagnetic waves along the optical fiber is based on the total internal reflection where the refractive index of the cladding is slightly lower than the core refractive index to grant that light propagates through the fiber. In order to this phenomenon occurs is necessary that the signal is reflected in the core/cladding interface with a angle larger than the critical angle (Figure 2.2) [5].
Figure 2.2: Total internal reflection in a optical fiber
With the increased capability to detect losses on the propagated optical signal, it became possible to detect changes in phase, intensity and wavelength. On that account, fiber optic based sensing was born, and the development of fiber optic sensors started in 1977 [11]. The research on this field generated a variety of measurement techniques for different applications. There are several advantages of this sensing technology over the conventional methodologies, such as: easy integration into different types of structures; incapacity of conducting electric current; immunity to electromagnetic fields; small size; light weight; resistance to severe sur-roundings; high temperature performance; remote sensing capacity; multifunctional sensing [1; 5].
One of the most used sensing principles is based on Bragg gratings. In 1978, Hill, K.O. et al. demonstrated the first uniform fiber Bragg grating (FBG) in the Canadian Communication Research Center [12]. Since then, several configurations of Bragg gratings were produced, including tilted fiber Bragg gratings (TFBG), aperiodic fiber Bragg gratings and apodized Bragg gratings [13]. In the following subsections, brief descriptions of FBG and TFBG will be presented, since these are the types of Bragg gratings used in this work due to the ability to detect refractive index variations.
2.1.2 Uniform fiber Bragg gratings
A FBG is a periodic modulation of the refractive index along the fiber core. This modulation operates as a highly selective wavelength filter. When the transmitted signal satisfies the Bragg condition, it results in a reflected spectrum. The Bragg condition is given by the following equation [13]:
λB = 2nef fΛ (2.1)
where λBis the Bragg wavelength, neff is the effective refractive index of the fiber core and Λ is the periodic modulation of the refractive index.
The periodic modulation of the refractive index can be explained by the Fresnel reflection. When a electromagnetic wave travels through two dielectric media with different refractive indices, a partial reflection of the wave occurs. In the case of a FBG, there is a large number of these transitions, which can lead to a total reflection condition if all the contributions from the Fresnel reflections are added in phase. Figure 2.3 presents a FBG structure and how it works.
Figure 2.3: Fiber Bragg grating structure and spectral response
The sensor design explored in this work, based on the reflection mode and the Fresnel reflection, consists in an optical fiber tip coated with GO in conjunction with a FBG [14; 15; 16]. The sensing principle is based on the modulation of the Fresnel reflectivity at the fiber tip and the optical reflectivity ratio of the FBG in the reflection spectrum, when the RI varies. It was analyzed the Fresnel reflection intensity (baseline in the spectrum) and both intensity and wavelength of the FBG peak. To minimize impact of power fluctuation of the light source on the measurement, was considered an intensity ratio (IntRFBG), given by the following equation:
IntRF BG,dB= Ppeak,dBm− PF resnel,dBm (2.2)
where Ppeak and PFresnel represent the intensity of the FBG reflection peak and the Fresnel reflected intensity, respectively.
2.1.3 Tilted fiber Bragg gratings
Likewise a FBG, a TFBG is a periodic modulation of the refractive index of the fiber core, nevertheless in this case this modulation is tilted with respect to the longitudinal axis of the fiber, in order to enhance the coupling of the light from the core mode to the cladding modes [17]. Figure 2.4 presents a schematic representation of a TFBG.
Figure 2.4: Schematic representation of a TFBG
The cladding modes attenuate rapidly and are not observed in the reflection spectrum. The transmission spectrum possesses many resonance notches, as presented in Figure 2.5. The ghost mode corresponds to a set of cladding modes that interact weakly with the cladding boundary.
Figure 2.5: Transmission spectrum of a 8o TFBG immersed in water
The wavelengths of the core ressonance mode and the ith cladding ressonance modes are given by the following equations:
λT F BG= 2nef f,coreΛ cos θT F BG (2.3) λicladding = (n i ef f,core+ nief f,cladding)Λ cos θT F BG (2.4)
where neff,core, nieff,core and nieff,cladding are the effective indices of the core mode at λTFBG, the core mode and the ith cladding mode at λicladding, respectively. θT F BG is the tilt angle of the Bragg grating.
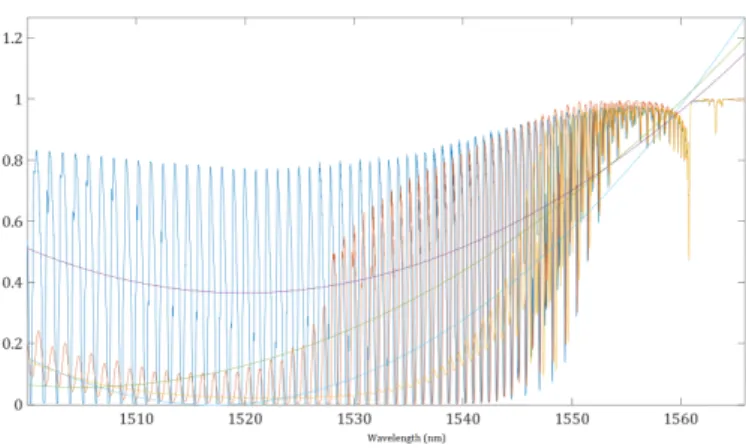
To analyze the transmission spectrum of a TFBG a demodulation method is needed. There are several possible methods, for example monitoring the wavelength shift of certain cladding mode [18] or calculating the spectrum area [19]. In this work, the method used is based on the calculation of a standard deviation estimator (S) [20]. For each TFBG transmission spectrum a smoothing function was calculated using the Savitzky-Golay method, that consists in a polynomial regression in order to determine a smoothed value, as shown in Figure 2.6. Comparing the method used in this work offers higher sensitivity than the area calculation method and it does not require the calculation of the peaks present in the transmission spectrum. This method might become useful when the spectrum presents low signal-to-noise ratio where the peaks are difficult to determine [20].
Figure 2.6: Savitzky-Golay method to calculate the smoothed value for a TFBG immersed in solutions with different refractive indices
Following the smoothing function for each spectrum, a standard deviation analysis was applied. This estimator (S) is presented in Equation 2.5:
S = v u u t 1 N − 1 N X i=1 (xi− ¯xi)2 (2.5)
where N is the total number of points that constitutes the transmission spectrum, xi cor-responds to the ith values of the transmission spectrum expressed in the linear scale and ¯x
i corresponds to the ith values of the smoothing function. This method does not require the detection of peaks and might become useful when the spectrum presents low IntRFBG [20]. 2.1.4 Bragg gratings inscription
Bragg gratings are normally produced by a interference fringe pattern in the UV region. The modulation can be achieved using, for example an interferometer where the UV light is divided and then combined in the fiber core creating a pattern. Other possibility is the point by point inscription.
In this work, the phase mask method was the one used to engrave the patterns. The phase mask is a optic diffraction element that consists in longitudinal depressions in a silica substrate. The basic principle underlying the phase mask method is based on the overlay of two diffractions orders in the fiber core. Due to the fact that is only used one optic element, this method is simple and allows stability in the Bragg grating reproduction [21; 22].
The FBG inscription proceeding using the phase mask method is presented in Figure 2.7. To inscribe TFBG, the phase mask is tilted in order to obtain an angle between the fiber and the phase mask, as shown in Figure 2.8.
Figure 2.7: FBG inscription through the phase mask method
Figure 2.8: TFBG inscription through the inclination of the phase mask, adapted from [21]
2.2
Carbon nanostructures
In this section, a brief description of graphene and graphene based materials, including GO and reduced graphene oxide (rGO) will be presented.
2.2.1 Graphene
Graphene is one of the most breathtaking materials, being investigated due to its properties and potential applications [23]. It’s a single layer of carbon atoms arranged in hexagonal lattice and it is a two-dimensional crystalline material which is stable at room temperature [9]. The 2D structure of carbon atoms arranged in an hexagonal lattice allows unique physical and chemical properties. Some of them are presented in Table 2.1. These properties have been exploited for sensor development, field effect transistors or even transparent conductive films [24; 25].
Table 2.1: Graphene properties [9; 23; 25; 26] Specific surface area 2630 m2 g-1
Electron mobility 250 000 cm2 V-1 s-1 Thermal conductivity 5 000 W m-1 K-1
Young modulus 1 T P a
Optical transmittance 97.7 %
Andre Geim and Konstantin Novoselov [23] emphasized the importance of graphene to nanotechnology and other areas of scientific research, and they were awarded with the 2010 Physics Nobel Prize. Graphene is the basic structure of other known carbon nanostructures such as, carbon nanotubes, buckyballs or graphite (Figure 2.9). The graphene hexagonal lattice is also presented in the same figure, each atom has a π-orbital that contributes to a delocalized network of electrons [25].
Figure 2.9: Different carbon structures: buckyballs, nanotubes, graphite (left to right) [23]
Nowadays, the graphene production is divided as bottom-up and top-down. The first tries to build graphene sheets from scratch starting with other carbon molecules. There are several primary ways (bottom-up) to produce graphene. The epitaxial graphene involves chemical vapor deposition growth on epitaxially matched metal surface. In the 1970’s several papers were published where the growth of graphene in nickel crystals were reported. Years later, the evaporation of silica in silicon carbide wafer surfaces at high temperatures was used to produce wafer-size graphene. Large area graphene was produced in copper films as carbon is exposed to metal foils to achieve surface deposition. This technique is only practical if graphene can be transferred from the metal substrates to other substrates obtain very thin platelets of graphite. This process can achieve high quality graphene although the graphene particles have dimensions in the order of micrometers. There are other methods that have
been reported such as substrate-free gas-phase synthesis of graphene platelets in a microwave plasma reactor, and arc-discharge synthesis of multi-layered graphene [25]. Regarding the top-down approach, this consist in the chemical or physical exfoliation of graphite [9].
2.2.2 Graphene oxide
As a robust but flexible surface, graphene provides several possibilities for the modification or funcionalization of the carbon molecules [25]. GO retains some of graphene’s properties even though being easier to process, produce in large quantities and cheaper than graphene. Initially, GO was considered a intermediate product in the graphene synthesis process, how-ever show-everal studies verified that GO has some unique properties. Another advantage is the presence of oxygen functional groups that allows to grow chemical structures in its surface. The presence of the oxygen functional groups allows an easy functionalization with organic or biological structures [27]. The introduction of oxygen in the graphite structure increases the distance between the carbon plans in the graphite structure and weakens the Van der Walls interactions between them [28]. The presence of oxygen on both sides of GO surface is responsible for hydrophilicity, on the other hand graphene is hydrophobic. These functional groups increases the GO thickness comparing with non-functional graphene [9].
The first time that GO was presented to the scientific community was in 1859 when B. C. Brodie explored the reactivity of graphite adding potassium chlorate (KClO3) to a graphite sludge in fuming nitric acid (HNO3) [29]. Some years later, L. Staudenmaier im-proved Brodie’s method by adding chlorate, that resulted in an extent of the oxidation level reached by Brodie [30]. Sixty years after, Hummers and Offeman used potassium perman-ganate (KMnO4) and sulfuric acid (H2SO4) to react with graphite [31]. These three methods sum up the first methods to forming GO, at that time known as graphite oxide. The results of the previous reactions show large variance depending on the substances used, the graphite origin or the reaction conditions [8]. The most common source of graphite is flake graphite, which is a natural mineral that is purified to remove contamination [32]. The complexity and the defects, originated by its natural source, of the flake graphite make the oxidation mechanisms very challenging [8].
Nowadays, one of the most used GO preparation methods is the chemical exfoliation of wet graphite, which is a simple, efficient and low cost proceeding with the advantage that can be produced in large scale [33].
2.2.3 Reduced graphene oxide
rGO consists in GO with less oxygen functional groups. The reduction of GO can be achieved via chemical, thermal or electrochemical processes. The chemical reduction is effi-cient and not very expensive, however the toxicity of the reducing agent is concerning due to the rGO final applications. As the name indicates, in the thermal reduction, the GO is heated in different atmospheres. The oxygen functional groups are removed in the form of water, carbon monoxide or carbon dioxide. This method can achieve rGO with high conductivity. Comparing thermal and chemical with the electrochemical method, this one is eco-friendly and the reduced material is contaminant-free. This reduced material has higher electrical conductivity and electrochemical stability. The hydrophilicity of rGO decreases comparing
with the GO hydrophilicity. The choice of the production process is made according to the final application of the rGO [34] .
2.3
Fiber optic sensors with graphene related coatings
As seen in the previous sections, the optical fiber sensors and GO have outstanding prop-erties and the combination of both can be a technological breakthrough. In the literature it was possible to find some interesting studies exploring these two research topics as sensor. In this section, some of these studies are described briefly.
Starting with a graphene coated tapered optical fiber Qiu, H. W. et al. [35] developed a sensor for glucose detection. Graphene films were grown on a copper foil using a hot-wall chemical vapor deposition system. As the glucose concentration increases, the refractive index (RI) of the solution increases, leading to larger penetration depth and more energy consumption in the evanescent field. Consequently, the output power decreases with the increase of the solution concentration. A linear relationship was obtained in the range of 1-40% with the presented sensor.
Regarding optical fiber sensors with rGO coatings, in order to monitor the temperature, Zhang, Jun et al. coated the surface of a side-polished fiber (SPF) using rGO [36]. With the increase of temperature, the dynamic conductivity of rGO is reduced, which decreases the light absorption and consequentially the transmitted optical power increases. The presented sensor has a sensitivity of 0.134 dB oC-1, with a high linear correlation coefficient (99.4%) and a good response speed (0.0228oC s-1).
Aziz, A. et al. [37] proposed a ethanol sensor, based on a tapered multimode fiber coated with rGO via drop-casting technique. Silver nanoparticles were incorporated in the rGO which revealed to have higher sensibility, faster response and good stability comparing with the undoped rGO. The sensor’s working range is from 1% to 100 %, however there are two different linear correlations which have different sensibilities.
According to the European Commission Air Quality Standards, the maximum concentra-tion permitted of NO2 in the atmosphere is 30 ppb and its major production is due to fuel consumption which can cause acid rain or degradation of the ozone layer. Using a rGO coated etched FBG it is possible to detect NO2 [38]. The gas sensing principle was based on the analysis of the shift of the Bragg wavelength which occurs due to changes in the RI caused by the absorption of NO2 by the rGO layer deposited in the optical fiber surface. A lower detection limit of 0.5 ppm and a sensitivity of 0.8 ppm/min were obtained with the present sensor. Regarding the same gas sensing principle ,Sansone, L. et al. [39] exposed a bilayered Ag/rGO coated single mode fiber optic tip to species in the vapor phase, such as H2O and NH3. The sensing principle is based on the change in the optical signal, resulting of the variation of the RI of rGO upon the interaction with the gas molecules.
Humidity is a severe problem present in constructions or electronics, being its control quite relevant. Regarding this problem, Xiao, Yi et al. [40] proposed a SPF coated with rGO to monitor RH. This sensor has a working range 70-95 % and a sensitivity of 0.31 dB/% RH.
The increase in transmitted power is due to a change in the dielectric properties of GO. The sensor proposed in this work has a linear response from 60 to 100 %. Recently, Gao, Ran et al [41] also proposed an RH sensor based on anti-resonant reflecting guidance in a rGO coated hollow core fiber where a Fabry-Perot resonator is created in the cladding region. The refractive index of rGO changes with the water molecules, which can be used to monitor the humidity. With the proposed sensor, a sensitivity of 0.22 dB/%RH was achieved.
Regarding optical fiber sensors with GO coatings, Shabaneh, A.A. et al. [42] developed a tapered multimode optical fiber sensor with GO coating, deposited via dip-coating technique, to measure the ethanol concentration in aqueous medium. Comparing the developed sensor with one without coating, it was possible to verify that the GO coated sensor has higher sensibility, however it depends of the solution concentration and the sensor response time. The reflectance response on the tip coated tapered fiber changes proportionally with different ethanol concentrations. Following the work of Shabaneh, A.A. et al., Girei, S. et al. [43] studied the absorbance response of a tapered optical fiber with GO coating, deposited using the drop-casting technique. The absorbance response increases with the ethanol concentration due to GO’s high surface area which increases the number of interactions between ethanol molecules and the sensing area.
Sridevi, S et al. [44] demonstrated that etched FBGs coated with GO are highly sensitive and accurate biochemical sensors. For that, they etched the Bragg gratings with HF and treated with NaOH to create -OH groups on the etched portion of the optical fiber. Then, the functional groups such as -COOH, -OH or -O- present in the GO led to the hydrogen bonding between the etched FBG and the GO attached with functionalized polymers. The developed sensor showed high sensitivity to detect some proteins. such as Concanavalin A (Con A), detected through the Bragg wavelength shift.
Table 2.2 presents a resume of some fiber optic sensors with graphene related coatings, reported in the literature.
Table 2.2: Optical fiber sensors with graphene related coatings
Reference Coating Parameter Sensor type / Sensor readout Working range Resolution / sensibility [35] Graphene glucose light intensity 1 - 40 %
[36] rGO temperature side polished - power variation 0 - 80oC 0.134 dB/oC
[38] rGO NO2 eFBG / wavelength changes 0.5 - 3 ppm 0.8 ppm/min
[40] rGO humidity side polished fiber / power variation 70 - 95 % 0.31 dB/% RH [41] rGO humidity power leakage 60 - 90 % 0.22 dB/ % RH [45] PMMA/rGO NH3 resonance wavelength 10-100 ppm
[37] Ag/rGO ethanol absorbance response 1- 100 % [39] bilayered Ag/rGO H2O or NH3 coated tip / reflection mode
[46] GO/Au NPs sucrose 8.7 × 10⁻⁵RIU
[47] GO humidity transmitted power 60 - 100 % 0.553 dB/% RH [42] GO ethanol tapered optical fiber / reflectance response 5 - 80 % Table 2 of the article [43] GO ethanol tapered optical fiber / absorbance response 5 - 40 % 1.330 vol-1% ethanol
[44] GO Con A eFBG / frequency sensor 0 - 500 pM
Chapter 3
Graphene oxide coatings
3.1
Preparation of the graphene oxide solution
The GO solution was prepared from a commercial solution, supplied by Graphenea, with 4 mg·mL-1 and an average sheet size of 900 nm. Considering the cylindrical structure of the optical fiber, and aiming to obtain a better and smoother coating, the GO solution was exposed to an ultrasonic probe to reduce its average sheet size. During this process three samples were collected for each considered time to study the influence of the ultrasonic probe in the sheet size. Using the Zetasizer Nano ZS90 analyser the size of the new GO sheets were estimated. This analysis is a method developed to measure spherical particles in suspension. The conformation of GO in aqueous solution depends on the pH and the ionic strength which results in a GO structure variation. It is considered that GO is organized in two different domains and that promotes the bending of GO in aqueous solution. This conclusion suggests that the presented Zetasizer measurements are valid considering that GO shape is an approximation of spherical particles [33]. Additionaly, since this technique was used to compare the size of the particles with the sonication time, the interest is to detect the size evolution, independenty of the shape. Figures 3.1 presents the results of the referred analysis. Figure 3.2 presents the average size of the GO sheets for each hour of the referred proceed-ing. The average size before applying the ultrasonic treatment is 898 nm. One hour after, the size is 316 nm therefore a 65% reduction. Two hours after the average size is about 72 nm which correspond to a reduction of 92%. The following reduction is of 94% and the GO sheet final size is 52 nm. This was the solution used to coat the optical fibers during this work. There is no signifficant difference in the average sheet size when the solution is submitted to two or three hours of ultrasonic treatment.
(a) (b)
(c) (d)
Figure 3.1: Results of the Zetasizer analysis a) before ultrasonic treatment, b) 1 hour, c) 2 hours and d) 3 hours of ultrasonic treatment
Figure 3.2: Average size of the GO sheet as function of the ultrasonic treatment time
3.2
Optical fiber coating with graphene oxide
The optical fiber surface was coated with GO through the layer by layer method, which is a simple method regarding the cylindrical structure of the optical fiber. Additionally it already showed good results in a previous work developed by Alberto, N et al. [48]. This method is based on the electrostactic interactions between the different species. It was needed to prepare several solutions, namely: HCl (1 mol·dm-3), NaOH (1 mol·dm-3), PSS (Poly(sodium styrene
sulfonate)) (1 mg·mL-1), PDDA (Poly(diallyldimethylammonium chloride))(1 mg·mL-1) and GO (2 mg·ml-1). Table 3.1 presents the different stages used to coat the optical fiber with GO. In the same table it was included the function of each solution and the immersion time required.
Table 3.1: Stages of the coating proceeding
Stage Solution Duration (min) Objective
1 HCl 20 Clean the optical fiber
2 H2O 3 Removal of impurities
3 NaOH 30 Production of a surface with negative charge 4 PDDA 10 Deposition of the positive charged layer 5 PSS 10 Deposition of the negative charged layer 6 PDDA 10 Deposition of the positive charged layer
7 GO 10 Deposition of the GO layer
In order to evaluate which proceeding leads to a coating with better characteristics, there were tested two different procedures. They differ in the use of a additional layer of the negative polyelectrolyte, PSS. Therefore, proceeding A only uses PDDA and GO (stages 6 and 7, Table 3.1) and one layer of proceeding B is constituted by PDDA, PSS, PDDA and GO (stages 4 to 7, Table 3.1).
The number of layers used to coat the optical fiber was another considered parameter. In this work, were tested 1, 3 and 5 layers. For proceeding A, stages 6 and 7 (Table 3.1) were repeated 1, 3 and 5 times respectively. For proceeding B, the stages 4 to 7 were repeated in that order for 1, 3 and 5 times.
In the case of the 5 layers, three replicates were prepared through each proceeding, aiming to test the reproducibility. Table 3.2 presents the identification of the produced samples.
Table 3.2: Identification of the optical fibers samples coated with GO
```` ```` ```` `` Proceeding No of layers 1 3 5
A F1A F3A F5A-1, F5A-2, F5A-3
B F1B F3B F5B-1, F5B-2, F5B-3
Figure 3.3 presents the experimental setup used to coat through the proceeding A. All the solutions prepared were placed in teflon supports due to its non-reactive character, as known the layer by layer method presented uses acid and basic solutions which in contact with different materials can react and contaminate the used solutions [48].
Figure 3.3: Schematic representation of the experimental setup used to coat the optical fibers
3.3
Graphene oxide coatings characterization
After the fiber samples were prepared, the next stage was to characterize the GO coatings using SEM, Raman spectroscopy and AFM.
3.3.1 Scanning electron microscopy
Instead of using light as the conventional microscope, the scanning electron microscope uses an electron beam. This beam is generated internally by a heated tungsten filament. The interaction of the electron beam with the sample produces several forms of radiation to produce a SEM image [49].
The images of the fiber surface coated with GO were acquired with the VEGA 3 SBH TESCAN, using in this case a 20 kV voltage and a 20 k amplification or with the S-4100 Hitachi with a 25 kV voltage and a 10 k amplification. In a first stage the samples were attached to the microscope support with carbon glue. These samples were tested but it was verified that the collected images weren’t suitable for analysis due to the charge effect produced by the non conducting properties of GO and FO, therefore a SEM image of an optical fiber could not be retrieved. Another setback was the cylindrical geometry of the samples. To solve the referred problems, to attach the samples to the microscope suppport a silver epoxy-adhesive (TRA-DUCT 2902) was applied.
Figure 3.4 presents SEM images of the optical fibers coated with different proceedings and distinct number of layers.
(a) (b) (c)
(d) (e) (f)
Figure 3.4: SEM images of some GO coated optical fibers: a) F1A, b) F3A, c) F5A-1, d) F1B, e) F3B and f) F5B-1
The wrinkles present in the SEM images suggests the presence of GO in the fiber surface. For both proceedings, as the number of GO layers increase the wrinkles present in the surface increase in number and size. However, Figure 3.4e) which represents a optical fiber sample with three layers placed through proceeding B is the one that presents more wrinkles and overlays.
Figure 3.5 presents the results of the reproducibility test of the coating process. Figures 3.5a), b) and c) are GO coatings produced through proceeding A. It is possible to acknowledge that sample F5A-1 has more wrinkles and overlays than the other two. Figures 3.5d), e) and f) are SEM images of optical fibers coated using proceeding B. The reproducibility achieved is acceptable knowing that the coating process relies on electronic reactions in solutions. However it is possible to conclude that the fibers coated through proceeding A have less wrinkles and overlays resulting in a smoother coating than the ones coated with proceeding B.
(a) (b) (c)
(d) (e) (f)
Figure 3.5: SEM images of the GO coated fibers with five layers through the different pro-ceedings: a) F5A-1, b) F5A-2, c) F5A-3, d) F5B-1, e) F5B-2 and f) F5B-3
3.3.2 Raman spectroscopy
Raman spectroscopy is an non-destructive optical technique [50] used to collect a unique fingerprint of molecules. Each molecule has a different set of vibration energy levels and a unique wavelength shift. Different peaks in the spectrum correspond to different Raman excitations.
To confirm that the wrinkles present in the SEM images are GO sheets, the coated fibers were characterized by Raman spectroscopy. The spectrometer used was the (Horiba)-HR800 UV that uses a laser with 442 nm and the analyzed wavelength range is from 1100 to 1800 and 2500 to 3100 cm-1.
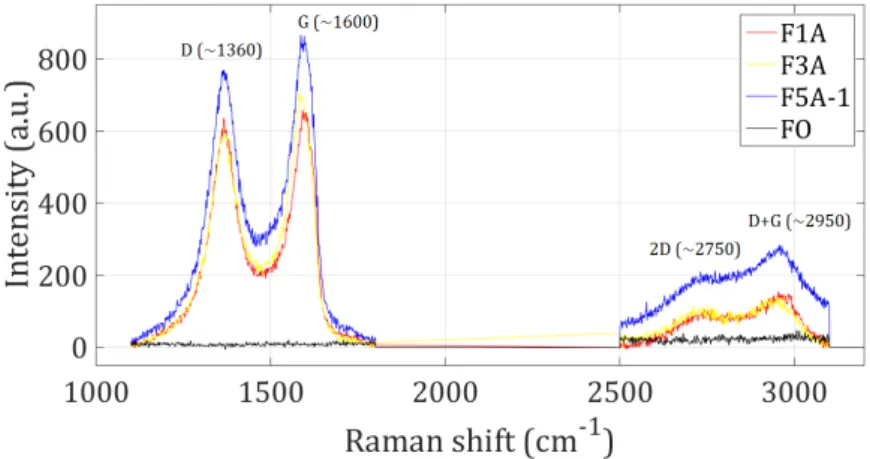
In the typical GO Raman spectrum there are two stong active peaks located approximately at 1350 and 1600 cm-1[51]. The first, at 1350 cm-1, is called D band which is activated when there are defects in the sp2-hybridized carbon networks [52] and its intensity is proportional to the defects concentration [53]. The second, at 1600 cm-1, is called the G band or D’. In addition to these two peaks there are two weak Raman bands (>2500 cm-1) which are the 2D and D+G bands. The 2D is a second-order band of the D band. The intensity of these second-order bands is inversely proportional to the concentration of defects [54].
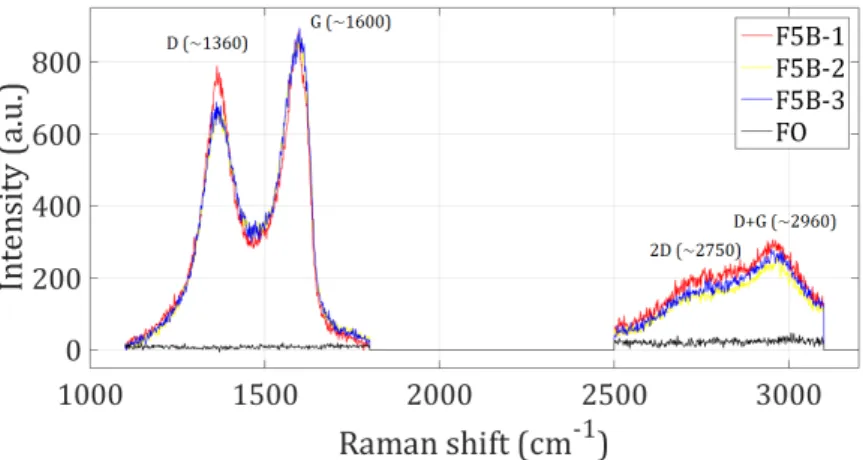
In Figures 3.6 and 3.7 it is possible to compare the influence of the number of GO layers for the two deposition proceedings. For the procedure A, the D and G bands are more intense for the case with five GO layers, comparing with one and three layers. Nevertheless, for the case of procedure B no significant variations are observed. In the case of the 2D and D+G bands, the coatings with one and three layers present the same intensity, however for five layers it is observed that these bands are more intense. The behavior was obtained for both proceedings. As expected, there is no band for the case of the uncoated fiber, in the measurement range analyzed.
Figure 3.6: Raman spectra of GO coatings produced with proceeding A, for samples with 1, 3 and 5 layers
Figure 3.7: Raman spectra of GO coatings produced with proceeding B, for samples with 1, 3 and 5 layers
Figure 3.8 shows the Raman spectra of three samples coated with five GO layers through proceeding A. The Raman spectra reveals the referred bands D, G, 2D and D+G present in a typical GO spectrum. The three samples have small differences between them, so the reproducibility of the coating process is assured. The same analysis was accomplished for the fiber samples coated with proceeding B, and the results are presented in Figure 3.9. There
is no significant difference between the spectra, therefore the reproducibility of the coating process is guaranteed.
Figure 3.8: Raman spectra of GO coatings produced with proceeding A, for three samples with 5 layers
Figure 3.9: Raman spectra of GO coatings produced with proceeding B, for three samples with 5 layers
Comparing Figures 3.8 and 3.9, it is possible to verify that there are no meaningful dif-ferences in the results obtained for both proceedings used to coat the fiber samples. This similarity between the processes was expected due to the fact that the number of layers used is the same for both proceedings and the Raman spectroscopy only reflects the GO present in the sample. From the Raman analysis is possible to conclude that both proceedings are suitable for optical fiber coating even though is not possible to conclude anything about its adhesion to the optical fiber. As expected, there was no observable peak in the Raman spectrum for the case of the uncoated fiber.
3.3.3 Atomic force microscopy
The AFM analysis provides a 3D profile of the surface on a nanoscale [55]. The probe is supported on a flexible cantilever. The AFM tip touches the surface and records the small force between probe and the surface.
It was used the MultiModeTM SPM from Digital Instruments to analize these samples. Figures 3.10 shows the results of the AFM analysis of an uncoated FO 3.10a) and two other fibers coated with proceeding A (F5A-1, Figure 3.10b)) and proceeding B (F5B-1, Figure 3.10c)). In Figure 3.10a) there are several wrinkles that could be attributed to the polymeric coating of the optical fiber which probably was improperly removed before the analysis. The wrinkles present in Figures 3.10b) and 3.10c) suggest the presence of GO in the fiber surface already verified in the case of the SEM.
(a) (b) (c)
Figure 3.10: AFM results: a) FO, b) F5A-1 and c) F5B-1
3.3.4 Leaching test
In order to evaluate the inalterability of the GO coating characteristics, when it is im-mersed in a solution, leaching tests were carried out. These consisted in dipping the samples previously coated through both proceedings (A and B) with 1, 3 and 5 layers in aqueous environments.
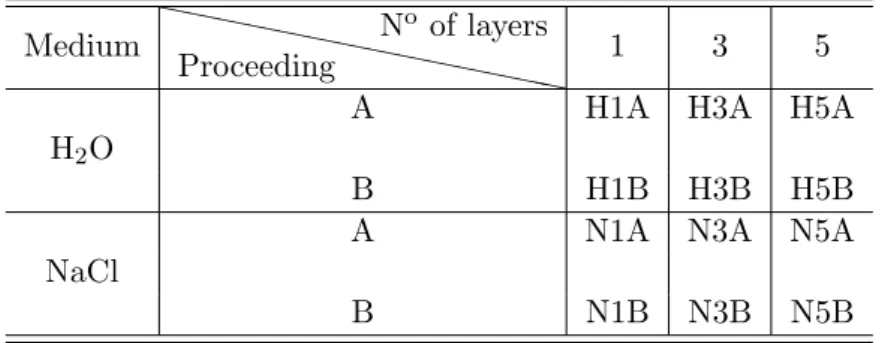
As one of the objectives of this work was to test the interaction of GO with iron in order to develop a corrosion sensor, the samples were immersed in water and sodium chloride (NaCl) aiming to simulate the real environment that the sensor is exposed if it is used as a corrosion sensor.
According to the literature, 0.1 mol·dm-3 is the concentration of the ferric ions that deter-mines the beginning of the corrosion process [56]. In this work, it was intended to prepare a NaCl solution with the same ionic strength (I) that one solution of iron (III) nitrate with 0.1 mol·dm-3, knowing that the ionic strength is given by the following equation:
I = 1 2 n X i=1 cizi2 (3.1) 21
where the ci and zi are the ion molar concentration and the charge number respectively. As known, the iron(III) ion charge is +3 and the nitrate charge is -1, however the concen-tration of the nitrate ion is three times larger, therefore the ionic strength of an iron nitrate solution with 0.1 mol·dm-3is I=0.6. The ionic strength of the sodium chloride has to be equal to the ionic strength of the referred iron(III) nitrate solution. As the charge is +1 and -1, for the sodium and the chloride ions respectively, the concentration of these ions is equal in the solution so the concentration needed to simulate the iron(III) nitrate ionic strength is 0.6 mol·dm-3.
The coated samples were immersed for 5 days in water or sodium chloride, with a small agitation (Figure 3.11). After this period the samples were removed from the liquid media and left out to dry for 24 hours and then prepared for the SEM analysis and the Raman spectroscopy. In the Table 3.3 are identified the samples prepared for this test.
Figure 3.11: Leaching test experimental setup
Table 3.3: Identification of the optical fibers samples coated with GO prepared for the leaching test Medium ```` ```` ```` `` Proceeding No of layers 1 3 5
A H1A H3A H5A
H2O
B H1B H3B H5B
A N1A N3A N5A
NaCl
B N1B N3B N5B
Figure 3.12 presents the SEM images of some optical fiber samples coated through proceed-ing A and exposed to the leachproceed-ing test for five days. For comparison purposes, SEM images of GO coated optical fiber without being subjected to this test are also showed. It is possible to observe that the GO coated remained attached to the optical fiber surface even though it suffered some alterations. Comparing Figures 3.12a), d) and g) it is possible to observe that the leaching test reduced the size of the wrinkles making the surface smoother. There are no significant alterations in the coating with five layers immersed in sodium chloride for five days.
Figure 3.12: SEM images of the GO coated optical fibers prepared using proceeding A. Before the leaching test: a) F1A, b) F3A, and c) F5A
After the leaching test: d) H1A, e) N1A and f) N5A
The same analysis was done for the fiber samples coated by the proceeding B and the results are presented in Figure 3.13. There is no significant degradation of the GO coating after the leaching test.
Figure 3.13: SEM images of the GO coated optical fibers prepared using proceeding A. Before the leaching test: a) F1B, b) F3B, and c) F5B
After the leaching test: d) H1B, e) N3B, f) N3B and g) N5B
Figure 3.14 presents the Raman spectra of the coated optical fibers through proceeding A after the leaching test. The Raman spectra of the samples that were not immersed are also presented in this figure for comparison. The Raman spectra presents the typical bands present in a GO spectrum. The sample with one layer of GO and immersed in water for five days presents stronger peaks than the other samples. The other sample with more intense peaks is the one with 5 layers and not immersed in any aqueous solution. The other samples
reveal similar results therefore it is possible to confirm that the coating has a good adhesion strength to the optical fiber using this deposition process.
Figure 3.14: Raman spectra of the samples produced through proceeding A before and after the leaching test
Figure 3.15 presents the Raman spectra of the optical fiber samples coated with GO by proceeding B. that were not immersed and the ones that were subjected to the leaching test for five days. These spectra reveal the typical GO bands. The Raman spectrum of the sample H3B contains a stronger G band and the H5B spectrum shows the weakest D and G bands. However, there are no significant differences between the spectrum of a sample that was subjected to the leaching test and one that was not.
Figure 3.15: Raman spectra of the samples produced through proceeding B before and after the leaching test
3.3.5 Conclusions
In conclusion, the techniques applied to characterize both coating procedures showed small differences between them.
The Raman spectroscopy clearly indicate the presence of GO on the fibers surface, by the presence of the GO characteristic bands. The SEM and the AFM analysis allowed to conclude that proceeding A yields a surface with less wrinkles and overlays. As the number of GO layers deposited in the optical fiber sample increase, in most of the cases, the wrinkles and overlays also increases.
After the leaching test it is possible to conclude that this deposition method has a good adhesion of the GO to the fiber surface.
Chapter 4
Sensor development
4.1
Preparation of the GO coated Bragg grating based sensors
As already mentioned, in this work, two different sensors configurations based on FBG and TFBG were prepared. The gratings were inscribed using the experimental setup implemented in the Instituto de Telecomunica¸c˜oes. Figure 4.1 presents a schematic representation of the referred system.
As a light source it contains an UV laser (KrF), BraggStar Industrial from Coherent, which emits a beam at 248 nm. The laser beam is reflected by a set of mirrors and then passes through a slit that controls the beam width. After that, the light passes through an cylindrical lens that focus the beam. The beam diffracts in the phase mask to inscribe the Bragg gratings. The whole system is mounted on an optical table to reduce mechanical perturbations.
Figure 4.1: Implemented experimental setup used for the Bragg gratings inscription
The FBGs were inscribed into standard optical fiber (sm28e, Corning), with 10 mm -length. For that, the moving cart presented in Figure 4.1 was deslocated at 0.100 mm/s, being the slit aperture of 2 mm. The TFBGs were inscribed into photosensitive optical fiber (FiberCore PS 1250/1500) with 15 mm - length and a tilt of 8o. In this case, the slit aperture was also 2 mm and the velocity of the moving cart of 0.125 mm/s. In the case of the TFBGs, prior to the recording process, the fiber was hydrogenated during 15 days, at 150 bar and
room temperature. This method consists in diffuse hydrogen molecules in the fiber core [57], which improves the photosensitivity. After the writing process, the TFBGs were subjected to annealing at 80oC, for 24 hours to remove the residual hydrogen.
Figure 4.2 presents the FBG and TFBG based sensor used in this work. In the case of the FBG (Figure 4.2a)), the fiber was cleaved 30 mm from the grating center and the GO coating was deposited onto its tip. This sensor configuration is similar to the one used by Yang, J. et al. [16]. The configuration of the TFBG based sensor is presented in Figure 4.2b). In this case, all the grating was GO-coated.
(a) (b)
Figure 4.2: a) FBG and b) TFBG based sensor configuration
Several FBGs and TFBGs based sensors were prepared and characterized prior to the coating process in order to obtain a reference. After that, the GO coating was deposited and new characterization tests were carried out. To characterize the sensors, two types of solutions were prepared. The first was a set of saccharose aqueous solutions with different concentrations and consequentially distinct refractive indices. The other one was several iron(III) solutions in order to test the affinity of the iron to attach to GO. The concentrations of the iron(III) nitrate were selected in order to encompass the reference value that defines the beginning of the corrosion process, namely 0.1 mol·dm-3 [56]. Two iron solutions with lower concentrations were tested to study the sensibility to detect the corrosion phenomenon in a early stage.
The refractive indices of the referred solutions were measured with a refractometer (Anton Paar Abbermat 200) with 0.0001 RIU (Refractive index units) of resolution, at 23o C. Figure 4.3 presents the dependence of the refractive index as function of the concentration of the saccharose and iron solutions. Table 4.1 presents the identification of the tested sensors, with the information of the sensor configuration (FBG or TFBG), procedure used to deposit the GO (proceeding A or B), number of GO layers (1, 3 or 5) and the type of solution used ti characterize the sensor (saccharose or iron(III) nitrate).
(a) (b)
Figure 4.3: Variation of the refractive index as function of the solution concentration a) saccharose and b) Iron(III) nitrate solutions
Table 4.1: Identification of the Bragg grating based sensor characterized using different solu-tions
Saccharose Iron(III) nitrate Proc A Proc B Proc A Proc B
FBG1A FBG1A
FBG3A FBG3A
FBG5A FBG5B FBG5A FBG5B
TFBG3B TFBG3B
TFBG5A TFBG5B TFBG5B
Since the refractive index of the solutions changes with the temperature, to guarantee the minimum variation, all the experiments were accomplished inside a thermal chamber (Ange-lantoni CH340). To monitor the reflection spectrum of the FBG based sensor, a interrogator system (sm 125-500 Micron Optics) with a resolution of 1 pm, a acquisition rate of 2 Hz and a wavelength range from 1510 to 1590 nm was used. However, in the data processing, the wavelength range considered was from 1549 to 1553 nm. The transmission spectrum of the TFBG based sensor was monitored using an optical network analyzer (ONA) (Agilent Technologies) using a resolution of 0.0043 nm and a working range from 1500 to 1567 nm.
After the measurement equipment and the thermal chamber are turned on and the temper-ature is stable, the first spectrum is extracted. Then, the actual solution is removed from the support and a new solution with higher concentration is tested. After a stabilization period of 30 minutes a new spectrum is recorded. This proceeding is repeated until the highest concentration solution is tested. After the cycle is complete, the fiber is properly cleaned using distilled water. Figure 4.4 shows the experimental setup implemented to characterize the response of the FBG and the TFBG based sensor using both saccharose and iron(III) nitrate solutions.
(a) (b)
(c) (d)
Figure 4.4: Experimental setup and respective schematic representation used to characterize the response of the a), b) FBG and c), d) TFBG based sensors to refractive index variations
In the following sections the results of the referred trials will be presented and discussed. The points present in the graphics represent the experimental data and the line represents the best adjust to the data.
4.2
Sensor characterization to refractive index variations
4.2.1 FBG based sensor
Figure 4.5 shows the reflection spectra of the FBG5A sensor before and after the deposition of the GO coating, for solutions with different RI. In the following figure (Figure 4.6) it is presented the evolution of the Bragg wavelength and the FBG peak intensity with the different refractive indices.
(a) (b)
Figure 4.5: Reflection spectra of the FBG5A sensor a) without and b) with GO coating for solutions with different RI
(a) (b)
Figure 4.6: a) Bragg wavelength and b) Peak intensity variation with different refractive indices for the uncoated and coated FBG5A sensor
From the analysis of the Figure 4.5, it is possible to recognize a clear change of the FBG reflection spectrum when the grating is immersed in solutions with different RI. The most evident variation is related to the Fresnel reflection intensity (baseline in the spectrum) which reduces gradually with the increase of the RI. This behavior was verified for uncoated and GO coated fiber tip.
As expected, the wavelength of the FBG peak remains practically intact (Figure 4.6a)) since the experiments were carried out inside a thermal chamber at constant temperature. Any variation of the Bragg wavelength would indicate a temperature change. The variation of the FBG peak intensity is negligible, as already verified in [14; 15].
To minimize the impact of the power fluctuation of the light source on the measurement, the IntRFBG was calculated. The results of this analysis is presented in Figure 4.7. For the range of RI considered, a sensitivity of 131.37 dB/RIU (R2=0.974) was obtained in the case of the uncoated sensor. After the coating process, this value decreased slightly to 87.62 dB/RIU (R2=0.988).
Figure 4.7: IntRFBG for the uncoated and GO coated FBG5A sensor as function of the RI Then, the results of the influence of the coating process and the number of layers in each
sensor will be analyzed. For all cases before that, the response of all sensors without and with GO is presented.
Influence of the proceeding used to deposit the GO layers
Figure 4.8 shows the IntRFBGFBG5B sensor, as function of RI. For the case of the FBG5B sensor, a slight decrease of the sensibility was also obtained after the coating. This behavior may be considered to the high number of the deposited layers.
Figure 4.8: IntRFBG the FBG5B sensor, without and with the GO coating
After comparing the uncoated and the GO coated sensors, there is a need to compare the coating processes. Figure 4.9 presents the referred comparison. It is possible to recognize that both sensors have similar reactions to the the change of the RI, that is confirmed by the sensitivity of the sensors. The GO coated FBG5A sensor has a sensitivity of 87.62 dB/RIU and the FBG5B sensor, 81.89 dB/RIU. From these results, it is possible to conclude that the process A leads to a slight improvement of the sensitivity value, for the specific case of 5 GO layers.
Figure 4.9: IntRFBG for the coated FBG5A and the FBG5B sensors
Influence of the number of GO layers
Figure 4.10 shows the response of the FBG1A and FBG3A without and with the GO coating. The GO coated FBG1A sensor has better sensitivity than the uncoated sensor, in a restricted RI range (1.3885 to 1.4236). However, the other GO coated sensor has a decrease in the sensitivity.
(a) (b)
Figure 4.10: IntRFBG for the a) FBG1A and for the b) FBG3A sensors
Figure 4.11 compares the GO coated FBG based sensors. The sensitivity of FBG3A and FBG5A sensors is 54.18 (R2=0.963) and 87.62 dB/RIU (R2=0.988), respectively, this two sensors have a good linear response in the entire RI range analyzed. However, the FBG1A coated sensor has a better sensitivity with a good linear response when the RI is larger than 1.3885. The sensitivity of this sensor is 318.55 dB/RIU (R2=0.9435).
Figure 4.11: IntRFBG for the GO coated FBG1A, FBG3A and FBG5A sensors
![Figure 2.9: Different carbon structures: buckyballs, nanotubes, graphite (left to right) [23]](https://thumb-eu.123doks.com/thumbv2/123dok_br/15791190.1078164/33.892.276.636.492.812/figure-different-carbon-structures-buckyballs-nanotubes-graphite-right.webp)