THE IMPACT OF DESIGN AESTHETICS ON WILLINGNESS TO PAY FOR UTILITARIAN PRODUCTS
MAXIMILIAN ERLL
Work Project carried out under the supervision of: Dr. Sofia Kousi
Abstract
In a world that is coined by fierce competition and a fast-paced life, companies need to think one step ahead of their competitors to succeed in the long-run. One growing driver for success has been the design of products (aesthetics) which can help to differentiate one’s products from others that contain the same core features. For a long time in research the importance of design appeal was only assumed for pleasure-related products (hedonic) and functional products (utilitarian) were often not taken into consideration. This leaves a gap of research focusing on utilitarian products which therefore built the foundation of this study. Using Hayes’ mediation model, insights into the relationship between design appeal and willingness to pay for utilitarian products were provided. This quantitative study revealed the significance of design appeal in utilitarian products that triggers higher willingness to pay. Furthermore, the objective was to get insights into the black box in consumer decision making processes. The literature review demonstrated an importance of status-seeking, self-expression and self-esteem enhancement in terms of buying decisions. These three emotional purchase motivations (mediators) were assumed to be impacting willingness to pay. Against the initial assumption, the study found that the relationship between design appeal and willingness to pay is not mediated by these three emotional purchase motivations.
KEYWORDS: Design appeal, Willingness to pay, Hayes mediation model, Utilitarian products
This work used infrastructure and resources funded by Fundação para a Ciência e a Tecnologia (UID/ECO/00124/2013, UID/ECO/00124/2019 and Social Sciences DataLab, Project 22209), POR Lisboa (LISBOA-01-0145-FEDER-007722 and Social Sciences DataLab, Project 22209) and POR Norte (Social Sciences DataLab, Project 22209).
Table of Contents
Abstract……… 1
1 Introduction……… . 3
2 Literature Review………. 4
2.1 Definitions & Research Importance………... 4
2.2 Research Objective and Hypothesis Formulation………... 9
3 Methodology………. 10
3.1 Research Approach………. 10
3.2 Research Study Design………... 10
4 Results and Analysis……….. 14
4.1 Data Analysis……….. 14
4.2 Findings Pre-Study……….. 15
4.3 Findings Main Study………... 16
4.3.1 Reassessment of the Utilitarian Value……….. 16
4.3.2 Hayes’ Mediation Model……….. 16
5 Discussion……… 23
6 Conclusion and Outlook……….. 23
6.1 Managerial & Research Implications……… 23
6.2 Limitations and Future Outlook……… 24
References………... 26
1 Introduction
In the last three decades the competition among companies has been increasing tremendously. In order to succeed under these circumstances, companies invested a lot in research and development to understand their customers and build new products according to their needs. Besides using cutting-edge technology to improve the functional value of a product, the role of design (product aesthetics) for brand success and loyalty was also questioned and analyzed in many industries. Many findings show that a well-designed product can achieve a sustainable competitive advantage for companies and create long-term brand loyalty among customers (Noble and Kumar, 2010). Moreover, some studies have confirmed that the product design can significantly influence both cognitive and affective product responses which leads to attitudinal brand loyalty as well as behavioral brand loyalty (Chia-Lin Hsu et al., 2017).
After acknowledging the importance of product design (visual appeal of the product) for new product development processes, some researchers focused on the comparison of two different product categories, namely hedonic products and utilitarian products. As studies had pointed out previously, hedonic and utilitarian products were bought to achieve different goals. Therefore, hedonic products fulfill more pleasure-related goals whereas utilitarian products are usually bought to fulfill functional needs (Klein and Melnyk, 2014). These differences led to the broad perception that the role of design was more important for pleasure-related products (hedonic) than it was for products which are mainly bought because of their function (utilitarian). However, some early findings emphasized for both hedonic and utilitarian products the importance of design and therefore implied a potential for higher product performance. These findings pointed out that especially products for human interaction including many touchpoints with the consumer are emerging as marketing success drivers. This is mainly due to a smaller technology gap between companies and the rising importance of other product features (Veryzer et al., 1995). In addition, some investigations in the automotive
industry have proven that atypical product design (design that is not expected by consumers; e.g. high level of design in utilitarian products) can improve the perceived value of products when the consumer is often exposed to the product (Landwehr, Wentzel and Herrmann, 2013). But not only studies in the automotive industry have found evidence for a shift in the customers’ decision-making process. Oftentimes, competitive factors of a product such as price and quality have been either replaced or complemented by product design (for both hedonic and utilitarian products). Many companies such as Apple, Kartell and Alessi have experienced that if a product’s design is not only perceived as atypical but rather seen as innovative and novel, consumer demand increases and the product is often superior to similar ones (Moon, Park and Kim, 2014). Although there is some research pointing towards product design and how it can influence consumer behavior, most research addresses only hedonic products which leaves a gap for utilitarian products. Against this background, the present study aims to explore the relevance of design appeal in utilitarian products and specifically how design appeal impacts willingness to pay.
2 Literature Review
2.1 Definitions & Research Importance
In order to understand the role of design in utilitarian products, the literature review references to papers in the area of Consumer Behavior and Product Development. Apart from defining some relevant key terms, the review is meant to build a foundation for the following research objectives and the hypotheses formulation. In particular, it shall provide insights into the importance of visual product appearance in decision making processes and shall build an understanding of how emotional motivations influence buying decisions.
According to the Salem Press Encyclopedia (2020), “Product Design” is an early process of product development in which new products are constructed before they are introduced to the market (Woodbury, 2020). Other books and journals emphasize that product design has
different components and use cases ranging from visual appearance to design for cost reduction to design for environmental friendliness (Baxter, 1995). In the present master thesis, the study only addresses the visual appearance (aesthetics) of products instead of a complete coverage of all design aspects.
Taking into account the visual appearance of products as well as the subsequent influence on the consumer buying decision, many papers point out differences between two fundamental product types. When consumers look for new products, they either base their final decision on emotional or on rational reasoning. With regards to hedonic products, customers seek to generate emotional arousal which can be triggered by aesthetics, symbolic meaning or multi-sensory experiences (Lim and Ang, 2008). On the contrary, utilitarian products are bought because of their rational appeal and their functionality to complete a task or solve a problem. However, there is usually very few products that are only hedonic or only utilitarian. In most cases the product is partly hedonic and partly utilitarian (Lim and Ang, 2008). To further identify to what extent a product is hedonic or utilitarian, researchers commonly use an item scale developed by Kevin Voss, Eric Spangenberg and Bianca Grohmann (2003). The scale includes several antonyms and helps to indicate how utilitarian or hedonic a product is (Appendix A). The scale visualizes that a product (such as a toolset) can have both utilitarian characteristics and hedonic characteristics at the same time (i.e. “functional” and at the same time “amusing”). Being able to identify the product type is often crucial to determine the specific field of a study and to verify the research suitability of certain products.
Another area of research focuses on understanding how the design appeal of a product influences the willingness to pay among consumers. One example to highlight the importance of visual appearance was a study in the food industry in 2014. In this study researchers found that consumers who like the packaging of groceries actually perceived food as high-quality and assumed the food to taste better. As a result, it was shown that consumers were willing to pay
more for well-designed food products as opposed to a plain design. In particular, these visual cues led to an increase in willingness to pay by 14-121% (Wansink et al., 2014). A similar result was found in another study addressing new service development in new technology-based firms. In this case, the researchers analyzed the importance of service aesthetics for young technology-based companies (e.g. user interface, customer experiences, marketing materials etc.). Aesthetics were found to be crucial for many new service development processes and had a high positive impact on new customer sales as well as on customers’ willingness to pay (Candi, 2010). A third study analyzed the relationship between product aesthetics and price sensitivity. This study didn’t focus on any specific product category but on the general impact of visual appeal on price sensitivity. According to the results, when a product is perceived as well-designed, consumers are less sensitive in terms of pricing and therefore are willing to pay more for products or services (Mumcu and Kimzan, 2015).
The findings of these studies show the importance of design appeal in terms of consumer decision-making which subsequently carries a high potential for companies to elaborate their product development processes. Striking was that most papers in this research field take only hedonic products into account which leaves a lack of data for utilitarian products. One reason for this gap could be that design has a stronger connection to the emotional arousal (hedonism) of a consumer than to the functional appeal (utilitarianism) which could lead researchers to select hedonic products for their investigations (Guerreiro et al., 2015).
In addition, another research gap was found in the field of understanding why design matters. Only a few studies in the luxury goods market started to address the emotional motivation for buying well-designed products. In luxury goods, a strong emotional attachment to the product was found (So et al., 2013). This attachment is often due to the fulfillment of emotional needs such as status-seeking, self-expression or improving one’s self-esteem (Zhou et al., 2002; Noh et al., 2014). To further understand the relevance of these three parameters, it is crucial to gain
insights into definitions and research findings related to seeking status, expressing oneself or looking for self-esteem in the context of consumer behavior.
Status-Seeking. Over the last decades, product consumption in order to seek status was
commonly referred to as status consumption in many studies. According to Paurav Shukla (2008) status consumption is related to consumer behavior that is impacted by the need to enhance one’s status through the purchase of a new product or service. The perceived value of the product is individually measured by how much status the consumer can gain by buying the product or service. Oftentimes, consumers buy expensive products to demonstrate achievement and success rather than buying products only for their technical purpose (Shukla, 2008). Moreover, some consumers buy new products to pretend the belonging to a certain social group and find acceptance in this group as a result. This indicates that as part of gaining social status, consumers are likely to pay more for a product or service. (Hennig-Thurau et al., 2004).
Self-Expression. Early on in 1988, a study revealed that consumers see their belongings as part
of themselves and therefore purchases are often aligned with individual character traits and values (Belk, 1988). In addition, studies showed that certain activities including sports and healthy consumption have helped consumers to express their inner self-concepts to the outside (Hackley and Tiwsakul, 2006). Especially older papers showed that self-expression purchases often served to influence the behavior of others (Engel et al., 1969). Against these early assumptions, in 2013 Christina Saenger and her research colleagues found new intentions for self-expression through product purchases. According to their findings, consumption-focused self-expression is often due to the desire to be heard and simply express who the consumer is. In that sense, these consumers don’t want to enhance brand performances but rather attract attention to themselves (Saenger et al., 2013). Having the ability to express their personality through certain products can help to fulfill consumers’ emotional needs, and thus may lead to a higher willingness-to-pay.
Self-Esteem Enhancement. In the very beginnings of self-esteem research, Rosenberg described
self-esteem as the intention to seek experiences which improve or protect one’s self-concept (Rosenberg, 1979). Later on, some studies collected data about self-esteem in the context of buying new products. Studies found that the result of the aforementioned status-consumption and self-expression consumption is improved self-esteem. Products and services do often function as symbols of social distinction (status-seeking) uniqueness (self-expression) and also as symbols of autonomy. Often, these emotional needs are ultimately related to the maintenance and improvement of self-esteem (Banister and Hogg, 2003). As a result, seeking for status and self-expression through purchases is partly based on the need to enhance self-esteem. In this sense, consumers evaluate subconsciously what confidence-level boost they can gain from certain products and services. These evaluations can vary between consumers, so that some consumers perceive the same product as helpful to achieve self-esteem and others don’t see the value for achieving self-esteem. If consumers value the self-esteem increase as high, they are willing to spend more money on certain products or services (Banister and Hogg, 2003). Taking into account all presented study findings, it was striking that no matter what products and services consumers purchase, the final decision is often related to a craving for fulfilling an emotional need. Looking back to the beginning of the literature review, the visual appearance of a product or service was proven to be a crucial component in decision making processes. Linking these findings to the emotional motivation parameters (status-seeking, self-expression and self-esteem enhancement) indicates a great research opportunity that can help to understand why consumers are delighted by product aesthetics. Moreover, a gap of research focusing on utilitarian products in this field was discovered which shall be closed throughout the present study. The literature review and its findings shall build the foundation for the following research objective and hypotheses formulation.
2.2 Research Objective and Hypothesis Formulation
It was highlighted in the literature review, that there is still a gap between utilitarianism-focused research and hedonism-focused research in the context of the importance of design appeal. As most of the previous studies addressed hedonic products, the overall research objective is to get insights about willingness to pay related to the product design of utilitarian products. Moreover, this thesis shall provide an analysis of the emotional motivation when buying well-designed utilitarian products. The study of the emotional motivation is limited to status-seeking, self-expression and self-esteem enhancement, as these parameters were proven to be relevant in the context of decision-making processes (see chapter 2.1). The main focus of the data analysis section is to support or reject the following hypotheses by using a well-known mediation model by Hayes and Preacher (2008):
Figure 1: Hypotheses Formulation
H1: “Design appeal increases willingness to pay for utilitarian products.”
H2: “Status-Seeking mediates the relationship between design appeal and willingness-to-pay.” H3: “Self-Expression mediates the relationship between design appeal and willingness-to-pay.”
H4: “Self-Esteem enhancement mediates the relationship between design appeal and willingness-to-pay.”
The following chapter will provide an overview of how the study was conducted. In particular, the detailed research approach and research design will be shown to see how data was collected and analyzed. As part of this, the used mediation model by Hayes and Preacher (2008) will be explained. In the end of this study, a discussion section will provide an overview of which hypotheses were proven to be true and which were proven to be false. Based on the findings and the discussion section, managerial and academical implications shall be provided as well as a section on limitations and further outlook of this research field.
3 Methodology
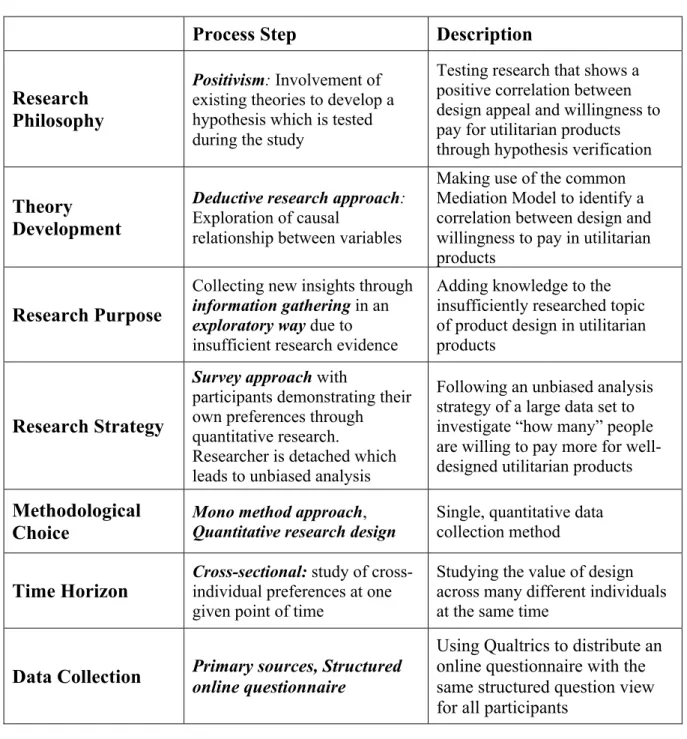
3.1 Research Approach
Figure 2: Research Approach (Saunders, Lewis & Thornhill, 2019)
Process Step Description
Research Philosophy
Positivism: Involvement of
existing theories to develop a hypothesis which is tested during the study
Testing research that shows a positive correlation between design appeal and willingness to pay for utilitarian products through hypothesis verification
Theory Development
Deductive research approach:
Exploration of causal
relationship between variables
Making use of the common Mediation Model to identify a correlation between design and willingness to pay in utilitarian products
Research Purpose
Collecting new insights through
information gathering in an exploratory way due to
insufficient research evidence
Adding knowledge to the insufficiently researched topic of product design in utilitarian products
Research Strategy
Survey approach with
participants demonstrating their own preferences through quantitative research.
Researcher is detached which leads to unbiased analysis
Following an unbiased analysis strategy of a large data set to investigate “how many” people are willing to pay more for well-designed utilitarian products
Methodological Choice
Mono method approach, Quantitative research design
Single, quantitative data collection method
Time Horizon Cross-sectional: study of cross-individual preferences at one given point of time
Studying the value of design across many different individuals at the same time
Data Collection Primary sources, Structured online questionnaire
Using Qualtrics to distribute an online questionnaire with the same structured question view for all participants
3.2 Research Study Design
The research design was split into two parts, namely a pre-study and a main study, to ensure high quality of the findings. Prior to the main study, a pre-study was done in order to get insights about three different product categories and validate their importance for the purpose of the
main study. In addition, the pre-study helped to improve the research approach in the main study by avoiding common mistakes using online-survey software. Both studies were conducted through an online survey using “Qualtrics” as a data collection tool and SPSS (IBM) to analyze data.
Pre-Study. In preparation for the pre-study, three utilitarian product categories had to be
selected as foundation for the pre-study and main study. Based on academical sources, three product categories (printers, toolsets and textbooks) were assumed to be utilitarian and thus a good fit for the purpose of this study (Lu et al., 2016 and Lee et al., 2016). In order to validate their level of utilitarianism, the pre-study took use of the aforementioned utilitarian and hedonic item scale by Voss et al (2003). Even though this scale is already well-established, Cronbach’s alpha was calculated to ensure the scale’s reliability.
The sample set consisted of 30 respondent and was split into 60% male and 40% female (see Appendix F). Using the utilitarian/hedonic item scale, all 30 participants had to evaluate the utilitarian and hedonic nature of each product category (printers, toolsets, textbooks). In particular, several key attributes (see item scale in Appendix A) such as usefulness and cheerfulness were rated on a scale from 1 to 5 for each product. Afterwards, means were calculated and compared to the other means across all three categories.
Main Study. To ensure the validity of the selected product categories, Voss’s item scale was
used again to reassess the utilitarian nature of each product. Afterwards the main study helped to analyze the relationship between design appeal and willingness to pay.
In the first step of the data collection, the aim was to investigate the direct relationship between design and willingness to pay for utilitarian products. To do so, the utilitarian product categories (textbooks, printers, toolsets) were randomly assigned to all participants. Participants saw only one product picture in the beginning of the survey that showed either a textbook, printer or toolset. In addition, the pictures visualized different levels of aesthetics, ranging from good
design to bad design (e.g. first participant might saw a printer with good design and the second might saw a toolset with bad design). The reason for choosing different products with varying degrees of aesthetics was to have great variance in aesthetics so that the findings are not dependent on one specific product category but cover generally the utilitarian product type. With this approach it was possible to measure the differences in product design appeal and the according willingness to pay (see Appendix E for full survey).
The following step helped to find out whether consumers make purchase decisions based on status-seeking, self-expression or self-esteem enhancement. A commonly used questionnaire for status-seeking consumption was built and validated by Eastman, Goldsmith and Flynn in 1999 (see Appendix B). The scale includes 5 questions regarding status-seeking when buying a new product. In terms of self-expression, a modern evaluation scale was developed in 2013 by Saenger, Thomas and Johnson (see Appendix C). The scale consists of 6 questions which help to understand self-expression intentions in consumer buying decisions. With regards to self-esteem enhancement, there is currently much research that shows a strong correlation between low self-esteem and compensatory consumption. However, up until now, there is no popular and validated scale to assess self-esteem enhancement through product acquisition. Therefore, 5 questions were developed which are based on Rosenberg’s self-esteem scale (Rosenberg, 1965), but put in the context of a purchase situation (see Appendix D).
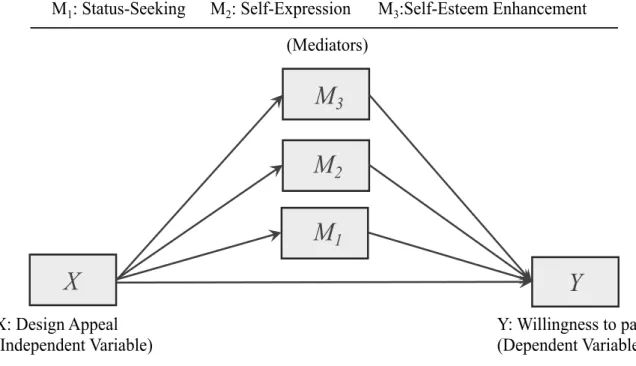
Using these scales can often help to understand more about the black box (the “why”) in decision making processes. And as a result, researchers have the ability to use the responses as input for the commonly used mediation model by Preacher and Hayes (2004). This mediation model can help to determine if a potential mediator (i.e. status seeking, self-esteem enhancement or self-expression) is indirectly part of the relationship between an independent and dependent variable. Figure 3 shows the mediation Model 4 including the topic of the present study (Preacher and Hayes, 2004).
Figure 3: Mediation Model by Preacher and Hayes (2004) applied on current topic
To clarify, this framework helps to understand whether the dependent variable (Y) is caused directly by the independent variable (X) or mediated by the mediator (M). If Y is mediated by M, that implies that X causes M and as a result M causes Y (Preacher and Hayes, 2004). In addition, a covariate (price sensitivity) was used as a control measure.
The data set consisted of 145 participants in total of which 64% were female and 36% were male. With 71%, most respondents were 20-25 years old, followed by 19% at the age of 26-30, 7% at the age of 30-50 and 3% which were older than 50. Looking at the educational degree, 44% were holding a bachelor’s degree and 39% were holding a master’s degree, 14% had successfully finished high school, followed by 1% with a PhD (see Appendix H). A mixed sample group was chosen to ensure a result validity across many consumers with varying backgrounds.
M2: Self-Expression
M
2M
1M
3M1: Status-Seeking M3:Self-Esteem Enhancement
X
Y
X: Design Appeal (Independent Variable) Y: Willingness to pay (Dependent Variable) (Mediators)4 Results and Analysis
4.1 Data Analysis
The main tool for analyzing the data sample was SPSS by IBM. Referring to the chapter of “research study design”, the findings of the pre-study were analyzed prior to the main study to assess how utilitarian the selected product categories are (printers, toolsets, textbooks). After analyzing these results, the main study was conducted accordingly.
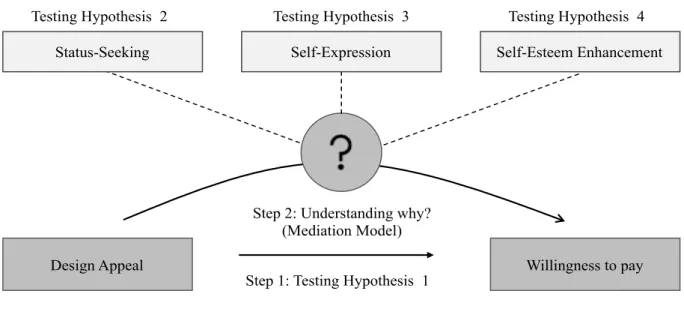
In the first step of the main study a reassessment of the product categories was conducted to back-up the results of the pre-study and qualify the product categories for the purpose of this research. Afterwards, a data analysis framework was developed in order to accept or reject the hypotheses (see chapter 2.2) and validate their significance. The framework serves as a guide through all steps of the mediation analysis (see Figure 4). Using this framework was helpful to determine whether a hypothesis was rejected or supported.
Figure 4: Data Analysis Framework
Following the data analysis framework above, the first step was to highlight if design appeal (independent variable X) is a significant predictor of willingness to pay (dependent variable Y). This was done to validate hypothesis 1. Afterwards, the emotional purchase motivation
Design Appeal Willingness to pay
Self-Expression Self-Esteem Enhancement Status-Seeking
Step 1: Testing Hypothesis 1 Step 2: Understanding why?
(Mediation Model)
(mediators) were tested as one coherent third variable (see Figure 3, “M1-M3”) to see if they simultaneously mediate the relationship between design appeal and willingness to pay. Moreover, the mediation model was run with all three potential mediators individually to see how the relationship between design appeal and willingness to pay is impacted by each mediator alone. These results helped to validate the hypotheses 2-4. To clarify, the mediation model was used to see if a higher level of design indirectly triggers the emotional purchase motivation which then accounts for an increase in willingness to pay.
4.2 Findings Pre-Study
The main purpose of the pre-study was to serve as indicator whether the chosen product categories, namely printers, toolsets and textbooks, are perceived as utilitarian rather than hedonic. This was done to ensure that the selected categories can bring valuable insights for the purpose of the main study. The findings reassured the assumption that printers, toolsets and textbooks are indeed seen as utilitarian products. Moreover, all three categories scored higher on utilitarian attributes than on hedonic ones, which supports the utilitarian perception. For printers, an overall utilitarian score of 3.7 (maximum possible value 5) was found in contrast to a hedonic score of 2.54. This accounts for a difference of 1.16 scoring points. The biggest difference between utilitarian and hedonic values was found in the toolset category, in which respondents clearly stated that toolsets are seen as utilitarian products with a score of 4.76 as opposed to a hedonic a score of 2.94. This amounts to a difference of 1.82 scoring points. The third product category also showed a big difference ranging from 3.68 (utilitarian score) to 2.02 (hedonic score). Therefore, the difference was 1.66 (see Appendix G). To ensure the reliability of these findings, Cronbach’s alpha for this scale was found to be 0.883 (utilitarian items) and 0.749 (hedonic items). Alphas between 0.7 and 0.9 indicate high reliability (see Appendix N).
4.3 Findings Main Study
4.3.1 Reassessment of the Utilitarian Value
As pointed out in the data analysis section, before Hayes’ mediation model was applied, the findings regarding the utilitarian and hedonic value of each category were reassessed to verify the eligibility of each product category. Again, the verification was done using the Voss et al (2003) scale, which helped to indicate how utilitarian or hedonic an individual perceived the product category. Similar to the findings of the pre-study, all 3 product categories were seen as rather utilitarian than hedonic. For the printer category we found an overall utilitarian score of 3.85 (maximum possible value 5) in comparison to a hedonic score of 2.44. That yields a point difference of 1.41. Even more striking was the difference for toolsets, among which I found an overall utilitarian score of 4.16 (maximum possible value 5) whereas the hedonic score was on average 2.55. Thus, I recorded a difference of 1.61. The smallest difference was found for the textbook category. For textbooks I found an average utilitarian score of 3.80 in contrast to a hedonic score of 2.57. In this case the difference amounts to 1.23 (See Appendix I). To back up these findings, Cronbach’s alpha for scale reliability was found to be 0.817 (utilitarian items) and 0.812 (hedonic items). After validating the product eligibility, the analysis proceeded with Hayes’ mediation model to explore emotional purchase motivation.
4.3.2 Hayes’ Mediation Model
Before going into the mediation model, the levels of design (given by the researcher) were compared with design appeal perceived by the participants (see Appendix E – Block 4). A match was found between the given design level and perceived design appeal of respondents across all categories, confirming the presence of various design levels in all product categories (see values in Appendix J). In other words, whenever a person saw a low level of design (i.e. low design level textbook) their appeal perception was lower than the value people assigned to better designed products (i.e. high design level textbook). The answer given in this part of the
survey (design appeal) was used as the independent variable throughout the mediation analysis. For further analysis, this variable was used as a continuous value instead of separating design levels into categories in order to ensure standardization for the entire sample.
Following, Hayes’ mediation model 4 was applied to test the significance of the relationship between design appeal and willingness to pay. In addition, the mediation model was used for analyzing the impact of potential mediators between the independent variable (design appeal) and dependent variable (willingness to pay). To clarify, a mediator is a third variable in a relationship that is usually triggered by the independent variable, and subsequently indirectly impacts the outcome of the dependent variable. Regarding the present study, the mediation model was used to see if a high level of design appeal predicts emotional motivation (e.g. status seeking) and as a result the emotional motivation causes a higher willingness to pay. The analysis was run 4 times in which 3 different mediators (status-seeking, self-esteem enhancement and self-expression) were tested simultaneously and separately. The covariate (price sensitivity) served as a control measure to deny the possibility that the findings were driven by a sample set with only price sensitive respondents. According to Hayes’ literature (2013), the important values that eventually determine the effect of the mediators are the coefficient (b) and the p-value that shows the significance of a relationship. In addition, it is necessary to report the confidence interval (CI) in the end.
Mediators Simultaneously (M1+M2+M3). In the beginning of the analysis, Hayes’ model 4
was used with all 3 mediators simultaneously to understand if an overall emotional purchase motivation mediates the relationship between design appeal and willingness to pay.
Firstly, the direct relationship between design appeal and willingness to pay in the absence of the three mediators was analyzed (X predicting Y). A coefficient of 0.14 and a p-value of 0.00 were found in the absence of all mediators. In the next step, the impact of design appeal on each mediator was investigated. This step included each relationship individually (i.e. X to M1, X to
M2, X to M3) and therefore 3 pairs of coefficients and p-values were found which are shown on the left side in Figure 5. In the third step, each mediator was put in relation to the dependent variable Y (willingness to pay). The beta’s and p-values can be found on the right side in Figure 5. All 6 p-values seen on the left and right side in Figure 5 indicate that these paths are not significant (above 0.05). In the fourth step, the relationship between design appeal and willingness to pay in the presence of all mediators were analyzed. A beta of 0.13 (in %) and a p-value of 0.00 was found (bottom values Figure 5), which demonstrates a small reduction of the coefficient (0.139 to 0.131) compared to the case where the mediators were absent. Figure 5: Mediation Model by Preacher and Hayes (2004): Findings – Several Mediators
In terms of the covariate, a beta of 0.06 and a p-value of 0.10 were found. As a result, whenever the price sensitivity of a consumer goes up by one unit, the willingness to pay also increases by 6%. The p-value of 0.10 highlights that this relationship is slightly not significant (p = 0.10 is slightly above 0.05). The confidence interval for the total indirect effect of this relationship was found to range from -0.006 to 0.026, which suggests that there is no mediation happening when taking into account all mediators at the same time (see Appendix M). As these findings didn’t show a significance, the same model was used for each mediator separately to find out if one of the mediators cannibalizes the greater effect of the other two.
M2: Self-Expression
M
2M
1M
3M1: Status-Seeking M3:Self-Esteem Enhancement
X
Y
X: Design Appeal (Independent Variable) Y: Willingness to pay (Dependent Variable) (Mediators) M‘s present: β = 0.131 , p = 0.000 M2: β = -0.033 , p = 0.639 M‘s absent: β = 0.139 , p = 0.000 M1: β = -0.123 , p = 0.117 M3: β = -0.103 , p = 0.081 M2: β = 0.001 , p = 0.985 M1: β = -0.011 , p = 0.772 M3: β = -0.064 , p = 0.244Status-Seeking (M1). At first, status-seeking as a potential single mediator was analyzed to
understand if a high level of design appeal evokes the feeling of seeking status and indirectly causes a higher willingness to pay.
The first step addressed the direct impact of the independent variable (design appeal) on the dependent variable (willingness to pay) in the absence of the mediator (status seeking). Here, a beta of 0.14 (in %) and a p-value of 0.00 was found. Thus, design appeal is a significant predictor (p = 0.00) of willingness to pay without taking into account the mediator. The b-value shows that for each one-unit increase of design appeal, the willingness to pay increases by 14%. The second step of Hayes’ analysis contains the relationship between the independent variable and the mediator (X predicting M). In the case of design appeal predicting status-seeking, a coefficient of -0.12 and a p- value of 0.12 was found. In other words, for every one-unit increase in design appeal, status-seeking decreases by 0.12 units. However, as the p-value (0.12) implies, this relationship is not significant (p-value above 0.05) across the sample and therefore design appeal is not a significant predictor of the feeling to seek status. Following, the relationship between covariate (price sensitivity) and mediator (status-seeking) were analyzed. Here, a coefficient of 0.25 and a p-value of 0.01 was found. Meaning, for every one-unit increase in price sensitivity, status-seeking increases by 0.25 units. The low p-value (0.01) shows a significance for this relationship.
In the third and fourth step of Hayes’ analysis the full model was considered which contains two paths namely the mediator predicting the dependent variable (M predicting Y) in the presence of the independent variable and the independent variable predicting the dependent variable (X predicting Y) in the presence of the mediator. In terms of the first path, a b-value of -0.04 (in %) and a p-value of 0.27 was found. Therefore, each one-unit increase in status-seeking leads to a 4% decrease in willingness to pay. The high p-value (0.27) indicates that this prediction is not significant though. Looking at the second path, a b-value of 0.13 and a p-value
of 0.00 were found. Meaning, for each one-unit increase in design appeal, the willingness to pay goes up by 13%. The low p-value (0.00) implies that this relationship is valid and design appeal is a significant predictor of willingness to pay (see Figure65). In terms of the covariate, I found a b-value of 0.06 (in %) and a p-value of 0.09. As a result, whenever the price sensitivity of a consumer goes up by one unit, the willingness to pay also increases by 6%. However, the p-value of 0.09 shows that this relationship is not significant. In this case, it is only marginally not significant as the p-value is close to 0.05 (p = 0.09). Lastly, the total indirect effect which was found for the entire model including the mediator is 0.004. The confidence interval (CI) for this analysis ranges from -0.005 to 0.017. Having a confidence interval range that includes 0 is an indicator for no mediation.
Figure 6: Mediation Model by Preacher and Hayes (2004): Findings – Status-Seeking
As a result, I found that design appeal significantly predicts or impacts willingness to pay but is not mediated through status seeking. On top of that a non-significant prediction of willingness to pay through the covariate price sensitivity implies that the results are valid and not due to a high price sensitivity in my data set (see Appendix K for accurate values).
Self-Expression (M2). The same analysis was run with another mediator namely
self-expression. In this case, the goal was to find out if a high level of design appeal causes the feeling of self-expression through the product purchase and thus indirectly causes a higher
X: Design Appeal (Independent Variable) Y: Willingness to pay (Dependent Variable) M1: Status-Seeking (Mediator) 1 M present: β = 0.135 , p = 0.000 β = -0.035 , p = 0.275 β = -0.123 , p = 0.117 M absent: β = 0.139 , p = 0.000
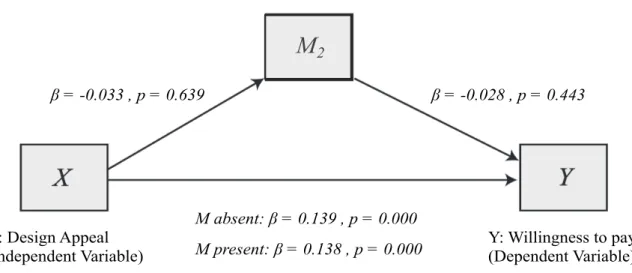
willingness to pay. Again, the covariate prince sensitivity was used as a control measure. As seen in the previous section, the first step of Hayes’ analysis investigates the impact of the independent variable (design appeal) on the dependent variable (willingness to pay) in the absence of the mediator (self-expression). Equal to the previous Hayes’ analysis, a p-value of 0.00 and a coefficient of 0.14 was found. Therefore, increasing design appeal by one unit leads to an increase of 14% in willingness to pay. As the absence of the mediator is assumed in this step, the p-value and coefficient here were expected to be the same as before (mediator is not taken into account only the direct relationship between design appeal and willingness to pay). Following, the relationship between design appeal and the need for self-expression was investigated (X predicting M). A coefficient of -0.03 was found and a p-value of 0.63. Therefore, a one-unit increase of design appeal leads to a 0.03 unit decrease of self-expression, which was shown to be non-significant though (p = 0.63).
In Hayes’ third and fourth step, the entire model was analyzed again. Path 1, the prediction of willingness to pay (dependent variable) by self-expression in the presence of the independent variable, was found to be non-significant with a p-value of 0.44 and a coefficient of -0.03. Thus, this correlation appears to be non-significant. Path 2, which takes into account the relationship between the independent variable and the dependent variable in the presence of the mediator (M) was proven to be significant with a p-value of 0.00 and a coefficient of 0.14 (in %). Therefore, if design appeal increases by 1 unit, willingness to pay is predicted to increase by 14% (see Figure 7). For the relationship between price sensitivity (covariate) and willingness to pay (dependent variable) a coefficient of 0.06 and a p-value of 0.11 were found. As a result, the relationship is also non-significant (p = 0.11), meaning, price sensitivity does not predict willingness to pay in the presence of the mediator. The total indirect effect of the entire model including the mediator was 0.0009. The confidence interval (CI) from -0.006 to 0.012, which includes 0, suggested that there is no mediation happening through self-expression. The
significant prediction of willingness to pay through design appeal remains valid. Also, once again I have found a non-significant prediction of willingness to pay through the covariate price sensitivity. This implies that the results are not due to a high price sensitivity in my data set (see Appendix L for accurate values).
Figure 7: Mediation Model by Preacher and Hayes (2004): Findings – Self-Expression
Self-Esteem Enhancement (M3). As the values appear to be similar for each of the 3 tested
mediators, this section will be limited to only the relevant findings. For further investigation, the detailed values can be found in Appendix M. In case of self-esteem enhancement, the analysis was meant to understand if seeking for self-esteem enhancement (mediator) mediates the relationship between design appeal (independent variable) and willingness to pay (dependent variable). The relevant findings showed that design appeal predicts willingness to pay significantly in both the presence and absence of the mediator. Also, equally to the other two tested mediators, I could not find that design appeal significantly predicts the mediator (self-esteem enhancement). To clarify, a one-unit increase of design appeal does not necessarily predict an increase or decrease in feeling the need to enhancing one’s self-esteem through product purchases. In addition, a low indirect impact of 0.007 was found. Having a confidence interval from -0.003 to 0.023 testifies no mediation (see Appendix L).
X: Design Appeal (Independent Variable) Y: Willingness to pay (Dependent Variable) M2: Self-Expression (Mediator) 1
M
2 M present: β = 0.138 , p = 0.000 β = -0.028 , p = 0.443 β = -0.033 , p = 0.639 M absent: β = 0.139 , p = 0.0005 Discussion
The findings demonstrated that a high level of design appeal is significantly responsible for higher willingness to pay. This effect was observed across several different product categories and three different design levels.
Looking back to the hypotheses, the findings could therefore support hypothesis 1. As a result, a higher level of design appeal leads to higher willingness to pay among customers when purchasing utilitarian products. Through the mediation model by Hayes, this study looked at the “why” behind the positive correlation of design appeal and willingness to pay. The tested potential mediators, namely status-seeking, self-expression and self-esteem enhancement were not identified as mediators (in simultaneous as well as in individual consideration). As a result, hypotheses 2-4 have to be rejected. One has to ask why there was no mediation through the aforementioned variables even though there is a significant positive correlation between design appeal and willingness to pay. In general, for all four investigations, a low R-squared value (see Appendix J, K, L, M) indicated that there are many other influential variables that were not included in the model but could be looked at in future studies. It is suggested that other potential mediators such as category involvement, brand loyalty, perceived product quality or product satisfaction should be analyzed with Hayes’ model to understand why design appeal causes willingness to pay.
6 Conclusion and Outlook
6.1 Managerial & Research Implications
As the literature review pointed out, the role of design in product development has become increasingly more important. Despite the intuition that design is only important for hedonic products, the present study highlighted that this assumption holds also true in terms of utilitarian products. The significant positive relationship between design appeal and willingness to pay
was verified and shall therefore provide a foundation for further product development processes. Thus, also for products which are meant to fulfill more functional needs (utilitarian products) the design component must not be underestimated and can be responsible for a competitive advantage among firms. By developing products which show a pleasant level of aesthetics, customers are willing to pay more for a product. Also, there is a chance to capture loyal customers through an increase in overall customer satisfaction. This study could not find significant proof for emotional intentions why consumers favor well-designed utilitarian products. Companies and other researchers should elaborate on the “why” and should conduct more studies in the future. This can help to be trailblazers in this field and gain a competitive advantage. Due to the evolving and changing consumer preferences, many new emotional needs arise. Companies should therefore rethink their product designs and try to address emotional arousal of their consumers.
The importance of design appeal also implies a business opportunity to establish a luxury or premium goods market for utilitarian products as luxury/premium goods are usually coined by high levels of design and trigger higher willingness to pay. The best example to support this thought is the change in the automotive industry which traditionally sold utilitarian products for transportation needs but shifted towards selling hedonic products as cars have become more joyful and exciting. Cars are also a good example to highlight how the design of a traditionally utilitarian product has become a factor to gain brand differentiation and brand superiority in many geographical markets.
6.2 Limitations and Future Outlook
In terms of the limitations, it is to say that a sample set is usually not completely representative for all consumers. The findings give an indication for companies and managers for their new product development processes but cannot cover all customers in one’s target group. Also, most participants were 20-30 years old which leaves a lack of data for older generations. Thus, it is
suggested that future research should have a closer look at older generations and their willingness to pay for well-designed utilitarian products.
Another limitation to the findings is the cross-sectional nature of the survey. A longitudinal study covering years and analyzes the behavior of the same sample at different points in time is suggested to complement current findings. Testing the same hypothesis over a longer period with several testing points can help to show if the verification of this hypothesis is only based on current consumer trends. Moreover, general limitations of studies using online questionnaires are the misunderstanding of the question. Also, surveys often put participants in unnatural situations in which they feel the need to answer in the right way instead of the most honest way. Respondents might feel exposed by showing their true self even if the questionnaire is fully anonymous. As a result, future research should complement these findings by conducting qualitative research, which can provide more accurate responses. Especially studies that investigate category involvement, brand loyalty, perceived product quality or product satisfaction can give valuable insights into this barely explored field of research.
This work project has shown that among many features, the design component comprises a high potential to sustain a competitive advantage with utilitarian products. It is recommended that companies rethink their product and design development processes to meet consumers’ visual preferences. Not only can companies gain a competitive advantage in their current industry but in addition they have the chance to reshape the current market by providing premium or luxurious utilitarian products. I would like to end this study with a famous quote by Steve Jobs to point out the opportunity companies have by providing well-designed utilitarian products. “People don’t know what they want until you show it to them” (Steve Jobs, 1997).
References
Banister N., Hogg M.K. (2003). “Negative symbolic consumption and consumers’ drive for
self-esteem: The case of the fashion industry“,
European Journal of Marketing, vol. 38, no. 7, pp. 850–868.
Baxter M. (1995). “Product Design”
Brunel University, UK: Chapman & Hall
Berger, C., Blauth, R. and Boger, D. (1993). “Kano’s Methods for Understanding Customer
defined Quality”, In: Center for Quality
Management Journal, Vol. 4 (Fall 1993), pp. 3 - 36.
Candi, M. (2010). “Benefits of Aesthetic Design as an Element of New Service Development”,
Journal of Product Innovation Management, vol. 27, no. 7, pp. 1047–1064.
Guerreiro, J.; Paulo R., and Duarte T. (2015). “Attention, Emotions and Cause-Related
Marketing Effectiveness.”
European Journal of Marketing 49, no. 11/12, pp. 1728–50.
Hackley, C. & Tiwsakul, R. (2006). „Entertainment marketing and experiential consumption“, Journal of Marketing Communications, vol. 12, pp. 63–75.
Hayes, A.F. (2018). “Introduction to Mediation, Moderation, and Conditional Process
Analysis, Second Edition: A Regression-Based Approach”,
New York: The Guilford Press 2018.
Hayes, A.F. & Preacher, K.J. (2008). “Asymptotic and resampling strategies for assessing and
comparing indirect effects in multiple mediator models“,
Hennig-Thurau, T., Gwinner, K. P., Walsh, G., (2004). „Electronic word-of-mouth via
consumer-opinion platforms: What motivates consumers to articulate themselves on
the internet?“,
Journal of Interactive Marketing, vol. 18, pp. 38–52.
Hsu, CL.; Chen, YC. and Yang TN. (2017). “Does product design matter? Exploring its
influences in consumers’ psychological responses and brand loyalty”,
Information Technology & People, Vol 31 No. 3, pp. 886-907.
Jobs, S. (1997). “People don’t know what they want until you show it to them”, Interview with Business Week in 1997.
Klein, Kristina and Melnyk, Valentyna (2014). “Speaking to the mind or the heart: effects of
matching hedonic versus utilitarian arguments and products“,
Marketing Letters, vol. 27, no. 1, pp. 131.
Landwehr, JR.; Wentzel, D. and Herrmann, A. (2013). “Product Design for the Long Run:
Consumer Responses to Typical and Atypical Designs at Different Stages of Exposure“,
Journal of Marketing, vol. 77, no. 5, pp. 92–107.
Lee, D. and Hosanager, K. (2016). “When do Recommender Systems Work the Best? The
Moderating Effects of Product Attributes and Consumer Reviews on Recommender
Performance“,
25th International World Wide Web Conference, WWW 2016, pp. 85–97.
Lim, E. and Ang, S.W. (2008). “Hedonic vs. utilitarian consumption: A cross-cultural
perspective based on cultural conditioning“,
Journal of Business Research, vol. 6, pp. 225–232.
Lu, J.; Liu, Z. and Fang, Z. (2016). “Hedonic Products for You, Utilitarian Products for Me.”, Judgment and Decision Making, vol. 11, no. 4, pp. 332–341.
Moon, H.; Park, J. & Kim, S. (2015). “The Importance of an Innovative Product Design on
Customer Behavior: Development and Validation of a Scale”,
Journal of Product Innovation Management, vol. 32, no. 2, pp. 224–232.
Mumcu Y., Kimzanb H.S. (2015). “The Effect of Visual Product Aesthetics on Consumers’
Price Sensitivity”,
Procedia Economics and Finance 26 ( 2015 ), pp. 528 – 534.
Noble, C.H. and Kumar, M. (2010). “Exploring the appeal of product design: a grounded,
value based model of key design elements and relationships”,
Journal of Product Innovation Management, Vol. 27 No. 5, pp. 640-657.
Noh M., Runyan R., and Mosier J. (2014). “Young Consumers’ Innovativeness and
Hedonic/Utilitarian Cool Attitudes.”,
International Journal of Retail & Distribution Management, vol. 42, no. 4, pp. 267–280.
Phau and Min T.I., So J.T., Parsons A.G. (2013). “Corporate branding, emotional attachment
and brand loyalty: the case of luxury fashion branding“,
Journal of Fashion Marketing and Management, vol. 17, no. 4, pp. 403–423.
Saenger C., Thomas V. & Johnson J.W. (2013). “Consumption-Focused Self-Expression
Word of Mouth: A New Scale and Its Role in Consumer Research“,
Psychology & Marketing, vol. 30, no. 11, pp. 959–970.
Saunders, M.; Lewis, P., and Thornhill, A. (2019). “Research Methods for Business Students“, Harlow: Pearson Education Limited.
Shukla P. (2008). “Status consumption in cross-national context Socio-psychological, brand
and situational antecedents“,
Scott, K; Martin, DM. and Schouten, JW. (2014), “Marketing and the New Materialism”, Journal of Macromarketing, vol. 34, no. 3, pp. 282–290.
Sedikides, C.; Gregg, AP. And Cisek, S. (2007). “The I That Buys: Narcissists as Consumers.”, Journal of Consumer Psychology, vol. 17, no. 4, pp. 254.
Veryzer, J. and RW (1995), “The Place of Product Design and Aesthetics in Consumer
Research”,
Advances in Consumer Research, vol. 22, no. 1, pp. 641–645.
Voss, Kevin E.; Spangenberg, ER. and Grohmann B. (2003). “Measuring the Hedonic and
Utilitarian Dimensions of Consumer Attitude”,
Journal of Marketing Research, vol. 40, no. 3, pp. 310-320.
Wansink B., Payne C.R., Painter J. (2014). “What is Beautiful Tastes Good: Visual Cues, Taste,
and Willingness to Pay”,
Applied Economics and Management, Cornell University (2014).
Woodbury Hooper, Mary (2020). “Product Design”, Definition in Salem Press.
Zhou, S.; Xue, Fei and Zhou, P. (2002). “Self-esteem, life-satisfaction and materialism: Effects
of advertising images on Chinese college students”,
Appendix
A. Utilitarian & Hedonic Item Scale (Voss et al., 2003)
B. Status-Seeking Evaluation Scale by Eastman, Goldsmith & Flynn C. Self-Expression Evaluation Scale by Saenger, Thomas and Johnson D. Self-Esteem Enhancement Evaluation based on Rosenberg
E. Full Survey Structure (Qualtrics) F. Sample Composition Pre-Study
G. Assessment of the utilitarian product value H. Sample Composition Main Study
I. Reassessment of the utilitarian product value J. Hayes Mediation Model 4 – Status-Seeking
K. Hayes Mediation Model 4 – Self-Esteem Enhancement L. Hayes Mediation Model 4 – Self-Expression
M. Hayes Mediation Model 4 – Several Mediators N. Cronbach’s Alpha – UT/HED Scale Reliability
A. Utilitarian & Hedonic Item Scale (Voss et al., 2003)
B. Status-Seeking Evaluation Scale by Eastman, Goldsmith & Flynn
Status Consumption Scale Items:
1. I would buy a product just because it has status. 2. I am interested in new products with status. 3. I would pay more for a product if it had status.
4. The status of a product is relevant to me. (transposed into positive version) 5. A product is more valuable to me if it has some snob appeal.
Not Amusing/Amusing Not Funny/Funny Not Thrilling/Thrilling Not Happy/Happy Not Playful/Playful Unenjoyable/Enjoyable Not Cheerful/Cheerful Handy/Not Handy Productive/Unproductive Problem Solving/Not Problem Solving
Utilitarian (UT) Hedonic (HED)
Dull/Exciting Not Delightful/Delightful Not Sensuous/Sensous Not Fun/Fun Unpleasant/Pleasant Functional/Not Functional Sensible/Not Sensible Helpful/Unhelpful Efficient/Inefficient Effective/Ineffective Beneficial/Harmful Useful/Useless Practical/Impractical Necessary/Unneccessary
C. Self-Expression Evaluation Scale by Saenger, Thomas and Johnson
Self-Expression Scale Items:
1. I like to talk about what products and services I use so people can get to know me better. 2. I like the attention I get when I talk to people about the products and services I use. 3. I talk to people about my consumption activities to let them know more about me. 4. I like the idea that people want to learn more about me through the products and services
I use.
5. I like it when people pay attention to what I say about my consumption activities.
D. Self-Esteem Enhancement Evaluation based on Rosenberg
Self-Esteem Enhancement Scale Items:
1. Buying new products helps me to be satisfied with myself. 2. Without buying new products I don’t have much to be proud of. 3. Buying new products makes me feel like a person of worth. 4. Without buying new products I feel like I am no good at all. 5. Buying new products helps me to develop more respect for myself.
E. Full Survey Structure (Qualtrics) – Document Pages 29 – 43
Appendix Note: Block 2 consists of 9 different subsections (a-i). Each participant only saw one of these subsections. Randomly allocation was used through Qualtrics.
Appendix Note: Block 2 consists of 9 different subsections (a-i). Each participant only saw one of these subsections. Randomly allocation was used through Qualtrics.
F. Sample Composition Pre-Study
G. Assessment of utilitarian product value
H. Sample Composition Main Study
60% 40% Gender Male Female 47% 53% Age 18-24 25-34
Useless - Useful Not Functional - Functional Not Practical - Practical
Textbook UT means 4.1 3.5 3.1
Toolset UT means 5 4.7 4.7
Printer UT means 3.6 3.7 3.3
Not Problem Solving - Problem Solving Unhelpful - Helpful Overall means (UT)
Textbook UT means 3.7 4.1 2.14
Toolset UT means 4.6 4.8 2.88
Printer UT means 3.8 4 2.12
Not Delightful - Delightful Unenjoyable - Enjoyable Not Amusing - Amusing
Textbook HED means 3 2.6 2.2
Toolset HED means 3 3.1 2.6
Printer HED means 2.2 2 1.9
Unpleasant - Pleasant Not Cheerful - Cheerful Overall means (HED)
Textbook HED means 2.8 2.1 1.56
Toolset HED means 3.3 2.7 1.74
Printer HED means 2.1 1.9 1.22
36% 64% Gender Male Female 71% 19% 7% 3% Age 20-25 26-30 30-50 > 50 14% 44% 39% 1% 2% Highest Degree
J. Hayes Mediation Model 4 – Status-Seeking
= WTP_Percentage = Design_Appeal = StatusSeeking
K. Hayes Mediation Model 4 – Self-Esteem Enhancement
= WTP_Percentage = Design_Appeal = SelfEsteem
L. Hayes Mediation Model 4 – Self-Expression
= WTP_Percentage = Design_Appeal = SelfExpression
N. Cronbach’s Alpha – UT/HED Scale Reliability Pre-Study: