Policy Making and Regulation to Promote
Entrepreneurship:
Procedural vs. Monetary Policies
Bernhard Martin Siegert
Dissertation written under the supervision of Prof. Claudia Costa
Dissertation submitted in partial fulfilment of requirements for the MSc in
International Management, at the Universidade Católica Portuguesa,
Abstract
Title: Policy Making and Regulation to Promote Entrepreneurship: Procedural vs. Monetary Policies
Author: Bernhard Martin Siegert English:
The main objective of this paper is to understand under what circumstances a government should focus on procedural or monetary policies to foster entrepreneurial entry. To do this, we measure entrepreneurship by the entry density of new companies, which counts formally registered entrepreneurs only. However, we also control the effect on opportunity and necessity-driven entrepreneurship rates, which include entrepreneurs of all stages and sectors. Procedural and monetary policies are represented by time and cost to start a business respectively. The variety of control variables used in literature is approached by aggregating explanatory variables from 16 studies, resulting in 44 variables of which 8 are used in the regression analysis. For the empirical analysis, we use country and year fixed effects with country-clustered standard errors. We find a stronger positive impact for lowering cost to start a business, especially in countries with high rates of necessity-driven entrepreneurs or countries which did not belong to the lowest third in cost or time to start a business. However, the findings also suggest, that these policies do not incentivize non-entrepreneurs to engage in entrepreneurship, but rather attract informally operating entrepreneurs to register their business.
Portuguese:
O principal objetivo deste trabalho é compreender sob quais circunstâncias a administração pública deve focar em políticas procedimentais ou monetárias para fomentar novos empreendimentos. Para isso, medimos o empreendedorismo através da entrada de novas companhias no mercado, considerando apenas empreendedores formalmente registrados. Contudo, também verificamos o efeito da oportunidade e necessidade no índice de empreendedorismo, o que inclui empreendedores em todas fases e setores. Políticas procedimentais e monetárias são representadas pelo tempo e pelo custo para começar um negócio, respectivamente. A pluralidade de variáveis de controle utilizada na literatura é abordada pela conjugação de variáveis explicativas de 16 estudos, resultando em 44 variáveis, das quais 8 são utilizadas na análise de regressão. Para a análise empírica, utilizamos efeitos fixos por país e por ano com desvios-padrão agrupados em países. Encontramos um forte impacto positivo para reduzir os custos para começar um negócio, especialmente em países com alto índice de empreendedores impulsionados pela necessidade ou países que não pertenciam ao terço mais baixo de preço ou tempo para iniciar um negócio. Todavia, as conclusões também sugerem que essas políticas não incentivam não-empreendedores a se envolverem no empreendedorismo, mas sim atraem empresários que atuam informalmente no mercado a registrarem seus negócios.
Contents
Abstract ... II List of Graphs ... IV List of Tables ... IV Abbreviations ... IV Acknowledgements ... V 1. Introduction ... 1 2. Literature Review ... 42.1. Entrepreneurship and the Government ... 4
2.2. Entrepreneurial Motivations and Measurements ... 5
2.3. Modes of Governmental Support ... 7
2.3.1. Procedural Policies and Regulations ... 8
2.3.2. Monetary Policies and Regulations ... 10
2.4. Explanatory Factors for Entrepreneurship ... 12
2.5. Hypotheses Development ... 14
3. Methodology ... 17
3.1. Data Sourcing and Consolidation ... 17
3.2. Measures and Data Structure ... 18
4. Empirical Evaluation ... 24 4.1. Theoretical Models ... 25 4.2. Results ... 26 5. Discussion ... 31 6. Limitations ... 33 7. Conclusion ... 34 Appendix ... VI References ... XVII
List of Graphs
Graph 1 Hypothesis framework ... 16
Graph 2 Entry density development per country status ... 20
Graph 3 Quartiles of necessity-driven entrepreneurship per economic development ... 21
Graph 4 Entry density for countries with pre-conditions by economic development ... 21
Graph 5 Impact of isolated policy-changes ... 24
Graph 6 The entrepreneurial process ... VIII Graph 7 Criteria used for categorization of global competitiveness ... XIII
List of Tables
Table 1 Commonly used indicators for measuring entrepreneurship ... 6Table 2 Aggregated common independent variables to explain entrepreneurial entry ... 12
Table 3 Correlation table ... 19
Table 4 Descriptive statistics ... 22
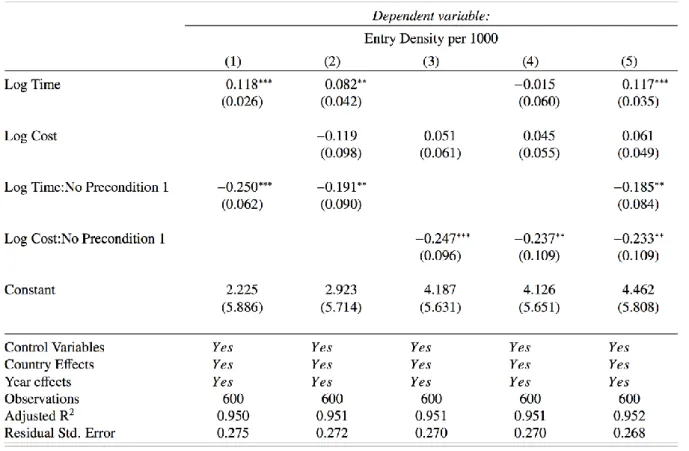
Table 5 Regression of time and cost with and without control variables ... 27
Table 6 Regression with interaction for high necessity driven entrepreneurship ... 28
Table 7 Regression including interaction about pre-conditions ... 29
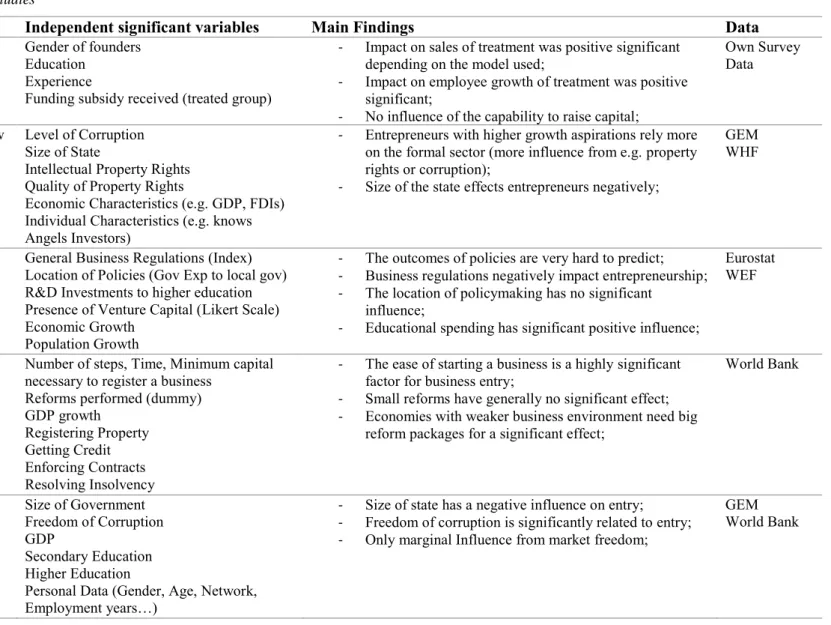
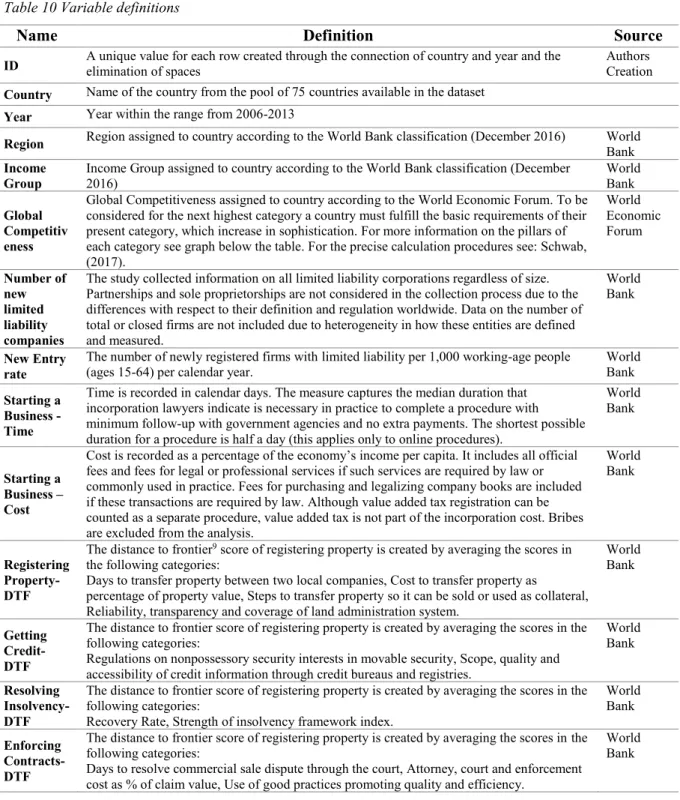
Table 8 Comparison of opportunity and necessity- driven entrepreneurship ... 30 Table 9 Collection of empirically relevant studies ... IX Table 10 Variable definitions ... XII Table 11 Serial correlation ... XV Table 12 Countries in the sample ... XVI
Abbreviations
ANOVA. Analysis of Variance
AVCAL. Australian Private Equity and Venture Capital Association
DARPA. Defense Advanced Research Projects Agency
FDI. Gross National Income GDP. Gross Domestic Product GNI. Gross National Income LLC. Limited Liability Company NES. National Expert Survey
PSID. Panel Study of Income Dynamics ROI. Return on Invest
SBIR. Small Business Innovation Research SME. Small and Medium-sized Enterprises TEA. Total Early-Stage Entrepreneurial
Activity
VC. Venture Capital
WEF. World Economic Forum WHF. World Heritage Foundation
Acknowledgements
During my Master studies entrepreneurship has been a fascinating topic for me. Most of my courses on this subject, dealt with practical tools on how to be a successful entrepreneur. Validate your idea, how to pick the right team, how to raise funding etc., were among the most important lectures we were taught. As my scope of knowledge began to widen, I became more curious about this topic. I realized, that one aspect consistently left out in all courses and lectures was “how to deal with regulations as an entrepreneur”. I can think of four reasons why:
1. Because there is no precedence of teaching material on it
2. The regulatory environment is too volatile to produce teaching material on it. 3. Regulations vary too profoundly across countries to create generalized material. 4. It is too boring to keep students awake in a lecture.
While I was traveling in Brazil, I came across the story of a local entrepreneur. He found an underserved niche in the market and started to a venture, making profit within the first year. Yet, his business was still unofficial and he wanted to enter the formal market. The process of registering the business and obtaining an operating license took so much time and money, that in the end he had to go out of business. From this story, I realized, that the subject was not about his (entrepreneurial) mistakes, but the public system to encumber entrepreneurship. Therefore, I understood that it is not only us students who needed to learn about entrepreneurship. It is also policy makers. To this end I would like my thesis to contribute to the clarification of the fruitful frame condition entrepreneurs need, to be able to focus on value creation instead of satisfying bureaucratic agendas.
I would like to thank my parents for all the doors they opened for me, and the freedom of letting me choose which one to walk through. Thanks to my sister Christina Siegert for her attention to detail. To my advisor, Prof. Claudia Costa for her sincere advice and review. To Filipa Reis for sacrificing time to crack numbers. Last but not least, I would like to thank Geovanna Vozikis for always listening to my worries and empowering me to excel.
1. Introduction
Since 2006 the World Bank has recorded 2782 regulatory reforms1 in the “Doing Business”
database, of which 283 were implemented in 2015/16 in 137 countries – an increase of 20% compared to the previous year. The highest amount of reforms were consistently submitted for the “starting a business” category (World Bank, 2017c) – which uses 11 different indicators to measure the ease of starting a business in a country. These reforms involve procedural and monetary reforms, aiming to make entrepreneurship easier and cheaper. The question is, which current policy has the strongest impact for promoting entrepreneurship? In the academic community entrepreneurship is widely accepted as a driver of job creation and innovation (Bruton et al., 2013), which has made it a political interest and tool to drive economic growth. Though the benefits of entrepreneurship are evident, researchers are still looking for clear instruction on how to promote it. Baumol, (1993) was one of the first to identify specific factors on country level which influenced entrepreneurship. Despite the progress made since then at outlining the impact of the different levers that promote or inhibit entrepreneurship, practitioners still seem to be confused about the reciprocities between different reforms and national idiosyncrasies, which determine the success of entrepreneurial policy making and reformation (Nanda, 2010). For example, a targeted entrepreneurship credit-subsidy policy in the U.S. achieved the expected impact in the targeted group, but had the opposite effect on entrepreneurs not covered by the policy, decreasing their rate of entrepreneurship (Li, 2002). Conversely, policies not directed at entrepreneurs might impact new venture creation. For example, the extension of a healthcare program to underprivileged families, resulted in an over 20% increase in self-employment without even targeting entrepreneurship (Olds, 2014). Singapore noted a 75% increase in annual business registration after implementing an electronic registration system (Klapper et al., 2006). These examples illustrate a certain arbitrariness of the effects governmental policy making can have and underlines the importance of further research in this area.
Researchers acknowledge important trade-offs in policies such as between stimulating or regulating competition (Gilbert et al., 2008) or between protecting incumbents or new
1 According to the OECD “regulatory reform” is used to refer to: “changes that improve regulatory quality, that
is, enhance the performance, cost-effectiveness, or legal quality of regulations and related government formalities. Reform can mean revision of a single regulation, the scrapping and rebuilding of an entire regulatory regime and its institutions, or improvement of processes for making regulations and managing reform.” (OECD, 1997, p. 11)
entrants. Uber and Airbnb illustrate such policy trade-offs, since their business models were challenged in the earliest days by regulation to protect the incumbent industry (McGinn, 2017). Also regional idiosyncrasies (Williams and Nadin, 2012) and industrial clusters are crucial to consider, since they can be deciding factors for network creation, knowledge spillover and competition (Gilbert et al., 2008). Government policies mold the constraints, uncertainty and opportunities of the marketplace, that encourage (or discourage) the entrepreneurial activity (Minniti, 2008). Unfit policies can have costly implication for the economy of a country.
The importance of the phenomena is seen in the growing number of published studies on governmental support on entrepreneurship. From 1997 to 2006, 474 articles were published in academic journals on this topic. This increased from 2007 to 2016 to 1759 articles2. During
this period, the focus of research shifted towards research on government policies (as a subtopic of how governments can support entrepreneurship) with 4,5 times as many articles in this category compared to the previous ten years. Research on governmental entrepreneurship policies can be grouped in the impact of procedural (e.g. Klapper et al., 2006) and monetary (e.g. Li, 2002) policies on entrepreneurial development, and governmental venture capitalism (as a special form of providing support for both) (e.g. Colombo et al., 2016). Extant research has looked at the influence of the boundary conditions of countries (e.g. corruption, size of government etc.) (Aidis et al., 2012) and individual factors of entrepreneurs (e.g. education, gender etc.) (Hopp and Stephan, 2012).
Despite the topic has been well researched (both qualitatively and quantitatively) (Audretsch et al., (2007) Minniti, (2008)),why is there still confusion in governmental policy making? A closer look at the literature provides several hints. First, academics have used very different variables and datasets, making their results hard to compare and to apply across economies. Schott and Wickstrom Jensen, (2008) showed how countries, that tried to replicate successful policy making failed, due to their unfit for the local, cultural, economic, or political situation. Second, the interdependencies (how the effect of a variable changes when varying another) between different policies and their relative strength are still a neglected area of research. Peru jumped from 2009 to 2010 51 places in the global “Starting a Business” ranking, by reducing the time needed to register a business by 14 days and the costs by USD 121.00 (Klapper and
2 As at 15.02.2017 based on searching the EBESCO Database for Peer-Reviewed, English, Journal Articles on
Love, 2012). It is unclear, however, which one of these actions triggered this performance on entrepreneurial entry – the time or the cost reduction? Eventually only a combination of time and cost is effective, but how big is the relative strength of the effects?
The main objective of this dissertation is to understand when and under what circumstances a government should focus on procedural or monetary policies to foster entrepreneurial entry. Researching this question has important implications for governments. It sheds light to the question whether for promoting entrepreneurship governments must take monetary actions, often a more complex process in terms of budget approval rather than procedural improvements, which could trigger comparable, eventually better results. For the future, this will allow policy makers to base their decisions on research results and facts. Awareness of such implications are also relevant for entrepreneurs as they can better estimate the opportunities and risks from the regulatory environment influencing their business.
The remaining chapters are organized as follows: In chapter two each governmental instrument will be reviewed and relevant key variables will be elaborated. The chapter will finalize with a review of the gained knowledge to develop the hypotheses. Chapter three provides an overview of the available data and leverages on the acquired knowledge from the previous chapter, to pick the right variables. Following, the empirical analyses and statistical methods applied will be outlined. The findings will be discussed in chapter four, while the chapters five to seven discuss and conclude the results with the according limitations of this study.
2. Literature Review
This chapter reviews the state of knowledge for research on entrepreneurial policy making. The relevant terminology of measuring entrepreneurship from a governments’ perspective will be explained. Following the different governmental levers to foster entrepreneurship will be outlined and empirically important variables for predicting it will be identified. The results will be summarized and used to form the hypothesis for the empirical analysis.
2.1. Entrepreneurship and the Government
For a long time researchers have accepted the substantial role of entrepreneurs, taking high risks and uncertainty (Knight, 1921) and being drivers of innovation and competition (Schumpeter, 1942). Entrepreneurship is defined by the habitual creation and innovation to build something of recognized value around perceived opportunities (Bolton et al., 2004). Existing literature distinguishes between the behavioral and occupational view in entrepreneurship. The behavioral approach describes entrepreneurship as an outcome of companies or individuals from their internal and external factors like culture or personal background (Shaker, 1993). In the occupational view, entrepreneurship is seen as a conscious career choice whereas the success factors are similar to other career choices, like becoming a teacher or a nurse (Burton et al., 2016). Both approaches are characterized by the entrepreneurial opportunity:
“Entrepreneurial opportunities are a set of environmental conditions that lead to the introduction of one or more new products or services in the marketplace by an entrepreneur or by an entrepreneurial team through either an existing venture or a newly created one” (Dutta and Crossan, 2005, p. 426).
Shane and Venkataraman, (2000) propose three categories for creating entrepreneurial opportunity. First, entrepreneurial opportunities can arise from new knowledge or technologies. Second, by the compensation of market gaps and inefficiencies and finally, by political, demographic, or regulatory shifts that allow for a different use of existing assets. From a government’s perspective, the third category can be influenced. This rises the questions if and how a government should manipulate the “set of environmental conditions” to create entrepreneurial opportunity. Researchers disagree about governmental intervention on entrepreneurship. Minniti, (2008) argues: “the fact that entrepreneurship is positively linked to performance does not justify public policy intervention” (p. 787). Audretsch, (2004) suggests intervention only at fundamental market failures. However, van Praag and Versloot, (2007) explain, that entrepreneurship influences the economy of a country, particularly in the areas of employment creation, productivity growth and high quality innovations. Hart, (2003)
goes a step further, arguing that the level and quality of entrepreneurship makes a difference in the economic vitality of communities, regions, industries, and the nation. Even though there is disagreement, the side of authors in favor of actively promoting entrepreneurship via regulatory intervention predominates (Bruton et al., 2013).
2.2. Entrepreneurial Motivations and Measurements
One could conclude, since entrepreneurship promotes economic growth, that countries with high rates of entrepreneurship have high performing economies and thus governments should intervene if entrepreneurship rates are low. However, not all entrepreneurs have the same motivation, resulting in opposing economical outputs. Besides, in the literature the rate of entrepreneurship is measured in several different ways.
The occupational approach of entrepreneurship described the phenomena of entrepreneurship as a conscious career choice, but careers are chosen for different motivations. Acs, (2006) established a motivational-based differentiation between opportunity and necessity driven entrepreneurs. Opportunity-driven entrepreneurs (as the name says) decide to explore opportunities for their conviction and literally because they see the opportunity as described in the definition of Shane and Venkataraman, (2000). Opportunity driven entrepreneurs are more likely to create the desirable effects of staying sustainably in business and employing people (GEM, 2017), which is why their contribution to the economy is according to the findings of Hart, (2003) or Bruton et al., (2013) positive. Necessity-driven entrepreneurs on the other side engage in entrepreneurship because they have no other choice. This results from different reasons such as the typically lower level of education among necessity-driven entrepreneurs (van Stel et al., 2007) complemented by a lower developed job market. Fittingly, developing countries usually have a much larger share of necessity driven entrepreneurship. Necessity entrepreneurs have a negative impact on the GDP (Sautet, 2013). This roots in the fact, that they are less likely to actually register their business and enter the formal economy (Acs et al., 2008). Hence, a country could have high rates of entrepreneurship, but not a high performing economy.
Entry measurements of these two motivational groups of entrepreneurs result in different rates of entrepreneurship. However, literature uses even more diverse indicators to measure entrepreneurial entry in a country. A widely accepted indicator is the entry density, defined as newly registered LLCs measured by the World Bank per 1000 working age people (e.g. used by Klapper and Delgado, 2007). This indicator only measures entrepreneurs which already
entered the formal economy3. Quite the opposite is the indicator of the nascent
entrepreneurship rate, also called baby entrepreneurs because they are in the earliest stage of entrepreneurship without having earned salaries yet (e.g. used by Koellinger and Minniti, (2009) or Wennekers et al., (2005)). Compared to the entry density, nascent entrepreneurs include especially entrepreneurs in the informal economy, who did not register their business officially yet. Nascent entrepreneurship is measured by the Global Entrepreneurship Monitor consortium (GEM), which also provides the total early-stage entrepreneurial-activity (TEA) indicator. The TEA includes nascent, but also owner managers of new businesses less than 42 month old, making it one of the most comprehensive indicators (e.g. used by Aidis et al., (2012)). The Global Entrepreneurship Monitor offers also the previously mentioned distinction between opportunity and necessity-driven entrepreneurship with the TEA as base-indicator. Appendix 2 provides an overview of the entrepreneurial process, which also illustrated the scope of the different measures.
Table 1 Commonly used indicators for measuring entrepreneurship
There are some important caveats to consider when choosing the variable for measuring entrepreneurship. Many indicators that rely on data of the formal sector, like entry density, tend to under-estimate entrepreneurship, since self-employments and informal companies are left out (Desai, 2009). On the other hand, the GEM data over-estimates entrepreneurship, as it includes next to formally registered companies, also nascent entrepreneurs, that might never actually register their company. The true rate of entrepreneurship lies in between these
3 A LLC (limited liability company) is counted when it has start-up capital of ten times income per capita, and
has a turnover of at least 100 times income per capita World Bank (2017c)).
Variable Definition Source
TEA Total Early-Stage Entrepreneurial Activity; percent of 18-64 age group who are either a nascent entrepreneur (actively involved in starting a new business) or owner-manager of a new business (less than 42 months old).
GEM, (2017)
TEA OPP Opportunity-Driven Entrepreneurial Activity; Those involved in TEA who claim to be driven by opportunity as opposed to finding no other option for work.
GEM, (2017)
TEA NEC Necessity-Driven Entrepreneurial Activity; Those involved in TEA who are involved in entrepreneurship because they had no other option for work.
GEM, (2017)
Nascent Entrepreneu rship Rate
18-64 population who are currently a nascent entrepreneur, i.e., actively involved in setting up a business they will own or co-own; this business has not paid salaries, wages, or any other payments to the owners for more than three months
GEM, (2017)
Entry Density
Number of newly registered limited liability companies per 1,000 working-age people (aged 15-64)
World Bank, (2017b)
indicators (Acs et al., 2008). This dissertation will use entry density as dependent variable, which will be furtherly discussed later in this dissertation.
2.3. Modes of Governmental Support
A starting point for understanding the role of government to support entrepreneurs was Sotos', (1989) seminal study on informal markets in Peru. Soto describes the rational choice entrepreneurs face when confronted with the costs (time and money) of formal markets as compared to staying informal4. He argued, that for all the costs informality poses, such as the
loss of formal legal protection or productivity (due to resources used to remain undetected by authorities), a relatively innovative business, even if facing the costs of formality, will be larger than informality ever permits. Therefore, he was a strong advocate for reforming public institutions to lower the barriers of entry into the formal economy.
Following up on Soto, Williams and Nadin, (2012) showed, that informality is neither a problem of the past nor only of the third world, as nearly two-thirds of the global working population and over half in the European Union have worked, at least temporarily, in the informal economy. Public intervention can be categorized into procedural and monetary policies, as well as public venture capitalism5. The regulatory environment plays a major role
for successful entrepreneurship (Ribeiro and Galindo, 2012). The different mechanisms how a
4 Whereas informality is defined as “the collection of firms, workers, and activities that operate outside the legal
and regulatory frameworks or outside the modern economy” Benjamin et al. (2014)
5 Public VCs (Venture Capitals) are not part of the empirical evaluation since their punctual influence does not
significantly influence the entry density of new companies in a country (Minniti, 2008). For completeness, this passage gives a summary on the state of research on public VCs: Since the economic crisis of 2009 private VCs prefer more risk-safe investments (Colombo et al. 2016). Public VCs are an instrument to bridge the finance gap between the public and the private market. Furthermore, governments can sponsor areas of their political interest (e.g. start-ups of a certain industry). Public venture capitalism is a form of private equity, that combines monetary with procedural policies, by giving selected start-ups a monetary grand (often in exchange for equity), but also guidance in e.g. the incorporation process to let founders focus on their business (e.g. Startup Chile) (Bussang, 2014).Agencies like DARPA and SBIR in the U.S., Yozma (Hebrew for "initiative") in Israel, Sitra and Tekes in Finland or Startup Chile have actively shaped and created markets defying the view, that policy is meant to simply “fix” market failures. These direct investments are more successful at generating new private investment than the same money spent through indirect measures like tax credits (Mazzucato 2016). Governments started participating in this market either by founding their own institutions (Lerner, 1996) or via third party investments like pension funds (Minniti, 2008). As a third option, governments also adjusted legislations to make the work of private VCs easier, which proved also successful to attract more private VC funding (Brander et al. 2015). Common measures of the VC activity by public bodies are the percentage of companies managing to exit the VC program (depending on the VCs individual investment and mentoring strategy), the amount of further investment collected or the jobs created after a certain time period Brander et al. (2015). Since VCs are more focused on their operations as opposed to the macro level of the country’s economy, they eventually are more successful than procedural or monetary policies in making new companies succeed, but in terms of the entry density, their presence can hardly be measured at a country level (Minniti, 2008).
government can alter the conditions of entrepreneurship are well studied by the academic community (Audretsch et al., 2007; Minniti, 2008).
2.3.1. Procedural Policies and Regulations
Procedures are step-by-step instructions on how to complete a task. In every country, there are certain procedural requirements an entrepreneur needs to fulfill to be formally registered as an entrepreneur. Therefore, procedural policy making or reformation describes the setup or alteration of such requirements (Bower and Abolafia, 1996). For a more tangible view on what bureaucratic requirements there are Appendix 1 shows a list of possible procedures necessary to register a company collected from different countries.
Djankov et al., (2002) studied the regulation of entry in formal markets more closely. In their study, they pioneered the first attempt to understand and rank the effect of procedural regulations and entrepreneurial entry. They associated weaker entry of companies into the formal market with less democracy and higher corruption, concluding that regulations benefit only the regulators and incumbents. However, the authors did not provide a clear link between types of regulation and new business formation.
Building on Djankov et al., (2002) work in the following years, further authors dedicated their research to the connection between procedural regulations and entrepreneurship. All of them confirmed the positive connection between procedural and bureaucratic deregulation and entry rate of entrepreneurs. Klapper et al., (2006) findings indicated a lower rate of new ventures in (European) countries with high procedural requirements. A similar conclusion was reached by Demirguc-Kunt et al., (2006), who tested at a company level and combined it with explanatory country level variables. As procedural significant factors, the authors identified a developed formal legal system to ensure contract compliance, efficient bankruptcy processes and an incorporation process with fewer bureaucratical steps.
Also, the effects of procedural requirements on the different motivational groups of entrepreneurs were studied. McMullen et al., (2008) showed in their research, that especially formal property protection has a stronger positive effect for opportunity-driven, but not for necessity-driven entrepreneurs. This seems plausible when recalling the findings that only opportunity-driven entrepreneurs have a positive effect on the economy (Acs, 2006). Since necessity-driven entrepreneurs are less likely to formally register their business they cannot take as much advantage of the benefits like legal protection formality permits, just as Soto, (1989) predicted.
Authors across the field agreed on the benefits of procedural deregulation, but also a system which makes it easy for entrepreneurs to claim their legal rights. Necessity-driven and non-registered entrepreneurs pose an exception. Estrin et al., (2013) summarized this effect by relating it more generally to the quality of a countries’ formal institutions – in other words, the locations where bureaucratic or legal protection is enacted. Paradoxically, Aidis et al., (2012) found an inverse relation between entrepreneurial entry and governments’ relative size, which they explained by the inability of these governments to collect and allocate resources properly.
The potential of procedural reduction becomes visible when looking at the World Banks', (2017c) indicators of measuring bureaucracy and procedural requirements. If all 3.1 million new LLC companies in 2012 followed the best practices of the leading economies, they would have saved 45.4 million days of work spent for satisfying bureaucratic requirements. Overall, there is consent in the academic community about the positive impact of the reduction of procedural obstacles, property protection and bureaucracy on the entry of new companies (Ribeiro and Galindo, 2012).
Measures
For measuring procedural requirements different approaches have been used in the literature. The GEM consortium offers among others in their NES (National Expert Survey) data, an indicator for “Government Support and Policy” rated on a Likert scale from 1-56. Together
with the previously mentioned TEA indicator, several studies have used the GEM database to study the impact of procedural measures on the entrepreneurial entry rate (Estrin et al., 2013; McMullen et al., 2008; Schott and Wickstrom Jensen, 2008). However, this indicator has the disadvantage of not being based on tangible measures but surveys, which makes it more prone to biased data. The World Banks’ “Doing Business” dataset uses more tangible measures, such as the number of steps and time necessary to register a business. Klapper and Love, (2012) used these measures to study the effects of procedural reforms on the entry density of new firms, which, like the authors before, revealed a positive relation between time reduction and new entry formation. This dissertation will use the World Banks’ “time to start a business” variable to analyze procedural policy making on entrepreneurship, since it has the benefit of being unbiased and based on the institutional performance of a country. The time an entrepreneur needs to register his business affects him at the point of business registration.
This makes sense in combination with a formal measure like entry density. Nascent entrepreneurs in comparison are not yet affected by such institutional regulations.
2.3.2. Monetary Policies and Regulations
While the term “monetary policies” usually is associated with the macroeconomic influence central institutions take for balancing money supply to control inflation, growth or consumption (Friedman, 1968), this dissertation uses it to describe the influence a government takes on the rate of entrepreneurship e.g. via the allocation of money to entrepreneurs, either by reducing their costs or subsidizing them on a country-wide scale.
In advanced economies getting access to finance is the fourth most pressing concern for SMEs (Small and Medium-sized Enterprises), while in developing countries it is the number one concern (Daniels et al., 2016). Several studies show that the exploitation of entrepreneurial opportunities is more likely for people with less capital constraints (e.g. Evans and Leighton, 1989; Hurst and Lusardi, 2004). This was also shown by the study of a subsidy program in the U.S. where the provision of health insurances to low income families raised self-employment of such families by 20%-30% (Olds, 2014). Similar findings were observed by James (2015) when studying the expansion of a food stamp program where eligible families were 20% more likely to own a business after qualifying for the new program (James, 2015). Both authors concluded, that small improvements to financial security triggered an increased willingness to start a business. However, recently there has been an increase of new start-up financing opportunities on the private market. Besides the established methods of self-funding, regular loans and the notorious 3 Fs “fools, families and friends”, the most commonly used sources are venture capital firms, crowdfunding, angels and accelerators (Bussang, 2014). However, some sectors, such as cutting-edge medicine, agriculture or energy production, are disproportionate risky or have high start-up costs making them rather unattractive for the private market. Besides, there are often finance gaps for small scale entrepreneurs with low ROI (GEM, 2017). Here lies the reason for monetary policy making: bridging the gap to the private market.
A government has three possibilities to influence entrepreneurs via monetary policy making, of which all have been proven to have a positive effect on entrepreneurs: (1) giving access to finance, (2) lowering financial burdens of running operations or (3) lowering the financial barriers of entry. Popular methods for the first category are microfinancing schemes, mutual credit guarantees or interest subsidies (Minniti, 2008; Sabin, 2015). The most common
method for the second category is taxation. Da Rin et al., (2011) observed a positive effect of lower corporate taxes and new venture creation. The third category describes, similar to the procedural obstacles to found a business, the financial capital needed to start a business. The World Bank, (2017c) estimates every 10% decrease on the cost to start a business leads to a 1% increase in entry density of new companies. However, as much as a government can do right with monetary policies directed to entrepreneurs, it is in practice not trivial. Li, (2002) investigated governmental interest subsidies for entrepreneurs and SMEs. It showed a great increase for the targeted income group of entrepreneurs, but due to rising bank rates not-targeted entrepreneurs were worse off, which overall resulted even in lower entrepreneurship rates. Li recommended the allocation of financial programs specifically to poor and capable entrepreneurs to have the biggest impact.
Measures
In the literature, different indicators have been used to study political monetary effects on entrepreneurs. The GEM consortium offers in the NES survey separate indicators on financing and taxation for entrepreneurs (Daniels et al., 2016). Djankov et al., (2002) found high significant effects between costs of business registration (expressed as a percentage of GNI) per capita and entrepreneurial entry. Klapper et al., (2006) used company and industry level data to measure their “reliance on supplier trade financing” while controlling “the ratio of domestic credit to the private sector (scaled by GDP)“ to measure the access to finance on the country level. As a proxy for capital market development, they used the ratio of stock market capitalization to GDP. Klapper and Love, (2012) measured financial barriers to entry more straight forward with minimum capital needed for entry7 and the cost to start a business.
Aidis et al., (2012) simplified this even more by reducing the financial proxy to a dummy distinguishing between capital funding received or not.
Compared to procedural policy making the financial side of promoting entrepreneurship seems less straight forward and it is hard to define a framework for the context and combination of the national idiosyncrasies and policies. Research overall agrees on the benefits of giving entrepreneurs easier access to financial assets complemented ideally with lower tax burdens. Since this dissertation aims to compare procedural and monetary policies,
7 Daniels et al. (2016) note on this: “Low start-up costs in Africa and Latin America & Caribbean are probably a
reflection of the type of ventures started by entrepreneurs. Many of these entrepreneurs are likely to be in the retail/wholesale and services sectors. Barriers to entry into these sectors, in terms of both skills and capital required, are low” (p.82). Therefore, there is a potential bias for the types of businesses started.
it is important to pick indicators which target the same group of entrepreneurs (formal entrepreneurs covered in entry density) and affect them at the same point in time. Therefore, this dissertation will use the World Banks’ “costs to start a business” as variable to measure the effect of monetary policy making on entrepreneurship, since it affects entrepreneurs simultaneously as “time to start a business”. Appendix 2 shows the entrepreneurial process in connection with the different entrepreneurial measures and the effect of time and cost within the process.
2.4. Explanatory Factors for Entrepreneurship
The academic community has dedicated numerous studies to explain the entrepreneurship rate on a country level. While this dissertation focuses on investigating the effect of the amount of time and cost to start a business on entrepreneurship, there are obviously a variety of other important factors influencing entrepreneurship. Researchers acknowledged this and included diverse explanatory variables to reach robust results. However, results are hard to compare not only because of the different dependent variables (described in table 1), but also because of the disunity about which explanatory variables to include. This chapter intents to shed light on the variety of variables used to explain entrepreneurial entry.
Table 2 Aggregated common independent variables to explain entrepreneurial entry
Category Variable Category Variable
Government
Bureaucracy
Finance
Tax
Corruption Minimum Capital for Entry
Regulation Credits
Size of State Development of System
Election Year Unemployment Support
Fragmentation Funding achieved
Governance Social Security
Location of Power
Legal System
Insolvency
Stability Employment
Country
Industries Property Rights
Informality Protection Index
Internet Spread Contract Enforcement
Population Development Level
Economy GDP Effectiveness VC-Investments Individual Data Education Income Gender R&D-Transfer Age
Economic Freedom Experience
FDI Network
Unemployment Rate Previous Business Ownership
Innovation Marital Status
After reviewing the main studies of entrepreneurial entry, (see Appendix 3 for the complete table) distinct categories and variables related to new venture creation were identified. For this, all explanatory variables of the studies were listed and categorized. Since in many cases, researchers used the same variables, but assigned different names (e.g. contract enforcement and legal protection effectiveness), these variables were aggregated to a common name. Table 2 shows the results of this aggregation process. Overall the variables could be grouped into six categories. The variables per category are ranked from the most (top) to the least often (bottom) used per category.
In the “government” category corruption is seen as an important factor that explains the level of new businesses, with studies clearly indicating a negative influence for development of entrepreneurial activities at a procedural (Klapper et al., 2006) as well as monetary level (Da Rin et al., 2011). Djankov et al., (2002) related corruption to higher regulation, which favors the incumbents and regulators. Aidis et al., (2012) show a relationship between the size of the state, corruption and (lower) quality of institutions.
Variables in the “finance” category are often expressed in development indicators (e.g. Demirguc-Kunt et al., 2006; Lerner and Schoar, 2010). In the “Legal System” category, insolvency and employment rights are considered the most important. The more liberal the higher the benefits for entrepreneurial entry (van Stel et al., 2007). Property protection rights have a positive effect on an entrepreneurial community and should be strict and effectively enforced (Estrin et al., 2013).
Variables from the “country” category often serve as control variables, e.g. when statements are tested across industries (Cumming, 2007) or formality (Williams and Nadin, 2012). However, economic indicators are among the most important categories of influencing variables. Almost every study performed on a cross country level controlled for the GDP. Actually, the majority settled on the conclusion, that GDP and entrepreneurial entry is best described by a logarithmic relationship (Aidis et al., 2012; Estrin et al., 2013; Murdock, 2012). Researchers used further variables (like average income, unemployment rates etc.), to measure the level of prosperity in a country. The distinction of developed and developing countries is especially important when measuring opportunity and necessity-driven entrepreneurship, since it shows a strong correlation (Acs, 2006) between higher rates of necessity-driven entrepreneurship in developing countries. It is noteworthy that developing countries must be particularly careful when trying to replicate the success of developed
countries. As Schott and Wickstrom Jensen, (2008) showed, many developing countries that replicated policy making, failed in their purpose due to their unfit for the local cultural and economic situation and the enforcement used to promote entrepreneurship.
Last but not least, individual factors matter. Research at the company or individual level considers the idiosyncrasies of the entrepreneur as a person. Gender, age, network capabilities of the founders, previous business ownership, and cultural factors have been shown to matter significantly to starting a new business (Cancino et al., 2015; Hopp and Stephan, 2012). Education is one of the most impactful individual measures, but often also used at a country level. In most studies, only higher education plays a role as indicator (Aidis et al., 2012; Cancino et al., 2015). This is consistent with the findings of Acs, (2006) and van Stel et al., (2007), that show that mostly entrepreneurs with higher education are opportunity-driven, while for necessity-driven entrepreneurs education is not a significant factor.
2.5. Hypotheses Development
The literature review reflects the essence of the current state of research for governmental levers to promote entrepreneurship. Having established a clear overview of the most important indicators and influencers, in the next section the main research question of this dissertation will be explored: “Should a government focus on procedural or monetary policy making and regulation to promote entrepreneurial entry” or more practically – will entrepreneurship in a country grow more by making it easier or less costly to pursue?” The literature review has shown how the answer to this may vary drastically depending on the circumstances. This means the research question should be broken down into more hypotheses, which together can answer the main question of this research. The hypotheses are framed to be mutually exclusive, but completely exhaust the main research questions. They outline the different contexts the entrepreneurial entry should be tested on, to conclude in the most robust way possible.
The literature review has shown conflicting views between procedural and monetary policies, regarding the magnitude of benefits to increase new venture creating. However, authors like Djankov et al., (2002) or Da Rin et al., (2011) argue for implementations of monetary reforms. Thus:
H1a: Monetary policymaking, measured by “cost to start a business”, has a stronger
impact for incentivizing entrepreneurship, than procedural policy making (ceteris paribus).
Others like Lerner and Schoar, (2010) or Klapper and Love, (2012) recommend to primarily streamline bureaucratic procedures. As Lerner and Schoar conclude quite plausibly in their study, a reduction of procedural burdens can have an automatic impact on costs as well. Thus: H1b: Procedural policymaking, measured by “time to start a business”, has a stronger
impact for incentivizing entrepreneurship than monetary policy making (ceteris paribus).
Daniels et al., (2016) states, that in developing countries access to finance is a far more pressing concern compared to developed countries. We also know that developing countries have a higher share of necessity driven entrepreneurs (GEM, 2017). Since the differentiation of entrepreneurial motivations and their effect on the economy is an impactful concern (Acs, 2006), the second hypothesis will further explore this context. Thus:
H2: Monetary policies have a stronger effect for incentivizing entrepreneurship than
procedural policies, in countries with high necessity driven entrepreneurship rates (ceteris paribus).
While researchers used all kinds of controls for entrepreneurship, none so far tested on the effects of policies for countries, which already substantially lowered cost and time. Can these countries still affect entrepreneurship rates by lowering cost and time to start a business even more? It is intuitive to say that lowering a condition which already is low, cannot create as much of an impact. On the other hand, eventually in countries with a well-developed business environment, the population reacts even stronger to small changes in the regulatory environment. The hypothesis on this topic is according to the intuitive path:
H3: Countries with beneficial pre-conditions in cost to start a business or time to start a
business cannot affect entrepreneurship with new policies as strong as countries with no pre-condition (ceteris paribus).
Acs, (2006) and Sautet, (2013) have shown the different motives and impacts of opportunity as opposed to necessity driven entrepreneurs. Opportunity driven entrepreneurs are said to be more likely to create the desirable effects of staying sustainably in business and employing people, while necessity driven entrepreneurs even have a negative impact on GDP (GEM, 2017). Policies are naturally directed to support only the positive impacts. H4 will help to
H4: Governmental policies (monetary and procedural) have a positive impact on
opportunity driven entrepreneurship, but not necessity driven entrepreneurship (ceteris paribus).
3. Methodology
Following, the sources and structures of available datasets will be explored. The process of data consolidation and variable selection will be outlined. With this information, the models used for answering the hypotheses and their findings can be explained.
There are a few organizations that are making relevant data on entrepreneurial research publicly available today. The most embracing dataset is offered by the World Bank and the Global Entrepreneurship Monitor, but also organizations like the Heritage Foundation, the OECD or the World Economic Forum offer valuable data. Appendix 4 illustrates the variables used and the corresponding sources and definitions.
3.1. Data Sourcing and Consolidation
Established in 2003, the World Bank “Doing Business” (DB) dataset, one of the largest dataset with entrepreneurial relevant data, measures the ease of starting and operating a business in a country over a time span of 13 years. Since the WB continuously seeks to get a better view of the world economy, its initial 133 economies and 5 indicators were progressively expanded and cover now 190 countries and 11 indicators. Obviously, this means in terms of longitudinal data from each country, that the dataset is unbalanced. The indicators measured include: “starting a business, dealing with construction permits, getting electricity, registering property, getting credit, protecting minority investors, paying taxes, trading across borders, enforcing contracts and resolving insolvency” (World Bank, 2017a). Doing Business is a dependable source to measure the effect of policy changes on entrepreneurial development, since it measures the regulatory environments faced by SMEs in the formal sector. These SMEs make up the majority of every entrepreneurship indicator (as opposed to e.g. start-ups issued or bought by multinational companies) and they are the most likely to benefit from regulatory reforms that improve the business environment (Acs et al., 2008). Next to the Doing Business dataset, the World Bank also provides a list of economic indicators such as GDP, income per capita, GNI, unemployment rates or internet penetration. The GEM research was set up in 1997 to investigate different entrepreneurial activities in association with economic growth. By now it embraces individual level ambitions and attitudes towards entrepreneurship (GEM, 2017). Most importantly for research on policy making, it distinguishes between opportunity-driven and necessity-driven entrepreneurship, which is particularly useful for understanding why certain policies might stimulate
entrepreneurship, but cannot contribute to a better economic outcome. Country level data of the GEM surveys is currently only available up to 2013.
Both sources embrace the economic situation, entrepreneurial activities and individual data on the entrepreneur as a person, but miss important information on judicial effectiveness, property rights or corruption. The Heritage Foundations’ index of economic freedom measures these factors, whereas each indicator is put together via a unique formula of different factors. The Index includes 12 variables – from property rights to financial freedom – in 186 countries over the past 20 years. Countries are ranked on a 0-100 scale on each of the 12 indicators, resulting in an overall score of economic freedom (Miller, 2016).
To create a comprehensive dataset, a unique ID for each country and year was created by connecting the name and year and eliminating all spaces or dashes to prevent ambiguous spellings. Following the datasets were merged according to this ID. The consolidation process was more complicated. Each dataset covers a different set of countries and time spans, including variables that were added over time. The GEM dataset covers only between 28 and 40 countries and was left out from analysis for the first iterations. To create the critical amount of data needed for testing the hypotheses significantly, the goal was to remain with a balanced panel of as many countries over the longest consecutive time period with as many variables as possible. To achieve this, the data was trimmed in several iterations to eliminate variables and years with the least amount of observations. This yielded 31 variables from the World Bank, Heritage Foundation and World Economic Forum with complete observations for 75 countries from 2006 to 2013, leaving 600 rows (country year combinations) and 18600 observations overall. The GEM data, however, was more limited. Reducing the data to an unbalanced panel regarding the availability of observations on TEA-OPP and TEA-NEC, the data reduced to 64 countries and 335 data rows. Balancing this panel left only 31 countries from 2006 to 2013 equaling to 248 data rows.
3.2. Measures and Data Structure
Table 1 showed common variables to measure entrepreneurship. The choice of the measurement is likely to affect the significance of the regression analysis. Entry density measures the number of new registered companies in relative terms, which is a lot more objective when comparing countries of different sizes. Surprisingly, entry density and TEA (total early-stage entrepreneurship) are slightly negatively correlated, which was observed by other authors before as well (Acs et al., 2008). They explained this phenomena by
entrepreneurs that never actually register their company, but are included in the GEM survey Controlling correlations for a time lag, TEA-OPP becomes slightly positive correlated, while TEA-NEC is consistently negatively correlated. This indicates a tendency of opportunity driven entrepreneurs to actually register their companies at a later point of time compared to necessity driven entrepreneurs. Therefore, entry density captures entrepreneurs that are more likely to stay in business. There are over twice as many observations on entry density, which increases the accuracy of regression analyses. Therefore, entry density will be used as dependent variable.
The compiled dataset holds one or more variables for each category described in table 2. The table showed a summary of all possible variables, but authors used them in different combinations and with different outcome variables. All together, these variables show multicollinearity. In the first pre-selection, a correlation table was created to identify the most significant variables related to entry density and the strongest “competing” variables among them. Following the common econometric approach (Lu et al., 2017), the variables were tested in a progression of regression models (with entry density as outcome variable) with additional control variables added at each step and by themselves to control for their significance and the effect on R2. To adjust non-linear relation the variables were also tested
in different modes (normal, log-normal, normal – log, log-log) (Wooldridge, 2011). It turned out, almost all variables showed a log-log relationship to entry density, which sorted out eventual normal-distribution issues and heteroscedasticity (Aidis et al., 2012; McMullen et al., 2008). Table 3 gives an overview of correlations between all selected variables.
Table 3 Correlation table
Entry
Density Time Cost Registering Property Getting Credit Profit Tax- Enforcing Contracts- Resolving Insolvency GDP GNI(pc) Entry Density Time -0.35*** Cost -0.58*** 0.55*** Registering Property 0.29*** -0.37*** -0.46*** Getting Credit 0.28*** -0.27*** -0.36*** 0.29*** Profit Tax -0.22*** 0.05 0.10* -0.05 -0.01 Enforcing Contracts 0.47*** -0.50*** -0.63*** 0.43*** 0.27*** -0.04 Resolving Insolvency 0.29*** -0.49*** -0.51*** 0.22*** 0.38*** 0.02 0.39*** GDP -0.14*** -0.21*** -0.29*** 0.09* 0.31*** 0.32*** 0.14*** 0.31*** GNI(pc) 0.49*** -0.41*** -0.65*** 0.30*** 0.27*** -0.06 0.52*** 0.57*** 0.50*** Government Integrity 0.50*** -0.41*** -0.64*** 0.33*** 0.31*** -0.17*** 0.53*** 0.61*** 0.37*** 0.85***
All variables are significantly correlated to the dependent variables entry density. The variables of interest, cost of starting a business (measured in % of income per capita) and time to start a business (measured in days), are negatively correlated, indicating the expected relationship – the higher the cost and time, the lower the entry density. This intuitive finding also applies to profit tax. The negative relation of GDP is not as intuitive, but follows previous findings (McMullen et al., 2008). An explanation is, that the higher level of
development, the less people need to rely on entrepreneurship as a source of income, but rather can enter a well-developed job market. GNI and government integrity still have the biggest issue of multicollinearity, however, all models were tested with and without either one and the results showed that no harm of the predictive quality was caused by keeping both in the model. Previous literature also suggested the importance of both variables (Djankov et al., 2002; Wennekers et al., 2005). Both are positively correlated with entry density (whereas GNI surprisingly opposes GDP).
The influence of GDP shows the different realities of policy making on entrepreneurship according to the development of a country (Acs, 2006). The World Economic Forum provides a “Global Competitiveness Index” of countries, which sorts them into three categories depending on the fulfillment of development criteria. 37,3% of the countries in the sample are innovation-driven, 41,3% efficiency-driven and 21,3% factor-driven. Innovation-driven countries, the highest development category, had the strongest entry density but were the most affected by the 2009 financial crisis. The crisis increased risk averseness of many financial institutions and therefore the access to investments for entrepreneurs. Factor-driven economies, which are the least developed economies showed almost no impact from the recession in comparison. However, innovation driven countries also recovered quickly due to the higher developed financial systems (World Bank, 2010).
As previously mentioned, data with the distinction of opportunity and necessity driven entrepreneurship is limited. H2 (monetary policies have a stronger influence than procedural
policies in countries with high rates of necessity-driven entrepreneurship), would be challenging to test with the current data, since the GEM only measures the actual rates of this Graph 2 Entry density development per country status
Note: Graph 2 shows the evolution of entry density according to the global competitiveness assigned by the WEF (see Appendix 4 for definition).
motivational distinction for between 28 to 40 countries in the time frame. In the sample 90% of the above-average necessity-driven countries are factor and efficiency driven economies. Therefore, efficiency and factor driven economies are a good proxy for high necessity-driven entrepreneurship and can be used
to leverage the full dataset and make results more robust.
H3 looks at countries that may have already begun from a low value in time or cost to start a
business at the beginning of the compiled dataset. These are countries with pre-conditions8 A
country may have preconditions regarding time and cost separately or simultaneously. From the sample half of the countries have at least one pre-condition (and half of these have both). To test H3, countries with at least one pre-condition have been assigned to the pre-condition
dummy. Graph 4 shows the average entry density for the two groups: pre-conditional countries and economic development. It is peculiar how factor-driven economies with pre-conditions have a similar average entry density as innovation driven economies without (p < 0,05 of the according t-test - see Appendix 5, test 1), since graph 2 showed the difference in entry density between factor and
innovation-driven economies. These innovation-driven countries still have a more well-developed economy according to the WEF, which underlines the importance of cost and time to start a business as entrepreneurial driver. However, this could also be explained in reversed causality, since on average it is
the most costly and timely to start a business in factor-driven economies. The following table shows the descriptive statistics of the selected variables.
8 A country is counted as having a pre-condition in time to start a business, when in 2006 they had a value of 20
days or less which makes roughly one third of the countries.
A country is counted as having a pre-condition in cost to start a business, when in 2006 they had a value of 10% or less which makes roughly one third of the countries.
Graph 4 Entry density for countries with pre-conditions by economic development
Graph 3 Quartiles of necessity-driven entrepreneurship per economic development 2,03 3,32 2,55 6,77 3,25 6,37 0 1 2 3 4 5 6 7 8 No Pre-Conditions Pre-Conditions A ve ra ge En tr y D en si ty
Factor-driven Efficiency-driven Innovation-driven 16 3 6 3 54 45 25 18 9 31 48 60 0 10 20 30 40 50 60 70
Highest 25% Highest 50% Highest 75% Highest 100%
# of C ou nt ri es
The data includes a few outliers for the measures of time, cost and entry density. Regarding time and cost Suriname is the biggest irregularity where in 2006 it took 690 days (Z-Score =8 .2) and 161 % (Z-Score = 5.6) of income per capita to start a business. Regarding entry density, New Zealand and Panama have Z-Scores above 4. While the entry density of New Zealand is explained by its excellent conditions for starting a business (first place on the World Banks’ ranking for Doing Business and among others also first in cost of starting a business with 0,2 % of cost per capita income). Panama only ranks on place 70. The high entry density of Panama could be explained by the publication of the the Panama Papers, (2016) when Panama became known as a tax heaven. An extreme example of this effect can be observed for the Virgin Islands (not included in the sample), where entry density of new companies between 2002 and 2009 was between 4300 and 2600, at least 28 times higher compared to the next highest value.
Note: The average time to start a business is 25,4 days and the average cost are 80,3 % of pc income. Precondition_Time, Precondition_Cost, Precondition_Both are self-constructed dummy variables stating whether a country belongs to the lowest third in time, cost or both for the year 2006. Around 25% of all countries have pre-conditions in both. No_Precondition is the flipped dummy for Preconditions_Both to allow a more intuitive interpretation of regression results. Only_Time, Only_Cost, No_Treatment, denotes the regulatory performance for time and cost over the whole time period in reference to 2006. Both includes countries, which reduced either time or cost or both. Only 17,3% of all countries did improve neither time nor cost. High_Necessity reports factor-driven and efficiency driven countries (see Appendix 4 global competitiveness) and is used as a proxy for countries with above-average necessity-driven entrepreneurship rates.
The panel shows negative serial correlation (p < 0,1; Appendix 5, test 7). This is not unusual, since regional shocks (such as the financial crisis) have lasting effects not only on one year but also the years after (Wooldridge, 2011). However, negative serial correlation may not affect standard errors as severely. An effective way to deal with this, is to cluster standard errors on country level (Angrist and Pischke, 2009).
4. Empirical Evaluation
Due to strong year effects like the financial crisis and national idiosyncrasies, we controlled for time and country fixed effects. As precedentially used by many researchers in policy analysis (Wolfers, 2003) “fixed effects” is an established method for analyzing the effect of policy changes. “The fixed-effects model controls for all time-invariant differences between the individuals, so the estimated coefficients of the fixed-effects models cannot be biased because of omitted time-invariant characteristics...[like culture, religion, gender, race, etc]” (Torres-Reyna, 2007 p.9)
Graph 5 Impact of isolated policy-changes
Note: In a first approach to analyze the isolated impact of single policy treatments, the countries were split into categories based on their regulatory behavior over the whole sample period for their reduction in time and cost to start a business. Graph 3 shows the performance regarding entry density of the four resulting categories over time. Countries in the category “no treatment” (therefore no changes in cost or time to start a business) are represented on the secondary axis (right). All other categories are displayed on the primary Y axis (left) in reference (difference) to the “no treatment” category. Countries without treatment dropped slightly in entry density across the sample period. Countries that improved time or time and cost rose stronger in entry density, while countries that only improved time performed worse compared to the “no-treatment” category. An improvement was considered, when a country reduced the time or cost by at least 20% compared to the base value in 2006. There is no risk of bias in the sample from countries that eventually improved and degraded conditions again. All countries either performed treatments or did not