58
Understanding the Visual Communication of Science and
Technology in Translation: Initial Results of an E-survey
Marta Pacheco Pinto
Centre for Comparative Studies,
Faculdade de Letras, Universidade de Lisboa
Lisbon, Portugal
[email protected]
Joana Moura
State University of New York, Stony Brook;
Centre for Comparative Studies,
Faculdade de Letras, Universidade de Lisboa
New York, USA; Lisbon, Portugal
[email protected]
Rosário Durão
Department of Communication, Liberal Arts, Social Sciences,
New Mexico Institute of Mining and Technology
Socorro, USA
[email protected]
ABSTRACT
Visuals hold a prominent position in the communication of science and technology (S&T), helping scientists and engineers conceptualize ideas, understand the ideas of others, and present them publicly. But creating and understanding visuals depends on learned cultural experiences. Also, visuals are “constructed” objects shaped by processes of selection, idealized visions of representation, truth and objectivity, ethical values, power and gender, technology, among other factors. This constructedness questions the ability of S&T visuals to transcend language, disciplinary, professional, national, and other differences. We address this issue in the VISTAC – Science and Technology Visuals in Translation, or “VISTAC in Translation”, study and the Visualizing Science and Technology across Cultures (VISTAC) pilot study that led to it. The pilot study results showed that people visually portray S&T concepts differently for audiences from different cultures and nationalities. This brings up the question of what happens to visuals when S&T documentation is translated. The VISTAC in Translation study, a two-stage e-survey-based study, was developed to answer this question. Specifically, it seeks to understand how translators, translation companies, and publishers perceive the importance of translating visuals in S&T documentation, as well as the procedures they follow when preparing S&T documents for translation. This article describes the research methodology of the first-stage survey and the e-survey itself: the data collection method, e-e-survey questions, and dissemination strategies. It also presents and discusses a partial set of results, and succinctly relates these findings to the forthcoming second-stage e-survey.
59 Keywords: visuals, science, technology, translation, communication
1. Introduction
Visuals are communicative events that can be an object of inquiry in their own right. According to Merriam Webster1, a visual is “something (as a graphic) that appeals to the sight and is used for effect or illustration – usually used in plural”
(our emphasis). As a multimodal form of communication often, but not necessarily, grounded in two semiotic codes (text and image), visuals hold a prominent position in the communication of science and technology (S&T). They help scientists and engineers think through and conceptualize ideas, understand the ideas of others, present them publicly, and support their arguments (Ferguson, 1977; Rowley-Jolivet, 2000; Hutto, 2007). Visuals increase the intelligibility of data (Burri & Dumit, 2007) and text comprehension by displaying information and data in the most diverse visual configurations, from tables and graphs to diagrams, trees, maps, images, drawings, photographs, screenshots, videos, or computer visualizations (Burri & Dumit, 2007).
Visuals can precede the verbal text, in which case they help compose and constrain the text, they can support or add to the verbal message, thus serving an emphatic function, they can take the place of verbal text, which can be inserted in the visual itself and/or serve to identify it, or they can be fully autonomous entities. Whatever the situation, visuals have a strong impact on readers because, as Donna S. Kienzler (1997) puts it, (1) visuals have an emotional impact that linear words tend to lack; (2) visuals are more easily spotted without having to read the text; and (3) readers remember visuals longer, that is, visuals are attached to a visual memory that lasts longer than words.
In the visual-verbal relation, another important factor is that visuals tend to attach authoritativeness to the verbal message. For example, from the seventeenth through the nineteenth centuries, comprehensive histories of geographical knowledge would gain in credibility if they included pictures resulting from empirical observation. German physician Engelbert Kaempfer’s History of Japan (1727) was a best-seller from the moment it was published, much in view of the maps he created of Japan based on his first-hand experience. According to William Shang, they are “perhaps one of the most reliable source materials of the era [...], and his maps were inserted in the publication [History of Japan], which gave it added credibility” (2007: 112). The Industrial Revolution caused S&T to develop rapidly. With the ensuing advances in print, photography and communication technologies, the use of visuals has grown exponentially since then.
Visuals have, in fact, become ubiquitous in the production and communication of S&T, globally. This also holds true for academia, where visuals are a vital part of researchers’ activities, both as aids to disseminating research and even when applying for grants. Burri and Dumit reported that ‘[m]any scientists complain about the unfairness of having to compete for grants or public support against “cool-looking projects” (Turkle et al., 2005)’ (Burri & Dumit, 2007: 305). As an
60
example, in the calls for proposals within the European framework program for research and innovation Horizon 2020, candidates were advised to include graphical presentations of the components described in their work plan2. Indeed, visuals are increasingly becoming a commodity of research communication (presentation, support, and publication) with hardly any paper, poster, or conference presentation nowadays doing without a visual support of some kind.
Using visuals to communicate is not, however, a simple task of image selection and paste. Although the so-called global/universal approach to visual communication posits that images can be made accessible to disparate audiences based on the idea of universality “certified by perceptual psychology” (Kostelnick, 1995: 184), i.e. “the perceptual capabilities of the eye and brain” (ibid.: 184), creating and understanding visuals depends on learned cultural experiences (Kostelnick, 1995); visuals are constructed objects shaped by processes of selection, idealized visions of representation, truth and objectivity, ethical values, power and gender, technology, among other factors (Daston & Galison, 1992; Kienzler, 1997; Pasveer, 2006; Olohan, 2016). Studies from the field of professional communication, such as Qiuye’s (2000) analysis of how visual depictions of the cloning of Dolly the sheep, in 1997, differed in popular science magazines from China and the US, highlight such issues. But these socioculturally-oriented selection practices and constructions that reconcile sign, information, tools, actions, and value question the assumed universal nature and comprehensibility of S&T visuals; that is, their ability to transcend language, cultural, disciplinary, professional, national, and other differences. This means that these issues need to be carefully addressed and pondered when preparing and translating S&T documentation.
In this article, we address these translation-impacting issues by describing the Visualizing Science and Technology across Cultures (VISTAC) research project, namely one of its branch projects, the VISTAC – Science and Technology Visuals in Translation study (henceforth, “VISTAC in Translation”), and, briefly, the VISTAC pilot study that led to it. The VISTAC in Translation study was sparked by the awareness that only a handful of studies on S&T visuals seek to understand what happens to visuals when crossing language barriers (e.g., Ketola, 2015; Tercedor-Sánchez & Abadía-Molina, 2005). The project addresses this discrepancy through a two-stage e-survey-based study conducted with translators, translation agencies, and publishers working with documentation written in the top 10 Internet languages at the start of the project: English, Chinese, Spanish, Japanese, Portuguese, German, Arabic, French, Russian, and Korean. The study consists of (a) a first-stage e-survey to understand the overall practices of these professionals in the translation of S&T visuals, and (b) a second-stage follow-up e-survey.
The present article reports a partial set of results of the first e-survey, i.e., the results collected from early September, when the e-survey was announced, to October 20, 2015. It describes the VISTAC pilot study and the ensuing VISTAC in Translation study, as well as the research methodology of the first-stage e-survey and the e-survey itself: the data collection method, e-survey questions, and
2 Cf. http://ec.europa.eu/research/participants/data/ref/h2020/other/call_ptef/pt/h2020-call-pt-bbi-ria-ia_en.pdf
61
dissemination strategies. It then presents and discusses the partial set of results, and succinctly relates these findings to the second-stage e-survey.
2. VISTAC pilot study (case study 1)
In 2013, a pilot study was conducted at the New Mexico Institute of Mining and Technology, in the US, to understand whether people from different cultures visually portray S&T differently. Specifically, the study proposed to evaluate (a) whether S&T students designed a given science or technology concept differently for people from two different countries; and (b) whether the variations found were associated with culture-specific factors. The study comprised a pre-test questionnaire, a test, and a post-test questionnaire. Five participants were involved in the study, three graduate and two undergraduate students.
In the pre-test questionnaire, participants were mainly asked to provide information about the countries where they had lived before and for how long they had lived there. The test asked them to “localize” an S&T concept (either the food chain or a hydraulic system) by translating it into visual representations for two different target audiences: senior-level high-school students based in the US and in other countries where the participants had lived in for over a year. To put it differently, participants were asked to turn mental representations of acquired concepts into external representations shaped in a visually identifiable format.3 In the post-test questionnaire, participants were asked to reflect and comment upon their conscious and unconscious representation strategies, which largely revealed their connection to sociocultural factors and the participants’ own visual translation processes.
While the study sample was small and the answers provided were not conclusive enough for us to understand what different audiences require to be able to understand an S&T concept, the researchers interpreted the results as supporting the theoretical underpinning of the study, i.e., that people visually portray S&T concepts differently for audiences from different cultures and nationalities (Durão, Pinto, Henneke & Balch, 2014). This interpretation is in line with Burri and Dumit’s stating that “[e]thnographic research on visual practices suggests there is very little about seeing, drawing, framing, imaging, and imagining that can be assumed to be the same across cultures” (2007: 308).
Building on this, we contended that (a) people from different parts of the world, irrespective of whether they share or not the same language code, conceptualize and look at things differently, and (b) cultural differences require people to adapt visual content to the context where it will circulate, regardless of whether the language used in the context of reception differs from the language of the context of production.
3 Following Jakobson’s notion of intersemiotic translation (2014 [1959]), we
62 3. VISTAC – Science and Technology Visuals in Translation e-survey
(ongoing case study 2)
Holding that differences in visual representation originate in an act of sociocultural and visual translation raises two questions: (1) What happens to visuals when S&T documentation gets translated? and (2) How do translation agents perceive and deal with the text-image interface?
Maeve Olohan recently (2016) noted that translators sometimes underestimate the role of visuals:
The use of diagrams and other forms of images may be carefully considered by technical writers and document designers at the time of authoring, but on many occasions it is assumed by clients and others that translated texts can simply reuse the same images. Sometimes this is unproblematic, but translators and clients should also be aware of the potential for cultural specificity and of the necessity to make judgments about cultural appropriateness, extending also to use of specific colours, for instance [...].
(Olohan, 2016: 55)
This brings up a number of questions, among which: Might the implicit assumption of the written word’s supremacy happen because of time restrictions imposed on translators, because translation professionals lack the tools to edit the source visuals? Are translations sometimes commissioned with a set of specific instructions not to translate images? And do our educational systems and the intellectual communities’ favoring the word over the image influence people’s attitudes towards visuals in translation (Amare & Manning, 2007)?4
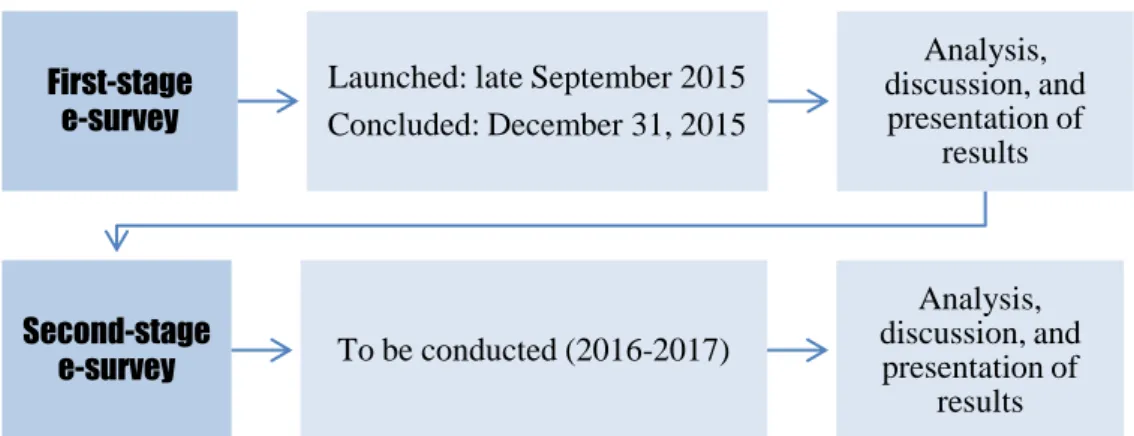
These questions, together with the findings of the VISTAC pilot study and an analysis of the scant literature on the translation and localization of S&T visuals, prompted us to develop the VISTAC in Translation study. We divided the study into two stages (cf. Figure 1):
Figure 1. VISTAC in Translation study: Project development map
4
Amare and Manning showcase Roland Barthes in “Rhétorique de l’image” [Rhetoric of the image] (1964) as part of the scholars who “traditionally have described visuals as dependent and subordinate to written text” (2007: 58).
First-stage e-survey
Launched: late September 2015 Concluded: December 31, 2015 Analysis, discussion, and presentation of results Second-stage e-survey To be conducted (2016-2017) Analysis, discussion, and presentation of results
63
The first-stage e-survey, which we have already conducted, was designed to assess the general habits of translation professionals and their perceptions of the translation of S&T visuals. For the sake of clarity, our working definition of “visuals” and “translation of visuals” was provided to respondents in an early stage of the e-survey process (cf. Figure 2).
Figure 2. “Visuals” and “Translation of visuals”: Working definitions (screenshot from the first-stage e-survey)
More specifically, the first-stage e-survey aimed to answer two research questions linked to translation professionals’ competence and performance (Toury, 1995):
What are translation professionals’ perceptions about the importance of translating visuals in S&T documentation?
What are translation professionals’ practices when preparing S&T documentation for translation?
The e-survey, which ensures the study’s potentially global outreach, was provided in the top 10 Internet languages to reach as many people as possible, thus challenging the growing tendency in academic circles towards English monolingualism. The second-stage e-survey, to be conducted, will derive from the results of this first-stage e-survey. It will elicit more practice-focused and socioculturally-oriented data. We expect this unique study to impact awareness and professional practices of translation professionals, programs and pedagogies, as well as international professional communication, research and publishing in these fields. In their introduction to the special issue of The Translator on “Translating Science”, Olohan and Salama-Carr emphasize that “[t]ranslation studies, with its recent shift towards sociologically inspired research, has also become more receptive to studies of scientific translation which recognize the contingency of knowledge, the complexities involved in its communication and circulation, and how it is shaped and reshaped in and through translation” (Olohan and Salama-Carr, 2011: 181-182). The VISTAC in Translation study seeks to be a contribution to this underrepresented area of research of scientific and also technological translation through a critical sociocultural lens.
As mentioned previously, the current article focuses on the first-stage e-survey. Targeting translators, translation companies, and publishers, the e-survey was made available online in English, Chinese, Spanish, Japanese, Portuguese, German, Arabic, French, Russian, and Korean.5 The questionnaire was prepared in English,
5 Cf. InternetWorldStats.com. In 2015, Korean was replaced with Malay in the top 10 languages most used by Internet users.
64
which functioned as the pivot language, and translated into the other nine Internet languages by our co-investigators, a multilingual team of university professors and researchers that the core team recruited via an online call for research collaborators.6
The e-survey was disseminated through public announcements, via translators, publishers, technical communicators, professional associations (of translators, technical communicators, and publishers), international translation companies, LISTSERVs, translation directories (e.g., Proz), and social networks (e.g., LinkedIn). The e-survey was made available on FluidSurveys from late September until December 31, 2015. For every completed response, FluidSurveys kept a copy and sent another to the researchers. The researchers then destroyed the copy on FluidSurveys and kept their copy on their password-protected computers.
The e-survey consisted of a consent form, a glossary of the questionnaire’s key terms (cf. Appendix 1), and a questionnaire. The questionnaire first asked the respondents to choose a profile, that of translator, translation company, or publisher. It followed with three sections: pre-test, test, and post-test questions (cf. Appendices 2-6). All the questions referred to a six-year time frame, from 2009 to 2015, the year the study was conducted. The pre-test questions gathered information about the countries the respondents had lived in, and the languages and volume of translations of S&T documentation performed. The test questions collected data on the volume of translation of visuals in S&T documentation. Participants were also inquired about their perceptions of the relevance, presence, or absence of visuals in the documentation received and/or sent out for translation, as well as their perceptions of the quality of the translations when accompanied by visuals. The post-test questions queried whether the e-survey had altered the participants’ perceptions regarding the translating of visuals in S&T documentation, and provided them with a box for comments.
If the respondent was a translator, s/he answered seven pre-test questions about their general professional profile and the volume of S&T translation performed in the six-year span (cf. Appendix 2). S/he then answered the eight questions of the test section, which sought to measure the respondents’ perceptions (or competence) and actual practice (or performance) concerning the translation of visuals (cf. Appendix 3). The pre-test questions were similar for all three profiles, but the test questions were modified to account for the agents that commission translations and work directly with translators: translation company and publishing house (cf. Appendices 4 and 5). The post-test questions were the same for all three profiles (cf. Appendix 6).
4. Initial first-stage e-survey results
This article reports on the 30 responses received until October 20, 2015. The full set of responses will be reported and examined in a forthcoming article. Of the 30 respondents, 15 (50 %) answered the questionnaire in English, 10 (33.3 %) answered it in Portuguese, three (10 %) in German, one (3.3 %) in Spanish, and
6 This team is listed at the project’s website: http://act.nmt.edu/humanizingtechnology/ vistac/translation/
65
one (3.3 %) in Chinese. Out of the 30 responses, two (6.7 %) were from translation companies, one (3.3 %) from a publisher, and 27 (90 %) from translators. On the whole, English stands out as the professionals’ main source language of translation. One of the translation companies operates in Bulgaria and Germany; the other has offices set up in Australia, the US, France, Canada, Denmark, Spain, Norway, Switzerland, and China. As for the publishing house, it is only based in the US.
Regarding the amount of S&T translations and those containing visuals, 25 translators (92.6 % of the translators) reported that, on average, 48.2 % of their translation work consisted of science translation, and that 31.5 % of this contained visuals. 26 translators (96.3 % of the translators) reported that, on average, 51.7 % of their translation work consisted of technology translation, and that 37 % of this contained visuals.7
Concerning the importance of translating visuals in S&T documentation, all the respondents said it was important, although to different extents (from extremely important to moderately important). However, when asked whether the inclusion of S&T visuals in the documentation helped improve the overall quality of the translations, 25 respondents (83.3 %), including the publishing company, said it did, and four respondents (13.3 %) said it did not.8 In response to a related question, six translators (22.2 % of the 27 translators’ responses) said they never received instructions for translating the S&T visuals together with the translations, against 21 translators (77.7 %) who stated that, on average, 24.1 % of the translations came with this type of instructions.9
Regarding the need to update visuals to account for the passing of time, 25 respondents (83.3 %) agreed that it is important to do so, against five respondents (16.6 %) who did not find this necessary.
In answer to the post-test question about whether the e-survey had changed their perception of the translation of visuals in S&T documentation, two translation companies and 26 translators (that is, 28 respondents, or 93.3 %, of all respondents), declared that the e-survey had not brought about any change. Of the respondents (one publisher and one translator) who said the e-survey did change their perceptions, one actually stated added that “[m]y company publishes complex work reporting on big data analyses and public health policy, which I edit and publish for dissemination to target audiences of various backgrounds. I will now have a hurt head awareness of this factor in performing my role, thus improving our outreach efforts.”
7 We received one response containing contradictions and excluded it from the pool of valid responses: a translator declared that the volume of science translation work s/he had done was 0 %, yet later in the questionnaire the same respondent said the volume of visuals in the science documents s/he had translated was around 4 %.
8 Here we also received one contradictory response and excluded it from the pool of valid responses: a translation company stated that the inclusion of S&T visuals in the documentation did not improve the overall quality of the translations, yet rated the inclusion of visuals as having improved the overall quality of the translations “a great deal”.
9 It is worth noting here that the translation company referred to in the previous note claims to have accompanied the S&T documents sent to translators together with instructions for the translation of the visuals in 63 % of the cases, a statement that contrasts greatly with the translators’ responses.
66 5. Discussion
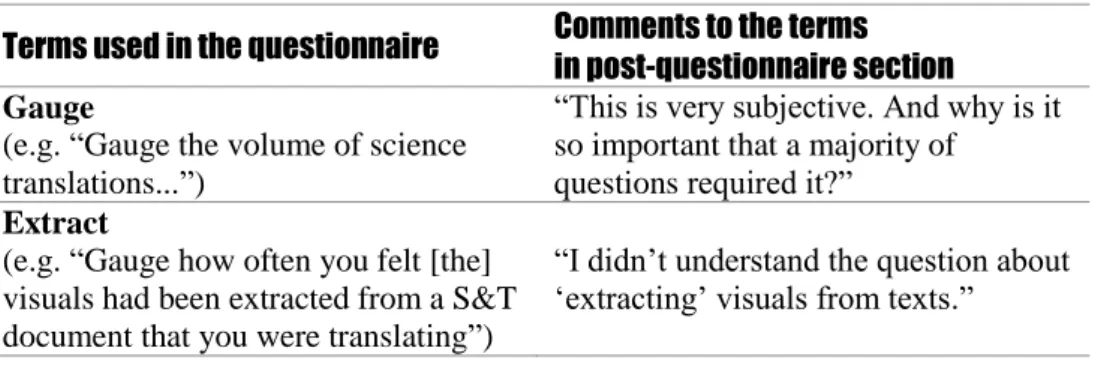
Regarding the e-survey itself, two respondents remarked having trouble understanding terms such as “gauge” or “extract” (cf. Figure 3).
Terms used in the questionnaire Comments to the terms in post-questionnaire section
Gauge
(e.g. “Gauge the volume of science translations...”)
“This is very subjective. And why is it so important that a majority of
questions required it?”
Extract
(e.g. “Gauge how often you felt [the] visuals had been extracted from a S&T document that you were translating”)
“I didn’t understand the question about ‘extracting’ visuals from texts.”
Figure 3. Lexical difficulties posed by the questionnaire as reported by respondents One respondent complained that the “survey is rather frustrating” due to the amount of quantitative responses that is requested, and the other asked “Why didn’t the survey cover the question of HOW the visuals were translated (e.g. replace source-language wording if visual is clickable; add legend [sic] below visual if visual is not clickable; recreate visual)?”, actually anticipating the next stage of the VISTAC in Translation study, which will prioritize localization strategies and processes. We will account for these comments in the second-stage e-survey.
As far as the languages of the e-survey are concerned, half of the respondents answered it in English. We interpret this as resulting from the respondents not being native speakers of any of the 10 languages available, although it may also be because of the role of English as the global lingua franca and of its omnipresence in the translation world (e.g. Bennett, 2013). Equally indicative of a strong connection between translation and the power issues of globalization (e.g. Apter, 2001; Cronin, 2003) is the fact that translation companies operate in two or more high-profile countries. Also significant is that the publishing house only has offices in the US. In addition to reinforcing the ascendancy of English and the concern with globalization overriding multicultural diversity, this aligns with previous work on the dominance of English in S&T (Heilbron, 1999; Kaplan, 2001; Medina, Marques, & Holmes, 2014; Montgomery, 2000).
The responses place the amount of translation of both science and technology at about half of the translators’ workload, and the amount of visuals in those translations at about a third of the translations. These results elicit two comments. First, the distinction between science translation and technology translation can be fuzzy because documents sometimes conflate both subject matters. If this factored into the respondents’ answers, it would mean that the actual percentages can be either higher or lower than the ones the translators reported. This is something we will need to account for when preparing the second-stage e-survey. Second, the percentages of visuals reported may be interpreted as low if we consider that S&T documentation is seldom published without visual aids of some kind (e.g., Lemke, 1998). However, the reported percentages may also (a) denote that some of the translators translate mostly low-visual documentation, like laboratory reports,
67
specifications, or non-graphical abstracts, and (b) attest to the pre-translation processing practice of removing visual elements from S&T documents before sending them out to the translators.
The fact that all the responses indicated it was important to translate S&T visuals is in line with the responses stating that the presence of images enhanced the overall quality of translations and, implicitly, of text comprehension. But they appear to be at odds with the 13.3 % of respondents who said images did not improve the quality of translation. We interpret this disparity as a cue to investigate the topic more thoroughly in the second-stage e-survey.
The responses to whether translators received instructions for translating S&T visuals evince a low awareness of the specificities of S&T images and the sociocultural implications of translating them. Instead, they reveal a widespread view of S&T images as immutable, acultural elements that would neither need nor lend themselves to translation, nor to any kind of post-editing.
As to the question of whether S&T visuals should be updated to account for the passing of time, the answers indicate two divergent approaches. The five responses stating it was not necessary to update visuals, that is, that they do not need to be temporally and spatially reframed, point to notions of “culture” and “target audience” as stagnant and homogeneous categories. The responses (83.3 %) that stated otherwise point to an understanding of culture, norms, and expectations about translation and its function as evolving in time and space, and to the majority of translation professionals as taking an active role when dealing with sociocultural specificities and appropriateness.
The large number of respondents affirming that the e-survey did not change how they perceived the translation of visuals in S&T documentation did not meet our assumptions. It may indicate that only those professionals who were already aware of the importance of translating visuals took the e-survey. Conversely, it may also suggest that, given the diversity of questions in the e-survey, a different type of question, i.e., not a polar question, would have been more appropriate for the last section of the e-survey. Further, if the professionals’ perceptions did not change, it is possible that (a) our working hypothesis, which is sustained in Olohan’s work (2016), did not correspond to the experience of practitioners, or (b) our hypothesis does not correspond to the professionals’ perceptions (i.e. competence) because their professional practices (i.e. performance) might differ from the respondents’ perceptions of them. On a positive note, we find the publisher’s comment quoted in section 4, where the respondent acknowledges a change of perception, significant in two ways: it indicates that (a) what is possibly a minority of translation professionals who are not fully aware that visuals in S&T documentation needs to be translated would benefit from being made aware of it, and (b) once exposed to it, they quickly grasp the importance of translating S&T visuals.
6. Concluding remarks and future research
We conducted a first-stage e-survey to help us understand (a) the attitude of translation professionals towards the importance of translating visuals in S&T
68
documentation and (b) their practices when preparing S&T documentation for translation. The first set of results provides some insights into the world of S&T translation and about the e-survey itself.
Regarding the e-survey, the results suggest introducing the use of plainer words in the second-stage e-survey; asking more qualitative questions; avoiding polar questions; asking more probing questions about the pre-translation, translation, and post-translation practices; asking more open-ended questions where the respondents can describe their S&T visual translation practices and provide reasons for why they believe the presence of visuals contributed or did not contribute to a better translation; including further sociographic and demographic questions about, for example, their native language(s); asking what S&T document genres they translate or send out for translation, and the types and average number of visuals in each of them. In sum, the second-stage e-survey should ask more probing questions and provide the respondents with more opportunities to elaborate on their responses.
As for insights into the world of translating S&T visuals, the responses present a somewhat worrying trend towards a view of S&T visuals as isolated entities and of their translation as nonsignificant. While this may be connected to popular views of S&T as being identical across the world, it may also result from an absence of training in the translating of S&T visuals within (technical and scientific) translation courses, as well as of the application of less dynamic verbal translation theories and methodologies to the translation of S&T visuals. It may also be related to most translators’ essentially verbal-based skills and experience. Because the results we are reporting are interim and because of the relatively limited response rate, we take these insights more as cues for the second-stage e-survey than as data for conclusive sociocultural interpretations.
The second-stage e-survey will thus be based on a full analysis of the data collected in the first e-survey; that is, all the responses received from late September until the end of December 2015. The second e-survey will account for more formal issues, such as translators’ training and experience in S&T translation, the genres translated (e.g. research articles, school textbooks, reports, conference papers, paper abstracts, manuals, etc.), and the professionals’ areas of translation expertise (e.g. public health, civil engineering, electronics and electrical engineering, energy industries, etc.). It will also contain sociocultural questions regarding, for instance, whether the professionals ever suggested changing the color of a graph, changing the presentation of numerical data in a table, replacing an image fully with text or with another image that is more relatable to the target audience, or adding a caption to make an image more legible or appealing. Furthermore, the e-survey will ask respondents to provide examples of strategies and difficulties in the translation of S&T visuals, as well as other questions emerging from the full analysis of the first e-survey.
In summary, our main focus here has been the translation of S&T texts that make use of two semiotic connected dimensions: text and image. Literacy cannot be, as Jay Lemke argues, “limited to text or language in its narrowest sense” (2004: 1). Therefore, S&T documentation requires and tests multiple literacies (Lemke, 2004), involving various practices of looking, which are also informed by different cultural contexts, experiences, worldviews, and backgrounds. These practices
69
require specific competences that include the acquisition, training, and mastery of visual communication. Such competences are permanently tested when it comes to translating S&T documentation. As Isabel Capeloa Gil (2011: 12) notes, our increasingly visual contemporary world requires the development of a new literacy that can help us grasp the diversity of the existing visual systems – from photography to painting, from cinema to the digital image and, we add, to S&T visuals. According to Burri and Dumit (2007: 302), “[v]isual expertise also creates its own form of literacy and specialization”, hence visuals are “forms of visual literacy required to create shared meanings” (2007: 303), and are part of a wider category of scientific literacy, or what Lemke calls “multimodal literacy in science” (2004: 5). In our contribution to the translation of multimodal texts through the VISTAC research project and to multimodal literacy, the most interesting results are yet to come.
Acknowledgements
The authors thank all the members of the VISTAC – Science and Technology Visuals in Translation project for their contribution to the translation and dissemination of the surveys: Stavros Asimakopoulos (Open University, UK); Tatiana Batova (Arizona State University, US); Giuseppina Di Gregorio (University of Catania and the University of Enna “Kore”, Italy); Nabil El Hilali (ESCA Business School of Management, Morocco); Hanaa Hachimi (Ibn Tofail University, Morocco); Kyung-Hye Kim (Shanghai Jiao Tong University, China); Ricardo López-León (Autonomous University of Aguascalientes, Mexico); Nasser Mansour (Exeter University, UK); Maya Ninova (Universitat Autònoma de Barcelona, Spain); Anastasia Parianou (Ionian University, Greece); Lyudmila Razumova (independent researcher); Debopriyo Roy (University of Aizu, Japan); Takako Yasuta (University of Aizu, Japan); Tie Wei (New Mexico Tech, US); Zhou Wenjie (University of Wisconsin Stout).
References
Amare, N., & Manning, A. (2007). The language of visuals: Text + graphics = visual rhetoric. Tutorial. IEEE Transactions on Professional Communication, 50(1), 57–70.
Apter, E. (Ed.) (2001). Public Culture. Translation in a Global Market, 13(1). Bennett, K. (2013). English as a Lingua Franca in Academia: Combating
Epistemicide through Translator Training. The Interpreter and Translator
Trainer, 7(2), 169–193. DOI:http://dx.doi.org/10.1080/13556509.2013.
10798850
Burri, R. V., & Dumit, J. (2007). Social studies of scientific imaging and visualization. In J. Hackett, O. Amsterdamska, M. E. Lynch, & J. Wajcman (Eds.), The handbook of Science and Technology Studies, 297–317. Cambridge, MA: MIT Press.
Cronin, M. (2003). Translation and Globalization. London & New York: Routledge.
70
Daston, L., & Galison, P. (1992). The image of objectivity. Seeing Science, 40, 81– 128.
Durão, R., Pinto, M. P., Henneke, K., & Balch, K. M. (2014) Visualizing science and technology across cultures: Results of a pilot study. Information Design
Journal, 21(2), 99–114.
Ferguson, E. S. (1977). The mind’s eye: Nonverbal thought in technology. Science,
197(4306), 827–836.
Gil, Isabel C. (2011). Literacia visual: estudos sobre a inquietude das imagens. Lisbon: Edições 70.
Heilbron, J. (1999). Towards a sociology of translation. Book translations as a cultural world-system. European Journal of Social Theory, 2(4), 429–444. Horizon 2020 European Union Funding for Research & Innovation. Bio-based
Industries. Public-Private Partnership. Retrieved September 5, 2015, from http://ec.europa.eu/research/participants/data/ref/h2020/other/call_ptef/pt/h2 020-call-pt-bbi-ria-ia_en.pdf
Hutto, D. (2007). Graphics and invention in engineering writing. Technical
Communication, 54(1), 88–98.
InternetWorldStats.com [2010]. Retrieved May 28, 2014, from http://internetworldstats.com/stats7.htm
Jakobson, R. (2004 [1959]). On linguistic aspects of translation. In L. Venuti (Ed.),
The Translation Studies reader, 138–143. 2nd ed. London & New York: Routledge.
Kaplan, R. B. (2001). English – the accidental language of sciences? In U. Ammon (Ed.), The dominance of English as a language of science: Effects on other
languages and language communities, 3–26. Berlin: Mouton de Gruyter.
Ketola, Anne. (2015). Translation diaries of an illustrated technical text. Translation students’ conceptions of word-image interaction. Connexions.
International Professional Communication Journal, 3(2), 13–40. Retrieved
March 16, 2016, from
https://connexionsj.files.wordpress.com/2016/02/ketola.pdf
Kienzler, D. S. (1997). Visual ethics. Journal of Business Communication, 34(2), 171–187. DOI:10.1177/002194369703400204
Kostelnick, C. (1995). Cultural adaptation and information design: Two contrasting views. IEEE Transactions on Professional Communication, 38(4), 182–196. Lemke, J. (2004). The literacies of science. In E. W. Saul (Ed.), Crossing borders
in literacy and science instruction: Perspectives on theory and practice, 33–
47. Newark: International Reading Association.
Lemke, J. (1998). Multiplying meaning: Visual and verbal semiotics in scientific text. In J. R. Martin & R. Veel (Eds.), Reading science, 87–113. London: Routledge.
Medina, E., Marques, I. C., & Holmes, C. (2014). Introduction: Beyond imported magic. In E. Medina, I. C. Marques, and C. Holmes (Eds.), Beyond imported
magic: Essays on science, technology, and society in Latin America, 1–23.
Cambridge, MA, and London, England: The MIT Press.
Montgomery, S. (2000). Science in translation: Movements of knowledge through
cultures and time. Chicago: The University of Chicago Press.
Olohan, M. (2016). Scientific and technical translation. London: Routledge. Olohan, M., & Salama-Carr, M. (2011). Translating Science. The Translator,
17(2), 179–188. DOI: 10.1080/13556509.2011.10799485
Pasveer, B. (2006). Representing or mediating: A history and philosophy of X-Ray images in medicine. In L. Pauwels (Ed.), Visual cultures of science:
71
Rethinking representational practices in knowledge building and science communication, 41–62. Lebanon, NH: University Press of New England.
Qiuye, W. (2000). A cross-cultural comparison of the use of graphics in scientific and technical communication. Technical Communication, 47(4), 553–560. Rosner, M. (2001). Theories of visual rhetoric: Looking at the human genome.
Journal of Technical Writing and Communication, 31(4), 391–413.
DOI:10.2190/BX7B-NVRJKF3K-BYBL
Rowley-Jolivet, E. (2000). Image as text. Aspects of the shared visual language of
scientific conference participants. ASp, 27-30, 133–154.
DOI:10.4000/asp.2093
Shang, W. (2007). East-West cultural contact at Dejima. Intellectual exchange and impact in Edo Period Japan. Review of Culture, 22, 104–119.
Tercedor-Sánchez, M. I., & Abadía-Molina, F. (2005). The role of images in the translation of technical and scientific texts. Meta: Journal des traducteurs,
50(4). Retrieved March 20, 2015, from https://www.erudit.org/revue/meta/
2005/v50/n4/019857ar.pdf
Toury, G. (1995). Descriptive Translation Studies and beyond. Amsterdam, Philadelphia: J. Benjamins Pub. Co.
72 Appendices
Appendix 1
A note on terms used in this survey
Science refers to the earth and space sciences, social sciences, life sciences,
physical sciences, and formal sciences.
S&T refers to both “sciences and technology” (cf. science and technology for
definitions of these terms).
Since 2009 is the time period the questions in this survey refer to. Technology refers to engineering.
Visuals refers to icons, tables, charts, graphs, illustrations, diagrams, screenshots,
photos, and videos. “Visuals” may or may not contain text or numbers; for example, labels may contain text and numbers.
Translation of visuals refers to visuals that were modified to account for the target
context; for example, the text in graphs and labels in photos was translated, or different screenshots were created to account for the target context.
Appendix 2
[Questions for translators]
PRE-TEST QUESTIONS
1. In what countries do you live and work?
2.a. In what language pairs have you most translated S&T documentation since 2009?
Rank from most translated (5) to least translated (1).
Select all the combinations that apply; for instance, if you translated from French into Chinese, and from Chinese into French, write “French > Chinese” and “Chinese > French.”
2.b. How much S&T translation work have you done in each language pair since 2009?
Rate each language pair on a scale of 1–100 %, and please make sure the values add up to 100 %.
In the next four questions, we ask you about the volume of S&T translation you did since 2009.
73
3.a. Gauge the volume of science translations you did since 2009, compared with the total volume of translations you did in the same period of time.
For example, if the volume of science translation amounts to 70 % of your translation work, move the slider to where it reads 70.
3.b. Gauge the volume of science translations containing visuals that you did since 2009, compared with the total volume of science translations you did in the same period of time.
4.a. Gauge the volume of technology translations you did since 2009, compared with the total volume of translations you did in the same period of time.
4.b. Gauge the volume of technology translations containing visuals that you did since 2009, compared with the total volume of technology translations you did in the same period of time.
Appendix 3
[Questions for translators]
TEST QUESTIONS
In this section, we ask you about your experience translating visuals in S&T documentation. By “translating visuals” we mean translating the text in graphs and labels or changing the screenshots, to account for the target context.
5. How important is translating the visuals in S&T documentation? extremely important
very important moderately important slightly important not important
6.a. Gauge the volume of visuals in the science documents you translated since 2009, compared with the total volume of science translations you did in the same period of time.
6.b. Gauge the volume of visuals in the technology documents you translated since 2009, compared with the total volume of technology translations you did in the same period of time.
7. Do S&T visuals need to be updated to account for the passing of time? Yes
No
8. Gauge how often you felt (the) visuals had been extracted from an S&T document that you were translating.
74
9. Gauge the volume of S&T documents that came together with instructions for translating the visuals.
10. Did receiving S&T documents with the visuals included help improve the overall quality of your work?
Yes No
11. If you answered “Yes” to question 11, how did it improve the overall quality of your work? a great deal a moderate amount occasionally rarely Appendix 4
[Questions for translation companies]
TEST QUESTIONS
In this section, we ask you about your company’s experience with the translation of visuals in S&T documents. By “the translation of visuals” we mean, for example, when the text in graphs and labels is translated or when the screenshots are changed, to account for the different target contexts.
5. How important is translating the visuals in S&T documentation? extremely important
very important moderately important slightly important not important
6.a. Gauge the volume of visuals in science documents your company translated since 2009, compared with the total volume of science translations in the same period of time.
6.b. Gauge the volume of visuals in technology documents your company translated since 2009, compared with the total volume of technology translations in the same period of time.
7. Do S&T visuals need to be updated to account for the passing of time? Yes
75
8.a. How often did your company extract visuals from S&T documents before sending them to the translators, since 2009?
8.b. How often did your company add visuals to S&T documents before sending them to the translators?
9.a. How often did your company modify the text (for example, captions, annotations) in the visuals of S&T documents that were translated?
9.b. How often did your company modify the images in the visuals of S&T documents that were translated?
9.c. How often did your company modify both the text and the images in the visuals of S&T documents that were translated?
10. Gauge the volume of S&T documents your company sent for translating together with instructions for translating the visuals.
11. Did sending S&T documents with the visuals included help improve the overall quality of the translations?
Yes No
12. If you answered “Yes” to question 11, how did it improve the overall quality of the translations? a great deal a moderate amount occasionally rarely Appendix 5
[Questions for publishers]
TEST QUESTIONS
In this section, we ask you about your company’s experience with the translation of visuals in S&T books and other documents. By “the translation of visuals” we mean, for example, when the text in graphs and labels is translated or when the screenshots are changed, to account for the different target contexts.
6. How important is translating the visuals in S&T documentation? extremely important
very important moderately important slightly important not important
76
7.a. Gauge the volume of visuals in science books and other science documents your company translated since 2009, compared with the total volume of science translations in the same period of time.
7.b. Gauge the volume of visuals in technology books and other technology documents your company translated since 2009, compared with the total volume of technology translations in the same period of time.
8. Do S&T visuals need to be updated to account for the passing of time? Yes
No
9.a. How often did your company remove visuals from S&T publications before sending them out for translation?
9.b. How often did your company add visuals to S&T publications before sending them out for translation, since 2009?
10.a. How often did your company modify the text (for example, captions, annotations) in the visuals of S&T publications that were translated?
10.b. How often did your company modify the images in the visuals of S&T publications that were translated?
10.c. How often did your company modify both the text and the images in the visuals in S&T publications that were translated?
11. Gauge the volume of S&T books and other documents your company sent for translating together with instructions for translating the visuals.
12. Did sending S&T books and other documents with the visuals included help improve the overall quality of the translations?
Yes No
13. If you answered “Yes” to question 12, how did it improve the overall quality of the translations?
a great deal
a moderate amount occasionally rarely
77 Appendix 6
[Questions for all respondent profiles]
POST-TEST QUESTIONS
13. Has this survey changed how you perceive the translation of visuals in S&T documentation?
Yes No
14. If you answered “Yes” to question 13, what did it change? 15. Comments