Development of an end-to-end Supply Chain
monitoring and visualization tool in an
e-commerce business
João Pedro Graça Moura Lopes Ferreira
Masters Dissertation
Supervisor in FEUP: Prof. Eduardo José Rego Gil da Costa
Mestrado Integrado em Engenharia Mecânica
2019-06-14Abstract
Standardization and consolidation of processes are essential for a company to continue its growth in a sustainable way. The company where this project was developed - Farfetch - has grown immensely in the last years, accompanying the personal luxury segment’s growth ten-dency, and it is vital that internal processes and information flows advance and expand method-ically.
Supply Chain plays a very important role in every business; but in a marketplace, which is dependent on the partners’ performance, Supply Chain becomes an even more decisive character. To have optimized supply chain processes will - surely - lead to operational advantages and cost reduction. However, in order to optimize a process it is necessary to have visibility on it, and to measure, monitor and report a specific set of metrics capable of describing in an easy, intuitive and accurate way, the condition of that same process.
A Supply Chain Management System has the enhancement of customer satisfaction as ul-timate goal, as this is what creates value for the company. For that, it has to both monitor all critical activities and be capable of acting if something falls off the targets. A powerful tool to achieve this target is the use of dashboards, which aim at presenting solely the necessary metrics to control the process in an effective and efficient way.
The problem addressed in this project is precisely the development of a consolidated, unani-mous dashboard, which serves as a control tower to monitor the health of the end-to-end supply chain process. In fact, there are currently several reporting routines scattered across multiple teams and all meaningful data is dispersed across numerous locations in the company’s database, in a very unstructured way.
The company’s rising customer-centric mindset puts an extra emphasis and interest on met-rics, which evaluate the supply chain process from a customer point a view, that is, illustrating the real impact the company’s operations have on clients’ experience and, consequently, will-ingness to buy again with Farfetch.
The developed tool enhanced the visibility on the entire supply chain process, through weekly and monthly monitoring of the most significant business’ metrics. An intuitive and analytical visualization tool was developed, so that the metrics assessing performance can be available to everyone who needs it.
A KPI needs a yardstick to be compared with, so efforts towards the dynamic definition of reference lines assessing the number of orders being processed, which is the central part of all operations, have been initiated.
Resumo
A uniformização e consolidação de processos são essenciais para fundamentar o crescimento de uma empresa de uma forma sustentável. A empresa onde este projeto foi desenvolvidao, a Farfetch, cresceu de forma muito acentuada nos últimos anos - acompanhando a tendência de crescimento do setor de luxo - e o progresso metódico de processos internos e fluxos de informação é de elevada importância para que este comportamento se mantenha no futuro.
A cadeia de abastecimento tem um papel significativo em qualquer negócio, alcançando uma posição ainda mais elevada num marketplace, que depende fortemente do desempenho dos parceiros. A sua otimização levará, seguramente, a vantagens operacionais e a redução de custos. Porém, estas vantagens só serão possíveis após ter visibilidade sobre os processos envolvidos, pelo que a medida, a monitorização e a comunicação de métricas internas que os descrevam de forma simples, intuitiva e precisa são necessárias.
Um sistema de avaliação da cadeia de abastecimento tem como objetivo final aumentar a sat-isfação dos clientes. Para tal, o sistema deve, simultaneamente, monitorizar todas as atividades críticas e ser capaz de atuar corretivamente se necessário. Os dashboards são uma ferramenta poderosa para tal são ’dashboards’, que, tal como os painéis de controlo dos carros, pretendem apresentar somente as métricas necessárias para controlar o processo em causa de forma eficiente e eficaz.
Este projeto trata do desenvolvimento de um dashboard unitário, global e completo, que tem o intuito de constituir uma torre de controlo para a monitorização do estado de toda a cadeia de abastecimento. A empresa possui, de momento, múltiplas rotinas de comunicação de métricas dispersas pelas várias equipas que contituem o departamento de Operações, que utilizam dados recolhidos de várias fontes, de forma desestruturada.
A empresa dá acrescido valor a métricas que descrevam o funcionamento da cadeia de abastecimento do ponto de vista do cliente, avaliando-o de acordo com o impacto real dos pro-cessos na experiência do cliente e, consequentemente, na sua vontade de voltar a usar os serviços da empresa.
A ferramenta desenvolvida no âmbito deste projeto trouxe visibilidade a todo o processo da cadeia de abastecimento, através da monitorização semanal e mensal de um conjuunto de métri-cas selecionadas de forma criteriosa. A ferramenta foi construída de forma intuitiva, de modo a que o referido conjunto de métricas esteja disponível para consulta de todos os interessados, e é adaptável às necessidades do utilizador.
Ainda no âmbito do projeto foi desenvolvida uma ferramenta que permite, semanalmente, comparar o estado da cadeia de abastecimento com um intervalo de referência obtido através dos resultados da semana anterior.
Acknowledgements
I would like to thank Farfetch for the opportunity of developing my Masters thesis in this company. A special appreciation to my supervisor at the company, João Mortágua, for all the guidance, help and coaching provided during the development of this project. To Katie, who taught me a lot during these months, which will undoubtedly be very useful in my life, both professional and personal. Ultimately, to everyone who has crossed my path in this company and somehow helped me during these 4 months.
I would also like to manifest my gratefulness to my supervisor in FEUP, Prof. José Eduardo Gil da Costa, for all the advice and counseling he provided and for his entire availability and dedication.
To Prof. José Luís Moura Borges, who promptly advised me on a question that arised during the project.
My parents and my brother Miguel also deserve a very special acknowledgement, for all the priceless support transmitted to me during my whole life. And Assunção as well, for believing in me, supporting my decisions and making me want to make the best of myself. Summarily, to my family, for truly showing me what is the meaning and importance of Family.
To my grandfather Mário, who had a decisive role in my decision to study Mechanical Engineering, and who renovates my enthusiasm in this decision every day, by showing me how to look at the world with the eyes of an engineer. He has always been a great example.
Lastly, to my late grandparents Graça, Fernanda and Gil, who have not lived to see my graduation, but who I am sure are looking after me.
"If you can’t explain it simply, you don’t understand it well enough." Albert Einstein
Contents
1 Introduction 1
1.1 Farfetch . . . 1
1.2 Current Problem and Project Scope . . . 3
1.3 Project Goals . . . 4
1.4 Methodology . . . 4
1.5 Dissertation Structure . . . 5
2 Theoretical Background 6 2.1 Luxury Goods . . . 6
2.2 Who is the Luxury consumer? . . . 6
2.3 Luxury E-Commerce - The Experience of Shopping Online . . . 7
2.4 Customer-centric Platform Thinking . . . 9
2.5 Supply Chain Performance Management Systems . . . 10
2.6 E-Supply Chains . . . 12
2.7 KPI Selection for Correctly Monitoring a Business Process . . . 13
2.8 Data Visualization Techniques . . . 15
3 Problem Description 19 3.1 Ordering Process . . . 19
3.1.1 Step 1 - Check Stock . . . 21
3.1.2 Step 2 - Check Payment . . . 21
3.1.3 Step 3 - Decide Packaging . . . 22
3.1.4 Step 4 - Create AirWay Bill . . . 22
3.1.5 Step 5 - Send Parcel . . . 22
3.1.6 Step 6 - Order is Sent . . . 22
3.1.7 Return Process . . . 23
3.2 Key Performance Indicators . . . 23
3.2.1 Speed of Sending (SoS) . . . 23
3.2.2 No Stock (NS) . . . 24
3.2.3 Perfect Order Fulfillment (POF) . . . 24
3.2.4 Order To Delivery (O2D) . . . 25
3.2.5 Forecast Accuracy (FA) . . . 25
3.2.6 Incentives 4.0 . . . 26
3.3 Current Visibility and Control over Supply Chain . . . 26
3.4 Partner Segmentation . . . 28
3.5 Seasonality . . . 28
CONTENTS
3.7 Improvement Opportunity . . . 30
4 Procedure 31 4.1 Requirements Assessment . . . 32
4.1.1 Farfetch’s Database . . . 32
4.1.2 Definition of new metrics . . . 33
4.1.2.1 Perfect Order Fulfillment . . . 33
4.1.2.2 Number of Ruined Days . . . 35
4.1.2.3 After Hours Orders . . . 35
4.1.3 Automation . . . 36
4.2 Tool Development and its Organization . . . 36
4.2.1 Goals . . . 37
4.2.2 Selected KPIs and Their Measurement . . . 37
4.2.3 Metrics’ Calculation . . . 37
4.2.4 Development of the input tables . . . 38
4.2.4.1 BI_ANALYTICS.dbo.SCA_Scorecard . . . 39 4.2.4.2 BI_ANLYTICS.dbo.SCA_POF . . . 41 4.2.4.3 BI_ANLYTICS.dbo.SCA_NrRD . . . 41 4.2.4.4 BI_ANLYTICS.dbo.SCA_FA . . . 41 4.2.4.5 Joins in Tableau . . . 41 4.2.4.6 BI_ANALYTICS.dbo.SCA_Timezones . . . 42
4.2.5 Dashboard views construction . . . 42
4.2.6 Pipeline status benchmarks . . . 43
5 Final Results 44 5.1 Weekly KPIs . . . 44
5.2 Monthly and Quarterly KPIs . . . 46
5.3 Live: Orders per Step . . . 47
5.4 TOP Partners by Impact . . . 48
5.5 Monthly Ops Cockpit . . . 49
6 Conclusion 50 6.1 Project Conclusions . . . 50
6.2 Future Work . . . 51
A Business Process Modelling of All Steps 57 B KPIs’ Reference Sheet 61 C Description of all tables feeding the dashboard and the query for their assembly 73 C.1 BI_ANALYTICS.dbo.SCA_Scorecard . . . 73
C.2 BI_ANLYTICS.dbo.SCA_POF . . . 87
C.3 BI_ANLYTICS.dbo.SCA_NrRD . . . 93
C.4 SQL Procedures . . . 99
D Calculations in Tableau 100
CONTENTS
F Python Code to identify benchmarks for number of orders in the pipeline 109
Acronyms and Symbols
3PL Third-Party LogisticsAPAC Asia Pacific
API Application Programming Interface ATV Actual Transaction Value
AUNZ Australia and New Zealand AWB AirWay Bill
BaU Business as Usual
CIS Commonwealth of Independent States CR China Region
CS Customer Service
EAM Enterprise Evaluation Methodology EDD Estimated Delivery Date
FA Forecast Accuracy FxFF Fulfillment by Farfetch GMV Gross Merchandise Value
JP Japan
KPI Key Performance Indicator LATAM Latin America
MAPE Mean Absolute Percent Error NPS Net Promoter Score
NS No Stock
O2D Order To Delivery POF Perfect Order Fulfillment PS Partner Service
RoW Rest of the World SaA Suggest an Alternative SCA Supply Chain Analytics SCM Supply Chain Management
SCPMS Supply Chain Performance Measurement System SLA Service Level Agreement
SoS Speed of Sending
SQL Structured Query Language TT Transit Time
USA United States of America WI Wrong Item
List of Figures
1.1 Global Operations’ structure . . . 3
2.1 Global Online Luxury Sales in the past 15 years (Statista, 2019) . . . 8
2.2 Global and local platform users’ networks (Zhu and Lansiti, 2019) . . . 10
2.3 Features to be considered in the specification of KPIs (Domínguez et al., 2019) 15 3.1 Difference between portal orders and boutique orders . . . 20
3.2 Process Ordering Flow . . . 21
3.3 Table originating partners’ performance incentives . . . 26
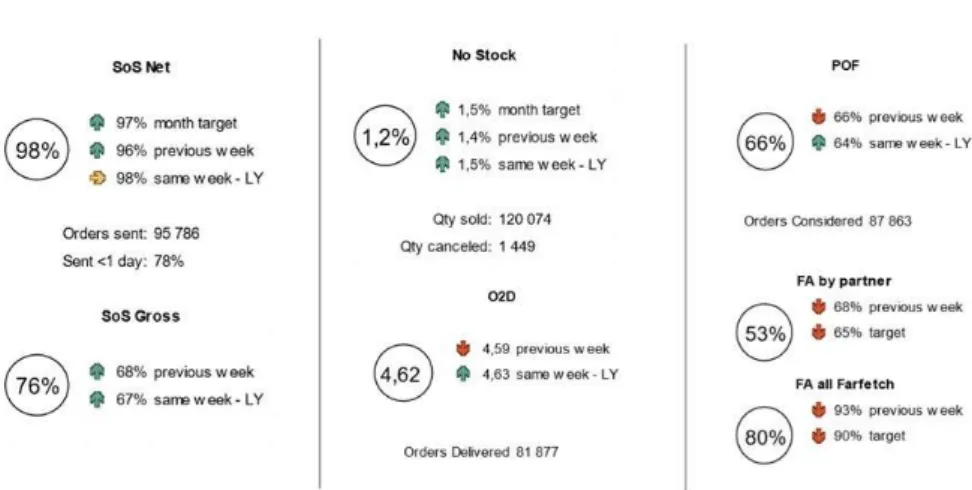
3.4 View of weekly KPI results sent by the Supply Chain . . . 27
3.5 Daily overview of the pipeline’s condition . . . 27
3.6 Number of orders placed per week in 2018 . . . 29
4.1 Followed Dashboard Development Procedure . . . 31
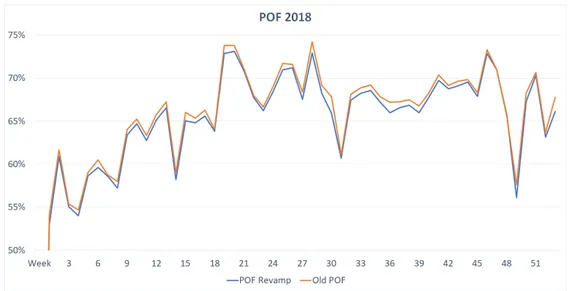
4.2 POF values in 2018, before and after the revamp . . . 34
4.3 Relative relevance of criteria affecting POF . . . 34
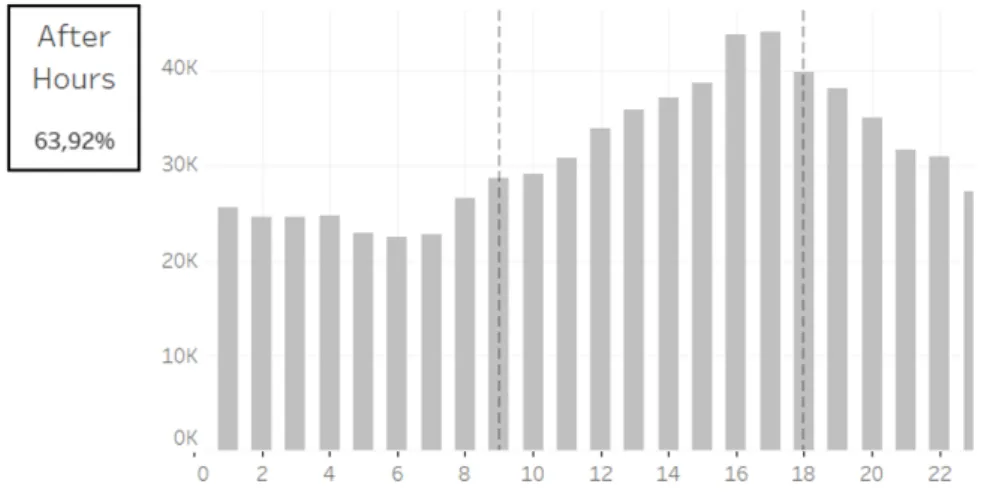
4.4 Hourly Distribution of Order Placement . . . 36
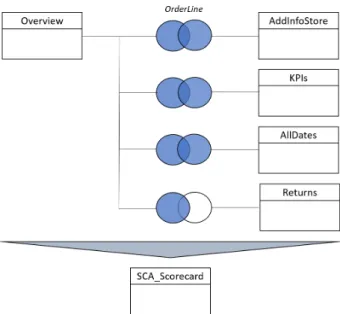
4.5 Constitution of the main table feeding the visualization tool . . . 40
5.1 Dashboard view providing a weekly insight on the whole end-to-end process . . 45
5.2 Dashboard view providing a monthly insight on the whole end-to-end process . 46 5.3 Detail of the quarterly dashboard view . . . 47
5.4 Dashboard view of the live pipeline status . . . 47
5.5 View of the selected week’s top partners by sold value and by impact per metrics 48 5.6 Cockpit - O2D . . . 49
A.1 Process Swimlane of Step 1 . . . 57
A.2 Process Swimlane of Step 2 . . . 58
A.3 Process Swimlane of Step 3 . . . 58
A.4 Process Swimlane of Step 4 . . . 58
A.5 Process Swimlane of Step 5 . . . 59
A.6 Process Swimlane of Step 6 . . . 59
A.7 Process Swimlane of Step 7 . . . 60
B.1 SoS Net Reference Sheet . . . 61
B.2 SoS Gross Reference Sheet . . . 62
LIST OF FIGURES
B.4 NS Gross Reference Sheet . . . 63
B.5 Transit Time Reference Sheet . . . 63
B.6 SoS Less Than 1 day Reference Sheet . . . 64
B.7 SoS Less Than 2 days Reference Sheet . . . 64
B.8 Order To Delivery Reference Sheet . . . 65
B.9 SoS Gross Reference Sheet . . . 65
B.10 SoS Gross Reference Sheet . . . 66
B.11 Number of Ruined Days Reference Sheet . . . 66
B.12 Average Ruined Days per Ruined Order Reference Sheet . . . 67
B.13 After Hours Orders Reference Sheet . . . 67
B.14 Forecast Accuracy whole Farfetch Reference Sheet . . . 68
B.15 Forecast Accuracy per Partner Reference Sheet . . . 68
B.16 Percentage of Returns Reference Sheet . . . 69
B.17 Number of Orders in Pipeline Reference Sheet . . . 69
B.18 Average Age of Orders in Pipeline Reference Sheet . . . 70
B.19 Average Time Spent in Step 1 Reference Sheet . . . 70
B.20 Average Time Spent in Step 2 Reference Sheet . . . 71
B.21 Average Time Spent in Step 3 Reference Sheet . . . 71
B.22 Average Time Spent in Step 4 Reference Sheet . . . 72
B.23 Average Time Spent in Step 5 Reference Sheet . . . 72
D.1 Example of metrics’ calculation in Tableau . . . 100
D.2 Example of the construction of a parameter in Tableau . . . 101
G.1 Detailed view of the functioning of one of the built in filter options . . . 113
G.2 Dashboard view presenting a weekly view of all metrics . . . 114
G.3 Dashboard view presenting a monthly view of all metrics . . . 115
G.4 Dashboard view presenting a quarterly view of all metrics . . . 116
G.5 Dashboard view of the live pipeline status . . . 117
G.6 Dashboard view presenting the selected week’s top 20 partners by value metrics, as well as the top 10 partners by impact per metric . . . 118
G.7 Ops Cockpit - O2D . . . 119
G.8 Ops Cockpit - POF . . . 119
G.9 Ops Cockpit - RD . . . 120
G.10 Ops Cockpit - NS . . . 120
G.11 Ops Cockpit - SoS . . . 121
List of Tables
4.1 Preview of SCA_Timezones . . . 42 4.2 One week’s obtained reference values per step (fictional values used) . . . 43
Chapter 1
Introduction
This project was developed in the scope of the Masters in Mechanical Engineering in Facul-dade de Engenharia da UniversiFacul-dade do Porto and performed in corporate context at Farfetch.
Fashion has always played a significant role in the evolution of society: from being a key social element of the Romans to boosting international trade during the years of industrialization (Okonkwo, 2007), the acquisition and possession of luxury goods have always been a way of showing personality, individualism and social and financial status.
Veblen (1899), a hundred years ago, in his Conspicuous Consumption Theory, commented on people’s disposition and willingness to pay an increased price for prestigious, unique products to display prominent social status.
A few years later, Coco Chanel defined luxury as ’the opposite to vulgarity’ and quoted that ’luxury is a necessity that begins where necessity ends.’ (Okonkwo, 2007).
Last year, online sales of personal luxury goods accounted for 8% of the C254 billion global luxury market, or about C20 billion, according to Achille et al. (2018). The same author also states that ’that is up five-fold from 2009 and we expect online luxury sales to more than triple by 2025, to about C74 billion’.
This already billion-dollar and growing industry is the core of Farfetch’s business and the desire of constantly exceeding customers’ expectations is the company’s goal.
1.1
Farfetch
Founded by José Neves in 2008, Farfetch is an online luxury fashion marketplace, which connects more than 1200 partners - luxury boutiques, brands and warehouses - to millions of customers all over the world, on a single website. 11 years after its launch, Farfetch has partners in 49 countries, and has clients in more than 190 countries. It has offices in 13 different cities and is growing over 50% every year, having generated a record Gross Merchandise Value (GMV)
1. Introduction
in 2018 (Halliday, 2019), being since 2017 the first Portuguese company valued more than 1 billion dollars. In October 2018 the firm entered the New York stock exchange and in the same year revenue rose by 56% and the number of placed orders increased 58%. Farfetch also owns British renowned boutique ’Browns’ and American footwear brand ’Stadium Goods’.
In 2019 Farfetch already announced the acquisition of JD.com’s luxury platform Toplife to enable the gateway to the China market and the partnership with Harrods, to create and manage the department’s e-commerce platform (Suen, 2019).
Farfetch’s aim is to offer the luxury goods customers a unique, creative, excellence service. The company’s business model is what distinguishes it from its competitors and is the one of a marketplace: it doesn’t hold any stock or have its own transportation system. The partners, who, due to their presence on the website, have a visibility and accessibility they wouldn’t have other-wise, sell directly from their own stock points to the clients. The client only knows which partner he/she is buying from at the time of delivery, as all the information flow passes through and is managed by Farfetch. In order to guarantee the desired service levels, the company controls the whole process, from content creation through delivery to the client’s house to the post-sales customer service. The delivery service is outsourced from third-party logistics partners (3PL), which charge Farfetch a shipping fee. The price payed by the customers includes the item’s price, Farfetch’s margin and the shipping fee.
The business model is, however, associated with higher complexity and numerous chal-lenges, such as the risk of stock out, the dependency on the partner’s performance, and the complexity of delivery (as there are a great number of possible routes).
Farfetch is organized in the following departments: Global Operations, Product, Communi-cations, Technology, Finance, Strategy and Commercial.
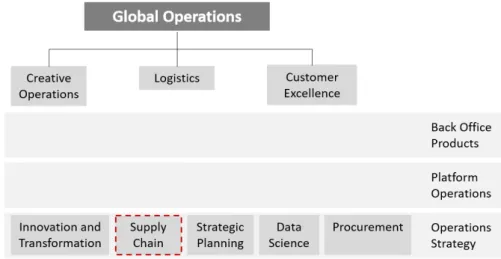
The Global Operations Department is responsible for all activities related with daily e-commerce and consists of several teams, as shown in Figure 1.1.
The Creative Operations team is responsible for everything that has to do with Farfetch’s content production. It ensures, among others, products’ photographing and availability online.
The Logistics team manages all order shipment related activities, including products’ return processes.
The Customer Excellence team is the bridge linking the company to partners and clients, through Customer Service (CS) and Partner Service (PS) teams. CS representatives help cus-tomers with their complaints and questions, both pre and post order, and PS supports boutiques and brands on operational issues.
1.2. Current Problem and Project Scope
Figure 1.1: Global Operations’ structure
Back Office Products, Platform Operations and Operations Strategy are cross functional teams, which support the other teams and work on the continuous improvement of processes and, ultimately, of customer experience.
This project was developed in the Supply Chain team, which is a part of Operations Strat-egy. The Supply Chain team’s responsibility is to ensure the proper order processing flow and to control and monitor partners’ performance. All packaging issues are the Supply Chain’s re-sponsibility, as well.
A core principle of Farfetch is customer-centricity: the main focus of the company is to improve customer experience. Objectives, targets and rewards are aligned with this strategy and this is what makes Farfetch a truly data-driven and innovative company. A customer-centric culture is ’unanimously accepted as the driver of future growth and development’ (Banovic-Curguz and Ilisevic, 2018). This key consideration will guide the entire project.
1.2
Current Problem and Project Scope
Farfetch has grown very rapidly and its structure evolved enormously. To ensure a healthy growth, it is of extreme importance to guarantee the proper flow of the supply chain processes, which will surely impact customers’ experience, satisfaction, and even retention.
Currently there is very low monitoring of the whole Supply Chain - the existing routines are spread out over the multiple Operations teams, which use their own KPIs. There is no standard-ization, nor a unified dashboard or scorecard that presents the current state of the Supply Chain in an easy, concise, consistent and flexible way. The current reporting methods are manual, exhausting and have a low performance due to the huge amount of data.
1. Introduction
The above mentioned issues justify the urge to define a control tower including every KPI that shall be measured and monitored, in order to gain visibility on the entire system’s perfor-mance on a weekly basis. The monitoring of the end-to-end supply chain’s perforperfor-mance implies the comparison with dynamic targets and this will lead to the identification of possible pain points. From that moment, where all the process’s performance is visible and measurable, it will be possible to react fast and in a more effective way to eventual problems.
1.3
Project Goals
The current project has the intent of constructing a concise, intuitive and flexible dashboard, which acts as a control tower for monitoring the health of the company’s end-to-end supply chain system. The project defined goals are:
• Map every process belonging to the supply chain process;
• Build a scalable and robust dataset, to serve as the source for all necessary analyses; • Create, rearrange and adapt already existent and new KPIs to fit the dashboard’s purpose
and the company’s goal;
• Develop and promote a customer-centric approach to the system’s monitoring; • Select a relevant set of KPIs to evaluate the system’s performance;
• Compare current performance with targets or benchmarks;
• Gain visibility on the real customers’ experience, in order to improve it; • Automate current processes of KPI reporting.
The dashboard is to be used by a wide range of people and teams, from business analysts to directors. Thus, it must on the one hand give a high-level perspective of the whole process and on the other hand permit a detailed view of each operation.
Alignment with the company’s customer-centric mindset is a crucial feature for the dash-board to effectively be used.
1.4
Methodology
The dashboard development procedure was adapted from the one suggested by Vilarinho et al. (2018).
This project was divided in four major steps, namely the construction of the comprehensive dataset, the definition and calculation of new metrics, the development of the dashboard(s) and the iteration of the obtained solution, aiming at meeting all requirements.
1.5. Dissertation Structure
In order to understand the functioning of the Supply Chain process, the whole order process-ing was examined.
Afterwards, it was investigated which actions have an impact on customer satisfaction, and a metric to measure it was selected. Some KPIs were already being used by the company, but others had to be created. The company’s gradual move to customer-centricity made it necessary to adapt already existing metrics, as well.
In order to build a dashboard that will be used by multiple teams, overcoming the problem of having many teams calculating their KPIs in a somehow autonomous way, the teams Partner Service, Customer Service, Fulfillment Operations, Delivery and Partner Success were involved in the dashboards’ development process.
After having completed the dashboard views, the task of defining benchmarks for the pipeline status was focused on.
Subsequently, after the dashboard’s implementation and test phase, a presentation was held for several managers, in order for them to inform their teams of the existence and usability of the dashboard.
1.5
Dissertation Structure
This project is divided in six chapters, as following:
Chapter 1 - Introduction to the present work, including the projects’ scope and goals, as well as used methodologies;
Chapter 2 - Theoretical background, scientifically supporting the decisions and assumptions made during the elaboration of the project;
Chapter 3 - Detailed description of Farfetch’s business and of the Supply Chain’s current process and visibility;
Chapter 4 - Exposition of the steps executed during the current project;
Chapter 5 - Presentation of the final results, as well as listing of the effects of the project; Chapter 6 - Conclusion of the current work, summarizing all the improvements and changes due to the implementation of the proposed solution, as well as definition of next steps.
For confidentiality reasons, all values shown in tables or graphs in this project are fictional. In some cases values are real, but the graph’s axis was multiplied by a random factor.
Chapter 2
Theoretical Background
In this chapter, the performed literature review is presented.2.1
Luxury Goods
Luxury is a Latin word with old and still debated roots. It does not descend from ’lux’ (light and enlightenment); instead, it is closer to ’luxatio’, which means ’a disruption, an excess of’ (Kapferer, 2015).
Ko et al. (2017) state luxury is a relative concept, and peoples’ perception of what is ’luxury’ has varied over time. According to Okonkwo (2007), luxury is not a product nor an object, nor even a lifestyle. It is rather an identity, a philosophy and a culture. Thus, the purchase of luxury goods intends to simultaneously fulfill the consumers’ functional, symbolic and hedonic needs such as ego or self-esteem, the desire of projecting and affirming a self-image, the necessity of social status reinforcement or the desire of individualization (Okonkwo, 2009).
The literary review performed by Ko et al. (2017) identifies multiple key theories aiming to explain the motivation for luxury consumption: the self-concept theory, the social comparison theory, the extended-self theory, the theory of uniqueness and the conspicuous consumption.
2.2
Who is the Luxury consumer?
In the luxury business more than in others, the consumer is king, and if a brand wants to be successful, it has to focus on its consumers, understand them and continuously deliver them the best experiences.
Luxury consumers can be segmented into multiple categories according to their financial status or fashion insights (Chen and Zhang, 2011; Shen et al., 2017), but a distinction regarding consumers’ mindset and behavior is more illustrative. There are the traditional luxury con-sumers, who look for traditional and exclusive brands and the new luxury concon-sumers, who are
2.3. Luxury E-Commerce - The Experience of Shopping Online
rather attracted by the offered shopping experience than by the brands’ names. The latter ones prefer experience over materialism, are highly sophisticated, literate and savvy and know ex-actly want they want. Their choices of luxury products are based more on an understanding of their own style needs and less on the ’brand-name’ factor (Okonkwo, 2007). These consumers will be loyal to those brands whose service quality level doesn’t cease to constantly exceed their expectations and fulfill their needs of personal and social identity (Okonkwo, 2007).
Contrasting with the traditional view that what drives consumers to buy luxury products is their uniqueness and rarity, Ko et al. (2017) enunciate a survey performed in 2012, which showed evidence that nowadays many brands are able to mass-market luxury items. Nevertheless, the question of how can luxury brands manage growth worldwide while remaining rare enough to be desirable, is yet to be answered.
This shift in the luxury consumers’ mindset is pushing luxury brands to redefine what they deliver to customers, and how they deliver it (D’Arpizio et al., 2017). To do that, they rely more and more on digital technologies, such as Artificial Intelligence and Big Data, which are helping them to redesign customer engagement techniques through data analytics (Arienti, 2018).
2.3
Luxury E-Commerce - The Experience of Shopping Online
Although ’there was no love at first sight between luxury and Internet’ (Heine and Berghaus, 2014), due to the luxury sector’s fear of losing its aura (Okonkwo, 2007), as soon as consumers accepted the Internet as a convenient platform for luxury goods shopping (Chen and Zhang, 2011), brands had to quickly adopt this new channel.
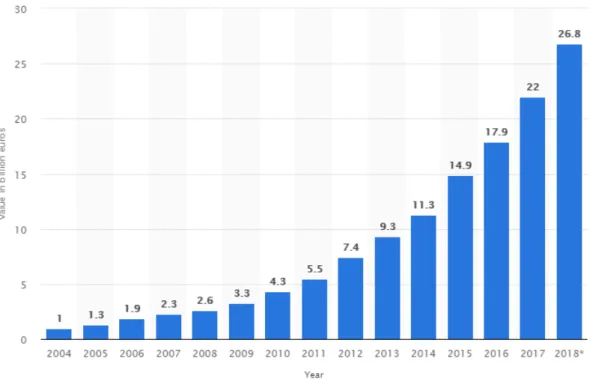
The luxury sector’s initial apprehension and resistance towards the digital world contrasts with the usual avant-gardism and innovation that characterize it (Okonkwo, 2009). An expla-nation is the back then existing idea that the Internet was a place for discounted, damaged or counterfeit goods. However, consumers are in fact willing to buy luxury products online, and at ’undiscounted’ prices (Dauriz et al., 2014; Castillan et al., 2017), and in recent years the growth of online luxury sales has overcome the one of overall sales of luxury goods. The evolution of worldwide online personal luxury goods market sales in the past 15 years is depicted in Figure 2.1.
Achille et al. (2018) forecast that the volume of online luxury sales will reach 19% of all the transactions of this sector by 2025, amounting to C74 billion.
2. Theoretical Background
Figure 2.1: Global Online Luxury Sales in the past 15 years (Statista, 2019)
By the same year it is expected that about 40% of luxury customers will be today’s 16 to 35 year olds - the mentioned new luxury consumers -, compared to only 27% in 2016 (D’Arpizio et al., 2017). The new generations’ tech savviness is forcing brands to invest in the digital market and to use social media to engage with customers (Arienti, 2018).
Although bringing along challenges and risks, the internet provides a unique opportunity to access the huge market of the online consumer population.
According to Achille et al. (2018), in 2018 about 80% of luxury sales were ’digitally influ-enced’ - during the luxury purchase journey customers come in touch with at least one digital interface, either seeking advice on social media or buying the luxury item online or subsequently posting about their purchases.
Due to the undeniable growth and acceptance of Internet, luxury brands are being forced to switch their mindset from rigidity to reception of and adaption to a constantly evolving world (Okonkwo, 2009). An alliance between luxury and technology is quickly emerging among the most forward-looking brands, which will enable rapid response to shifts in demand and customer needs, cost reduction and the ability to quickly interpret and use customer data (Achille et al., 2018). The same authors also agree that, however, eretail doesn’t replace the physical retailers -it is rather a complementary sales channel for offline activ-ities, and, therefore, online and offline strategies should not be separated (Castillan et al., 2017).
2.4. Customer-centric Platform Thinking
company-driven (owned channels) to consumer-driven (social channels) and third-party plat-forms (paid channels). According to Achille et al. (2018), the digital shopper is increasingly seeking a multibrand experience and, therefore, it might be effective for brands to establish part-nerships with multi-brand retailers or marketplaces online (Dauriz et al., 2014), which hold the competencies required for the digital transformation.
A study by Liu et al. (2013), in line with Chen and Zhang (2011), shows there are differences between online and in-store shopping behaviors of luxury consumers. These authors conclude that online shoppers are worried about convenience, price, product availability and online trust, whereas in-store shoppers have higher consideration for issues like aesthetic appeal, store trust, shopping experience and customer service.
2.4
Customer-centric Platform Thinking
A platform business creates ’value primarily by enabling direct interactions between two or more participant groups’ (Uenlue, 2017), as seller and buyer, service provider and service seeker or content creator and consumer.
On many digital networks the cost of serving an additional user is negligible, which makes a business inherently easier to scale up (Zhu and Lansiti, 2019). The long-term success of a product or service depends heavily on the health, defensibility and dominance of the ecosystem in which it operates. In these kind of businesses the employees don’t deliver the product or service - instead they just design and oversee an automated, algorithm-driven operation - so the structure of the network influences the platform business’s ability to sustain its scale. This form of IT setup enables companies to innovate, experiment, fail, learn and scale very quickly (Bossert and Desmet, 2019).
A big threat to platforms which capture value directly from matching and by facilitating transactions is disintermediation - network members, suppliers and clients, don’t need the hub anymore, bypassing it and connecting directly. As a way to avoid this phenomenon, platforms try to enhance the value of conducting business on them (Zhu and Lansiti, 2019).
Hereof, the more a network is fragmented into local clusters, the more isolated these clusters are from each other and the more vulnerable the business is to challenges. When the network effect weakens, so does the market position (Zhu and Lansiti, 2019). Figure 2.2 depicts two distinct network clusters of modern platforms, with two completely different network formats.
2. Theoretical Background
Figure 2.2: Global and local platform users’ networks (Zhu and Lansiti, 2019)
Delivering innovative solutions and keeping up with customers’ expectations requires an innovation driven culture with customer value at its center. Platform-based companies do this by organizing their business around a set of modular ’platforms’, which are logical clusters of activities and associated technologies that deliver a specific business goal. Platforms focus on delivering business solutions to serve internal or external clients and enable a great flexibility, as they can be managed and run as independent services, be swapped in an out and assembled in different ways (Bossert and Desmet, 2019).
There are two core digital structures - digital platforms and ecosystems. Digital platforms al-low a range of digital products on top of them, such as advertising or marketplaces. Ecosystems, on the other hand, often start with a consumer need for a service, and the ecosystem provides the match between supply and demand (Bughin and Catlin, 2019).
2.5
Supply Chain Performance Management Systems
Supply chain performance is one of the most critical issues in various industries, as supply chains are involved in the entire product life cycle (Balfaqih et al., 2016). To monitor and evaluate the supply chain’s overall performance is a complex task (Cai et al., 2009), resulting in general benefits such as assessing and controlling progress, highlighting accomplishments, improving understanding of key processes, identifying potential problems and providing insight about possible improvement actions (Lima-Junior and Carpinetti, 2017).
Performance measurement and management have become essential for organizations to sur-vive in the competitive business environment (Elgazzar et al., 2018) and specifically, improving supply chain performance has become imperative for gaining competitive advantages for com-panies (Cai et al., 2009). A functioning supply chain is the key to guarantee service quality and to achieve customer satisfaction, which will lead to customers’ increased willingness to pay premium for the value-added experience (Shen, 2015). Operational and supply chain strategy should therefore be aligned with customer strategy (Maestrini et al., 2017).
2.5. Supply Chain Performance Management Systems
A Supply Chain’s strategy and practices are shaped by the firm’s business model. Business requirements are not static along the company’s life cycle - for this reason, when the business model evolves, supply chain strategy has to be renewed or adapted, too, in order to maintain competitive advantage. The KPIs’ definition and calculation must evolve accordingly to the system requirements. Therefore, a KPI measurement set shall be provided with suitable mech-anisms that allow KPI evolution processes to be accomplished easily and effectively (Robinson and Hsieh, 2016; Domínguez et al., 2019).
The literature review performed by Robinson and Hsieh (2016) identified four distinct types of supply chain strategy, namely efficient (aim is creating highest cost-efficiency), risk-hedging (aim is minimizing risks of supply disruption), responsive (aim is being responsive and flexible to the changing customers’ needs) and agile (aim is being responsive to the shifts in customers’ demands on the front-end while minimizing risks of supply disruptions on the back-end).
The goal of a supply chain performance management system (SCPMS) is to support the implementation of the supply chain strategy and the fulfillment of its objectives (Maestrini et al., 2017). As a supply chain management system often involves monitoring multiple processes and relationships, which don’t belong to the company’s sphere of influence, the same author defines a SCPMS as ’a set of metrics used to quantify the efficiency and effectiveness of supply chain processes and relationships, spanning multiple organizational functions and multiple firms and enabling supply chain orchestration’. A SCPMS should be based on the company’s strategic objectives and consists of diverse processes, such as measure identification, target definition, planning, communication, monitoring, reporting and feedback (Cai et al., 2009). The impact of supply chain performance on the company’s overall performance should also be included (Elgazzar et al., 2018).
The critical review of published research on SCPMS conducted by these authors identified four main possible concepts behind them: process focus, prioritization of performance measures, integration of different dimensions and causality between variables investigation. As supply chain performance is not a one-dimensional concept, a particular SCPMS may belong to more than one of the referred categories.
The supply chain process may be, generally, divided into three stages, according to Stanley et al. (2018) - source, make and deliver. Regarding the delivery process, the same authors state that last-mile delivery is especially important for customers, as it offers convenience and flexibility, and that is why same-day and on-demand-delivery services are becoming more and more important.
The same author state there is no single optimal supply chain performance measurement tool, as each company’s supply chain is different. In order to be effective the framework must:
• capture the essence of organizational performance;
2. Theoretical Background
• enable target setting;
• show both financial and non-financial measures; • be reliable;
• enable aggregation and prioritization; • facilitate integration;
• be simple and easy to use;
• enable fast feedback and continuous improvement.
In opposition, the most important criticisms addressed to supply chain management systems and the main causes why their potential is not always reached, are the lack of connection with strategy, the excessive number of metrics and the inconsistency in performance measurement (Elgazzar et al., 2018).
The same authors allege that the performance system must also be able to evaluate the current supply chain performance from different perspectives.
2.6
E-Supply Chains
Businesses have now fewer boundaries than ever before, due to globalization, the increased use of outsourcing, the development of information technology (IT) and the increased demands of integration (Balfaqih et al., 2016; Arzu Akyuz and Erman Erkan, 2010). These novelties in the business environment require adequate performance measures and metrics to enhance supply chain efficiency (Balfaqih et al., 2016).
Examples of web-based retail platforms, connecting sellers to consumers, are Farfetch.com, Alibaba.com, Amazon.com, eBay.com or Taobao.com (Shen, 2015). Time is a decisive criterion for service quality, as customers are increasingly depending on and expecting a fast response. The same authors also affirm that customer loyalty is significantly related to ’fulfillment and responsiveness’. An analysis performed by Park and Hong (2014) considers the hypothesis of the market demand being not only influenced by the retail price and service level, but also by the service time.
Supply chain management (of online marketplaces) starts with a decisive forecasting system, whose aim is to avoid or at least minimize the mismatch between supply and demand (Shen, 2015). Flexibility and channel coordination are enormous assets, too, as they permit a more prompt response to the various fluctuations in supply and demand and are, therefore, determinant for the service’s performance improvement.
Nowadays large amounts of digital information exist on virtually any topic of interest to a business (McAfee et al., 2012). The proper use of Big Data - cleaning, organizing and extracting useful information from it (Radermacher, 2018) - leads a company to decision-making on the
2.7. KPI Selection for Correctly Monitoring a Business Process
basis of evidence and rigor rather than intuition, allowing better predictions, smarter decisions and more effective interventions (Radermacher, 2018; Peral et al., 2017; Fernández et al., 2015). However, big data’s power does not erase the need for vision or human insight. In tackling big data, computers have an advantage over people with their ability to consume huge amounts of information, but are less effective in having the judgment or ability to understand the impli-cations of made decisions (Mukherjee, 2016).
A survey performed by McAfee et al. (2012) concluded that ’data-driven decisions tend to be better decisions’, which is sustained by Moore (2017).
2.7
KPI Selection for Correctly Monitoring a Business Process
According to Kaplan and Norton (1992), decision makers cannot manage what they cannot measure. To continuously measure, monitor and evaluate a specific, dynamic set of metrics is the key to supply chain processes’ optimization in terms of efficiency and effectiveness (Cai et al., 2009). Vilarinho et al. (2018) affirm that the main challenge for successful continuous im-provement is to develop a sustainable infrastructure that implements, promotes and coordinates metrics’ monitoring.Maestrini et al. (2017) define a metric as a verifiable performance measure (stated in either qualitative or quantitative terms) that assesses a happening through a reference or target value, and that is associated with consequences of being on, below or above target. Expanding this definition, Domínguez et al. (2019) make use of Parmenter’s definition of Key Performance Indicators as ’a set of measures focusing on those aspects of organizational performance that are the most critical for the current and future success of the organization’. Therefore, when defining KPIs, one should always have the end result in mind (McNeeney, 2005), namely the achievement of strategic goals.
KPIs can be used with the purpose of evaluating the (past or present) performance of a monitored system, or to predict the future behavior of the system (Domínguez et al., 2019). In modern companies, Business Intelligence (BI) technologies provide historic, existing and predictive sights of business operation (Kumar and Belwal, 2018).
Having an effective and relevant KPI selection is essential in today’s competitive business environment, but modern supply chain systems are filled with too many individual measures, which can be counterproductive (Domínguez et al., 2019). To select the most adequate key performance indicators is considered a multi-objective problem (Chorfi et al., 2015), involving a broad number of aspects (Domínguez et al., 2019). An adequate KPI selection should involve considerations in terms of the KPIs’ suitability for the company’s strategic objectives, profile and current life cycle situation, as well as the time frame (Muntean et al., 2016) and effective metrics result in defining significant action and improvement, rather than simply monitoring performance (Kumar and Belwal, 2018).
2. Theoretical Background
There are several guidelines proposed in order to assist the effective definition of a set of KPIs and a widely used one is the SMART (Simple, Measurable, Attainable, Realistic and Time related) criteria (Chorfi et al., 2015; McNeeney, 2005). The particular circumstances of each company make it necessary to adapt and customize general KPI definitions, tailoring them to deal with the company’s specific situation and needs (Domínguez et al., 2019).
A powerful method for selecting the most adequate and significant KPIs for a company is the Enterprise Analysis Model (EAM), as suggested by Kaganski et al. (2017). It consists of a questionnaire, to be filled by several people with different positions within the organization, with the goal of getting insight on which data is relevant and is necessary to be collected and monitored. After analyzing and ranking the answers according to a significance index (based on the collaborators’ role in decision making), it is easier to select the KPIs to be implemented.
Regarding KPI selection, Ahmed et al. (2017) consider machine learning as a powerful tool to establish rules to identify the best KPIs for a business, through determination of a KPI score, establishment of correlations and pairwise comparison between each considered KPI.
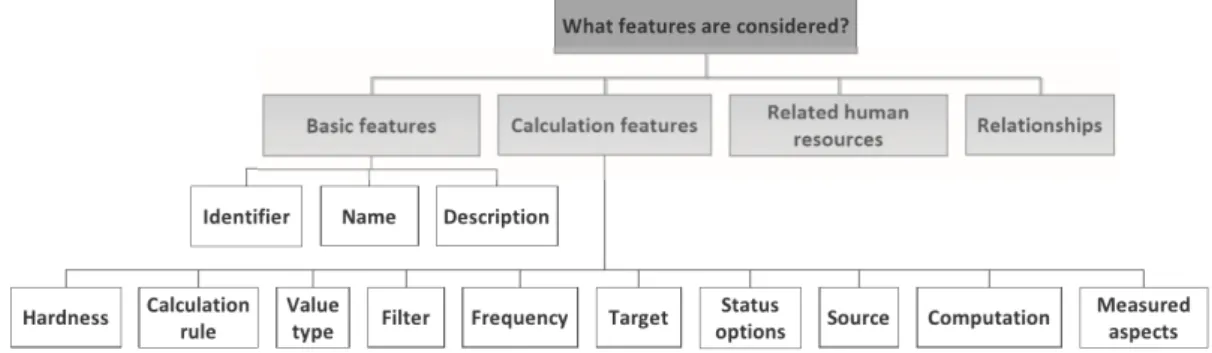
According to Domínguez et al., 2019 the KPI’s features, summarized in Figure 2.3, are:
• hardness refers to a KPI’s subjective or objective nature; • calculation rule is the calculation’s specific formula;
• value type specifies the type of data in which the KPI is expressed, as well as its unit of measure;
• filter has to do with conditions that may accompany the KPI and play the role of filters; • frequency refers to the periodicity with which the KPI is calculated;
• target depicts the KPI’s objective and may be presented in the form of an absolute value or a range;
• status options are divisions of the KPI’s range of values in certain intervals with particular meanings;
• source refers to the entities and databases that are necessary to compute a KPI; • computation refers to the way a KPI is computed;
• measured aspects indicate which business level the indicator measures (duration, cost, quality,...).
2.8. Data Visualization Techniques
Figure 2.3: Features to be considered in the specification of KPIs (Domínguez et al., 2019)
Referring to the human resources related to a particular KPI, the same authors identify the roles of the owner, the responsible and the interested. The people or departments involved in the development and usage of a KPI are referred by the ISO 22400 standard as the KPI’s ’audience’. After having defined and calculated adequate key performance indicators, the critical ones have to be identified and correction actions prioritized, which can be as defying as the KPI definition (Cai et al., 2009).
It is critical for performance measurement systems and related criteria to be updated, evalu-ated and refined constantly (Cai et al., 2009) and automation provides both reliability and time savings collecting the data. According to McNeeney (2005), ’without a central location to col-lect, store and report KPI data, it can be extremely difficult to manage metrics unified around a strategy map’. Changes in the organization’s objectives may be reflected as changes in a partic-ular indicator’s target (Muntean et al., 2016).
2.8
Data Visualization Techniques
The major goal of data visualization techniques is to provide users with a qualitative and easy understanding of the information contents (Kumar and Belwal, 2018), permitting an efficient interpretation of data and, consequently, data-driven decision-making (Moore, 2017).
The process of extracting useful information from large, complex data sets is called big data mining. One of the main challenges associated with it is, precisely, visualization, as analytic results have no meaning when devoid of context and when not displayed in a way users can un-derstand and utilize (Peral et al., 2017; Moore, 2017; Yigitbasioglu and Velcu, 2012). Therefore, when representing a metric, it is necessary to understand what context it needs to be meaningful, and provide it.
Visual methods always imply the risk of possible misunderstanding of visual information, which may lead to wrong conclusions (Sedrakyan et al., 2019; Vilarinho et al., 2018). In order
2. Theoretical Background
to avoid this and to pass the right and most useful information to decision-makers in an effec-tive way, certain visualization principles deserve a cautious forethought. One of the pillars of visualization techniques is the perception theory, having been developed over the past years.
Sedrakyan et al. (2019) identify three types of feedback a visualization method may provide: summative(understand habits, make comparisons and track progresses towards goals), real-time and predictive feedback. Each desired output is best accomplished recurring to a particular visu-alization method. The same author presents a set of visuvisu-alization metrics - effectiveness, expres-siveness, readability and interactivity - aiming to help choosing the most suitable visualization for a given data set.
Data Visualization is, due to its complexity, regarded as an important skill for today’s data-centric, analytic jobs (Ryan et al., 2019).
One important data visualization technique is dashboards, whose name comes from vehicle dashboards, where only the few metrics the driver needs to know are provided. Dashboards must be concise, accurate, simple and intuitive to use (Yigitbasioglu and Velcu, 2012) and deliver a comprehensive awareness of current performance (Kumar and Belwal, 2018; Peral et al., 2017), by comparing it with a target or benchmark.
In recent years dashboards have evolved from the sole purpose of monitoring performance to more advanced analytic purposes (Velcu-Laitinen and Yigitbasioglu, 2012). As such, they are expected to collect, summarize and present information from multiple sources, so that the user can see at once how various performance indicators are performing (Yigitbasioglu and Velcu, 2012). Dashboards are data-driven support systems, providing comprehensive information of the trends and historical information about the company’s KPIs in a synthesized way, acting as trig-gers for further analyses, if needed. In the same authors’ words, regarding data the dashboards only provide ’the tip of the iceberg’.
Vilarinho et al. (2018) classify the possible purposes of a dashboard as following:
• to monitor critical activities and processes (using metrics that set off alerts when perfor-mance falls off established goals);
• to analyze the causes of problems (by exploiting relevant and timely provided information through several perspectives and levels of detail);
• to manage people and processes to improve decisions.
The identification of the dashboard’s purpose enables adjustment of its features, to guarantee that stakeholders’ needs are met.
The goal of a dashboard is to improve perception, and not complicate, hinder or bias it (Yig-itbasioglu and Velcu, 2012), which makes it necessary to deliberate on some aspects during the design stage. There is a balance between dashboards’ visual complexity and usability, as ex-cessive features and information might actually have an adverse impact on the decision makers’
2.8. Data Visualization Techniques
capability to decide. The utility of the information is also a crucial point: the amount of pre-sented data has to be limited, in order to maintain objectiveness, relevancy and focus and to not overwhelm the audience with unnecessary information (Moore, 2017; Archambault et al., 2015). Dashboards’ usability - and reliability - also depend on the quality of the data used to produce it, defined in matters of accuracy, completeness, currency and consistency. Data is accurate when it is correct, unambiguous, objective, meaningful and believable. Its completeness depends on the users’ demands and its currency refers to being up-to-date. Consistency involves the absence of conflicts between two data sets and to the reliability of the data during a longer period of user experience (Moore, 2017; Velcu-Laitinen and Yigitbasioglu, 2012; McNeeney, 2005).
User acceptance also defines the usability of a dashboard (Domínguez et al., 2019). There-fore, a viable attribute to include is a built-in user feedback mechanism, which will enable fu-ture refining, improving and adjusting visualizations based on the users’ needs (Sedrakyan et al., 2019).
Dashboards include functional and visual features, and the desired effect might only be achieved if both are coordinated. Examples of functional features are real-time notifications and alerts, drill-down capabilities, scenario analysis, presentation flexibility and external bench-marking (Velcu-Laitinen and Yigitbasioglu, 2012). The study performed by these authors reveals there is a positive correlation between drill-down features and productivity.
The data-ink ratio has been proposed by Yigitbasioglu and Velcu (2012), which measures the proportion of ink used to represent data to the total ink used to print. The goal of this mea-sure is to avoid redundant visual information. The use of gridlines and labels as visual aids leads to unbiased decision making (by avoiding visual illusions in graphs), but, simultaneously, con-tents which distract the users from the key dashboard information - ’chart junk’ (Archambault et al., 2015) - should be avoided (Vilarinho et al., 2018). Visual alerts can help identify perfor-mance indicators that went out of range an need immediate attention (Yigitbasioglu and Velcu, 2012). The use of colors has to be cautious and strategical, too, - analogous, complimentary or monochromatic palettes maximize the visualization’s effectiveness - and 3D objects must be avoided, as they may lead to confusion and hinder comparisons (Archambault et al., 2015).
The same authors also illustrate that different types of information require different visu-alization formats in order to be effective. While graphs are more useful for tasks that require identifying and understanding relationships, making forecasts, comparisons and pattern recogni-tion, tables are more suitable for tasks that require extracting and/or comparing specific values. In order to avoid misinterpretation of graphs, it is important that they are well labelled (Yigitba-sioglu and Velcu, 2012).
Sedrakyan et al. (2019) expand this idea and outline the most appropriate visualization tech-niques for each aim: columns or lines are most indicated to show trends; comparisons are best established through area, bars, bullets, columns, lines or scatter; relationships are visualized through lines or scatter; bars, box plots or columns picture distributions and compositions are
2. Theoretical Background
to be illustrated by donuts, pies, stacked bars or stacked columns. At this point, the theory of perception suggests that people are much more sensitive to lengths than to angles, which is why bars are more indicated than pie charts.
As the business’ and company’s environment is dynamic, literature advises to go with flex-ible dashboard solutions that enable easy upgrades (Yigitbasioglu and Velcu, 2012), as well as allowing a certain degree of customization (Sedrakyan et al., 2019; Vilarinho et al., 2018).
Chapter 3
Problem Description
In this chapter particular processes and designations, which are crucial to a comprehensive understanding of Farfetch’s business model, are presented.
3.1
Ordering Process
Farfetch’s partners are either boutiques, brands or warehouses. Each of them has specific characteristics, targets and strategical relevance, but they all will be designated as partners along this project. Whenever needed, further clarification will be provided.
When a client places an order on Farfetch website, the order is allocated to a specific partner, which has the ordered product in stock. When there are several partners in this condition, an algorithm allocates the order considering the product’s cost (extra shipping costs), the expected time to delivery at the client’s house and, lastly, the partners’ past performance. The item’s price is always the first criterion for partner allocation.
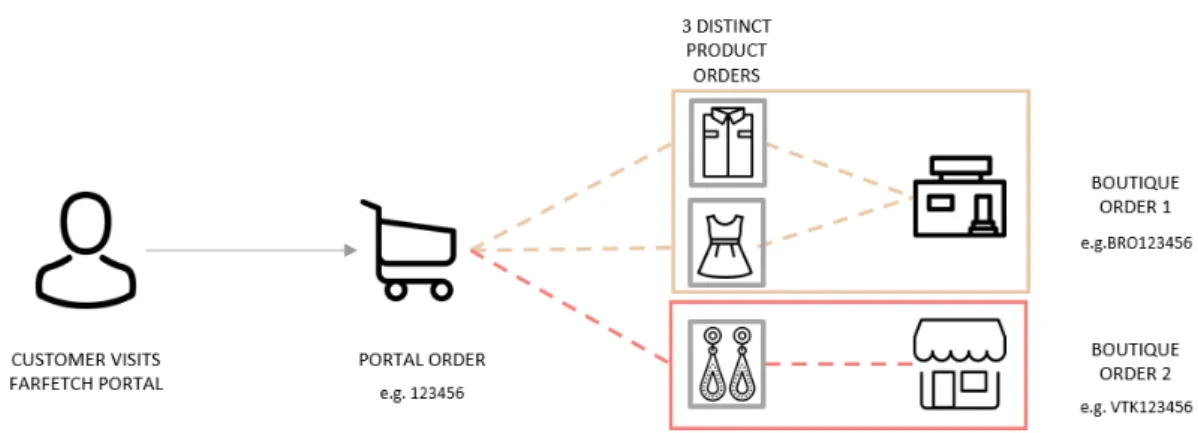
A customer only knows which Farfetch partner fulfilled the order at the time of delivery -reason why Farfetch is a marketplace, and not an e-retailer. If the order contains more than one product, it is possible that they are shipped from different partners, which means that they will probably not arrive at the client’s house at the same moment, too. In this case, it is necessary to understand the difference between Portal Order, Boutique Order and Product Order. Figure 3.1 illustrates the difference.
3. Problem Description
Figure 3.1: Difference between portal orders and boutique orders
Th example shown in Figure 3.1. presents an order of three products made by a single customer. Two of the products are shipped from the same boutique, while the third is shipped from a different one.
In terms of identification, the Boutique Order Code is the Portal Order Code preceded by the boutique’s initials. Each product order corresponds to a single product, belonging to a boutique order. In Farfetch’s databases, a portal order corresponds to an OrderSiteID, a boutique order is identified by an OrderCodeID and a product order is referred to by an OrderLineID.
Once an order is placed by a customer, an Estimated Delivery Date (EDD) is automatically sent by e-mail, together with the order’s code and receipt, as a range of days. This estimation takes only the shipping option (DHL Express, DHL Standard, UPS Express, UPS Standard,...) into consideration and ignores the shipping route, except for the cases where the shipping coun-try is China or Brazil, due to operational constraints entering these two countries.
If a client places an order, which will be fulfilled by a partner in Milan, and wants to have one item shipped to his residence in France and the other to his residence in New Zealand, the displayed EDD will be the same. There is an ongoing project, which intends to include routing in the EDD calculation.
At the same time, the placed order starts its flow through six different steps (see Figure 3.2) it necessarily goes through before arriving at the customer’s house. Farfetch is responsible for the steps associated with the order control, while the ones involving physical activities, are the partners’ responsibility.
Exceptions can be created by partners in steps 1, 3 and 5, reporting unexpected situations that may occur during the ordering process, in an attempt to not prejudice the partners’ indicators if something happens that delays the ordering process, but that is not their fault. Exceptions result in the order being on hold until the exception is solved. The procedure to solve and analyze ex-ceptions involves several teams, including the Supply Chain team, which ultimately determines
3.1. Ordering Process
if an exception is valid. In that case, the partners’ indicators are subsequently recalculated sub-tracting to the Speed of Sending the time interval it took to solve the exception. There are 13 possible exceptions.
The current order processing flow is shown in Figure 3.2.
Figure 3.2: Process Ordering Flow
A detailed description of each step is provided next. For better comprehension, the process swim lane of each step is presented in Appendix A.
3.1.1 Step 1 - Check Stock
The first stage of the order processing is the partner’s stock confirmation. Most of the com-pany’s partners are boutiques which, besides selling their luxury goods online, also sell them offline. Therefore, and being related to not instantaneous stock synchronization, a ’No Stock’ situation may occur. In this case the lack of stock on the demanded product is communicated to Farfetch, which checks if other partners have the product. If this is the case, a so called Item Swapis carried out with the client never knowing about it. A child order is created and the parent one is canceled.
In the opposite situation, if the ordered product is not available at all, Farfetch contacts the customer, explains the situation, suggests similar products (by partner’s suggestion) and, eventually, performs a refund, depending on the client’s demands.
Price increases due to ’Item Swap’ are held by Farfetch and the ones due to ’Suggest an Alternative’ (see subchapter 3.2.2) are sustained by the partner. Due to the partners’ greater costs, alternative suggestions are unusual.
3.1.2 Step 2 - Check Payment
The Fraud Team is responsible for step 2, and, although it theoretically comes after step 1, it is usually performed in parallel with its predecessor. As soon as the order is placed, it is automatically checked if the customer is in the so called Blacklist, the White List or none of them. White List customers are those who have a confirmed, secure and reliable payment source; Blacklist customers are those associated with a distrustful one.
Blacklist clients’ orders are automatically cancelled and white list ones’ automatically proved; the remaining customers are evaluated and depending on their suspicion they are ap-proved or go through ’Under Investigation’ process. In some cases, it can be necessary to di-rectly contact the customer to request a Proof of Billing by phone. When the order is not reliable,
3. Problem Description
the fraud analysts cancel the order, reporting the reason for cancellation and adding the suspect to the Black List.
3.1.3 Step 3 - Decide Packaging
In the third step, partners use an internal application to consult Farfetch’s package recom-mendation and select the package(s) to be used for each order.
It is also partners’ responsibility to guarantee an unique and luxury customer experience, which includes a perfect unboxing experience. Thus, the package shall be adequate for the product it contains, and, eventually, include customized details.
Farfetch provides advice about the boxes partners shall use to pack each range of products. However, partners are not obliged to follow these instructions and can set a new box if it is required, creating an exception called ’Product Packaging Issue’.
All packaging boxes are supplied by an external company. Based on the sales forecasts provided by Farfetch, the partners are responsible for ordering their own packaging stock.
3.1.4 Step 4 - Create AirWay Bill
The fourth step consists on the creation of the shipping labels, which are indispensable for couriers to identify the delivery destination. An AirWay Bill is automatically created, unless there is any problem with the shipping information or legal restrictions. These have to be handled by the Delivery team. Historically, 95% of the orders take less than 2 hours to pass Step 4.
3.1.5 Step 5 - Send Parcel
When the shipping label is ready, the order is pushed forward to Step 5 to be collected by the courier. If the partner does not have a scheduled, daily pick up, Farfetch’s system automatically books it, usually for the next day.
During this process, partners can, again, create exceptions in order to complain or inform about something that is not right (i.e. Courier failed to pick up the parcel).
Once the courier scans the package, the order is moved to Step 6.
3.1.6 Step 6 - Order is Sent
The sixth and last step starts when the courier collects the box and comprehends the stage when the parcel is in transit, ending when the order is delivered to the client.
Once the parcel is scanned, the company sends a confirmation email to the customer, spec-ifying the time the partner spent to process the order and the estimated time that will be spent by the courier to deliver the order. The carrier charges Farfetch a value based on the distance travelled and the volume/weight of the order.
3.2. Key Performance Indicators
The courier scans the order at the delivery point, too, and this log is afterwards used by Farfetch to evaluate overall performance.
3.1.7 Return Process
If a client is not satisfied with the purchased article, it is possible to return it within the next 14 days and get a refund. The most typical reasons to return are sizing, fitting or quality issues, description misguidance, the shipment of a wrong item or the customer having changed his or her mind. Several clients also buy the same article in more than one size to try them at home and return the one(s) that don’t fit.
The client can initiate the return process via phone call or through the website. The courier pick up is scheduled with the client, the courier scans the package at pick up time, and it is scanned again when it arrives at the partner. Afterwards, there is a 48h period where the boutique has the chance to accept or contest the return - the latter case may occur due to a late return, a damaged item or others. If the partner accepts the return, the refund is at its cost; otherwise, the refund is at Farfetch’s cost and the item is sent to Farfetch, to be either resold at a symbolic value or given to charity.
3.2
Key Performance Indicators
The Supply Chain team uses a set of five main KPIs to measure the system’s performance. A description of each is provided in the next subchapters.
3.2.1 Speed of Sending (SoS)
Speed of Sending is a metric that measures the total time elapsed between an order’s creation and the package’s scan by the courier at the end of Step 5.
This description corresponds to SoS Gross. However, as there are events that are not con-trolled by the partners, such as the existence of weekends or holidays and the accomplishment of steps 2 and 4, SoS Gross is not always a fair performance indicator. Therefore, SoS Net is also evaluated, representing the time elapsed between the order’s creation and the package’s scan at the end of step 5, less the time spent in all steps that are not controlled by the boutique (Step 2 and Step 4), the time spent on weekends and holidays and the time where the order may be held by factors external to the partner (approved exceptions).
The calculation formulae are presented in the following equations.
SoS Gross = Courier Scan Date - Order Creation Date (3.1) SoS Net = Time Spent in Steps 1,3 and 5 - Time Spent on Weekends
3. Problem Description
The percentage of orders sent in less than 1 day (24h) and in less than 2 days (48h) are also measured by the company, and global targets are defined for both metrics - the Service Level Agreements (SLAs). The partners’ performance is evaluated considering, among others, their SoS Less Than 2 Days (see subchapter 3.6.2).
3.2.2 No Stock (NS)
No Stock is a complementary way of measuring the partners’ alignment with the excellence experience Farfetch wants to provide to customers. Once again, both No Stock Net and Gross are measured.
No Stock Net represents the percentage of ordered items canceled due to a lack of stock on the total items sold, in a particular time frame. No Stock Gross adds the Suggest an Alternative feature to the calculation - whenever a partner cannot accept an order due to a lack of stock and an ’Item Swap’ is not possible, it has the possibility of suggesting an alternative product, that may or not suit the client. If the client accepts the suggestion, the order follows its normal processing path; if not, a No Stock is declared. The Suggest an Alternative hypothesis occurs only after all partners’ stock has already been assessed.
The following equations display the calculation method of these metrics.
NS Net=Nr o f No Stock Occurrences
Nr o f Orders Sent (3.3)
NS Gross=Nr o f No Stock Occurrences + Nr o f SaA Accepted
Nr o f Orders Sent (3.4)
These metrics have a high negative impact on the customer experience, as a No Stock occur-rence often leads to a lost sale.
3.2.3 Perfect Order Fulfillment (POF)
POF considers all product orders that were received by customers, and counts the ones which arrived on time (according to the EDD sent by e-mail at the time of the purchase) and with the right article.
The Supply Chain Council describes POF as ’the percentage of orders delivered to the right place, with the right product, at the right time, in the right condition, in the right package, in the right quantity, with the right documentation, to the right customer, with the correct invoice. Failure to meet any of these conditions results in a less than perfect order’(Dwyer, 2008).
Therefore, this metric’s calculation is currently incomplete, as new features and conditions such as the No Stock evaluation should be included.
3.2. Key Performance Indicators
POF=Orders which arrived Just In Time and weren
0t returned due to W rong Item
Total Nr o f Delivered Orders (3.5) 3.2.4 Order To Delivery (O2D)
O2D, or Lead Time (LT), describes the time elapsed between the order’s creation in the online platform and the order’s delivery at the client’s house. It comprises all the six steps described earlier and gives a particularly accurate insight on the clients’ experience with Farfetch in terms of the time the client was kept waiting for the order. O2D formula is presented next.
O2D = Order Received Date - Order Creation Date (3.6) Delivery Outliers are excluded from this calculation. The evaluation whether a product order is to be treated as a Delivery Outlier involves three considerations and is computed as following:
case when [GoodDataQuality] = 'Yes'
and [OutlierSOS]= 'No'
and [OutlierTT] = 'No'
then 1 else 0 end as [DeliveryOutlier?]
A product order record is considered to be of good quality when the respective tracking information is integrated in Farfetch’s system; if there is manually inserted information, data is excluded for not being reliable.
Whether a product order is a SoS or a TT outlier, depends on if the values fall, respectively, outside the range given by the following equations.
SoS= µ ± 3σ (3.7)
T T = µ ± 3σ (3.8)
A previous data treatment is necessary in order to consider outliers by route and by ser-vice (standard or express), rather than globally, as these two features influence the SoS and TT average, as well as their distribution.
3.2.5 Forecast Accuracy (FA)
Farfetch forecasts the sales volume for the next seven weeks, both per partner and for the overall company’s sales volume. The weekly FA metric compares the forecasted volume from four weeks earlier with the actual sales volume on a particular week, through measuring the effectuated Mean Absolute Percent Error (MAPE).