i
Rooftop-Place Suitability Analysis for Urban Air Mobility Hubs:
A GIS and Neural Network Approach
ii
Rooftop-Place Suitability Analysis for Urban
Air Mobility Hubs:
A GIS and Neural Network Approach
Dissertation supervised by Joel Dinis Baptista Ferreira da Silva, PhD
NOVA Information Management School Universidade Nova de Lisboa
Lisbon, Portugal
and co-supervised by
Roberto André Pereira Henriques, PhD NOVA Information Management School
Universidade Nova de Lisboa Lisbon, Portugal
Carlos Granell Canut, PhD GEOTEC
Universitat Jaume I Castellón, Spain
iii
Declaration of Originality
I declare that the work described in this document is my own and not from someone else. All the assistance I have received from other people is duly acknowledged and all the sources (published or not published) are referenced.
This work has not been previously evaluated or submitted to NOVA Information Management School or elsewhere.
Lisbon, February 24, 2020 Carlos Javier Delgado Gonzalez
iv
Acknowledgments
First, I want to express my gratitude to the three supervisors, since without a doubt their contributions were crucial to the improvement of this thesis. I want to thank Dr. Joel Silva for his patient guidance, encouragement, and opportune support throughout the development of this research. I want to thank Professor Roberto Henriques because his office was always open to any concerns that arose in addition to his advice for enhancing the document. I would like to thank Professor Carlos Granell also for his pertinent feedback, advice, and motivation to consolidate the document in the best possible way.
Additionally, I also want to thank Professors Marco Painho and Sara Riveiro for also giving me their unconditional advice and support whenever I needed it. I want to thank my classmates, who also encouraged me to get ahead in this research, especially Itza, Maicol, Mihail, Moritz and Vicente.
I would like to state my sincere gratitude also to the Erasmus Mundus Master Program of Science in Geospatial Technologies headed by Professors Marco Painho, Christoph Brox, Christian Kray, Joaquin Huerta, and Michael Gould. Having received an Erasmus scholarship to be part of this wonderful program is one of the most rewarding experiences of my life.
Finally, I want to thank all my family, who has always believed in me. Especially to my parents Gloria and Carlos, because despite the thousands of kilometers that separate us, their constant support and words of encouragement were vital to give my best and thus achieve such desired goal.
v
“The application of GIS is only limited by the imagination of those who use it” ________________________ Jack Dangermond
vi
Rooftop-Place Suitability Analysis for Urban Air
Mobility Hubs:
A GIS and Neural Network Approach
Abstract
Nowadays, constant overpopulation and urban expansion in cities worldwide have led to several transport-related challenges. Traffic congestion, long commuting, parking difficulties, automobile dependence, high infrastructure maintenance costs, poor public transportation, and loss of public space are some of the problems that afflict major metropolitan areas. Trying to provide a solution for the future inner-city transportation, several companies have worked in recent years to design aircraft prototypes that base their technology on current UAVs. Therefore, vehicles with electrical Vertical Take-Off and Landing (eVTOL) technology are rapidly emerging so that they can be included in the Urban Air Mobility (UAM) system. For this to become a reality, space agencies, governments and academics are generating concepts and recommendations to be considered a safe means of transportation for citizens. However, one of the most relevant points for this future implementation is the suitable location of the potential UAM hubs within the metropolitan areas. Since although UAM vehicles can take advantage of infrastructure such as roofs of buildings to clear and land, several criteria must be considered to find the ideal location.
As a solution, this thesis seeks to carry out an integral rooftop-place suitability analysis by involving both the essential variables of the urban ecosystem and the adequate rooftop surfaces for UAM operability. The study area selected for this research is Manhattan (New York, U.S), which is the most densely populated metropolitan area of one of the megacities in the world. The applied methodology has an unsupervised-data-driving and GIS-based approach, which is covered in three sections. The first part is responsible for analyzing the suitability of place when evaluating spatial patterns given by the application of Self-Organizing Maps on the urban ecosystem variables attached to the city census blocks. The second part is based on the development of an algorithm in Python for both the evaluation of the flatness of the roof surfaces and the definition of the UAM platform type suitable for its settlement. The final stage performs a combined analysis of the suitability indexes generated for the development of UAM hubs. Results reflect that 16% of the roofs in the study area have high integral suitability for the development of UAM hubs, where UAVs platforms and Vertistops (small size platforms) are the types that can be the most settled in Manhattan.
vii
The reproducibility self-assessment of this research when considering Nüst et al. [45] criteria (https://osf.io/j97zp/) is: 2, 1, 2, 1, 1 (input data, preprocessing, methods, computational environment, results). GitHub repository code is available in
viii
Keywords
Artificial Neural Network Catchment Area
Census Block Cluster
Driving Distance
Electrical Vertical Take-off and Landing Flatness
Geographical SOM K-means
Light Detection and Ranging Machine Learning Neuron Parallel Processing Points-Of-Interest Python Rooftop Self-Organizing Maps Suitability Analysis U-Matrix
Unmanned Aerial Vehicles Urban Air Mobility
Vertihub Vertiport Vertistop
ix
Acronyms
AHP Analytic Hierarchy Process ANN Artificial Neural Network ATC Air Traffic Control
BMU Best Matching Unit
EASA European Aviation Safety Agency eVTOL Electrical Vertical Take-off and Landing FAA Federal Aviation Administration
FTP Transfer Protocol Files
GDAL Geospatial Data Abstraction Library GeoSOM Geographical Self-Organizing Maps GIS Geographical Information Systems LAS LASer format for point clouds LIDAR Light Detection and Ranging
MOD Mobility On-Demand
NASA National Aeronautics and Space Administration
OSM Open Street Maps
PAV Personal Air Vehicles
PM Particulate Matter
POI Points-Of-Interest
RANSAC Random Sample Consensus
SOM Self-Organizing Maps
SQL Structured Query Language
UAM Urban Air Mobility
UAS Unmanned Aerial Systems
x
Index of the Text
Acknowledgments ... iv
Abstract ... vi
Index of Tables ... xii
Index of Figures ... xiii
1. Introduction ... 1
1.1 Problem statement and motivation ... 1
1.2 Research Questions ... 3
1.3 Objectives ... 3
1.4 Assumptions ... 3
2. Literature Review ... 4
2.1 Urban Air Mobility ... 4
2.1.1 Special Factors for Urban Air Mobility ... 5
2.1.2 Urban Air Mobility platforms ... 6
2.2 Review of Place Selection Methods for UAM platforms ... 7
2.2.1 Place Selection Approach ... 7
2.2.2 Rooftop Shape Identification Approach ... 8
2.3 Self-Organizing Maps: SOM and GeoSOM ... 8
3. Methodology ... 11
3.1 Data and Study Area ... 12
3.1.1 Study Area ... 12
3.1.2 Data Description ... 13
3.1.3 Data preprocessing ... 17
3.2 Place Suitability Analysis ... 18
3.2.1 Proximity Features Extraction ... 18
3.2.2 Clustering algorithms: SOM, GeoSOM, k-means... 19
3.2.3 Classification of Place Suitability Levels... 22
3.3 Rooftop-Flatness Assessment ... 23
3.3.1 Rooftop Elevation Statistics Calculation ... 23
xi
3.3.3 Rooftop Suitability Categorization ... 25
3.4 Combined Categorization of the Suitability Indexes for UAM Platforms ... 26
3.5 Hardware and Software ... 27
4. Results and Discussion ... 29
4.1 Site Suitability Analysis ... 29
4.1.1 Driving Distance Calculation ... 29
4.1.2 SOM Clusters ... 31
4.1.3 GeoSOM Clusters ... 34
4.1.4 Visual Comparison of Cluster Results ... 37
4.1.5 GeoSOM Clusters Description ... 38
4.1.6 Place Suitability Levels Using GeoSOM Clusters... 44
4.2 Rooftop Flatness Assessment Results ... 46
4.2.1 Rooftop Statistics Results ... 46
4.2.2 Rooftop Flatness Assessment Results ... 47
4.2.3 Rooftop Suitability Analysis ... 52
4.3 Final suitability categorization for UAM Platforms ... 55
4.4 Algorithm Performance Considerations ... 60
5. Limitations and Future Work ... 61
6. Conclusions ... 62 7. Bibliographic References ... 64 Annex 1 ... 71 Annex 2 ... 76 Annex 3 ... 77 Annex 4 ... 80 Annex 5 ... 87
xii
Index of Tables
Table 1. Environmental and socio-economic variables description ...13
Table 2. POIs and Rooftop Assessment inputs description ...14
Table 3. Area ranges proposed for the categorization of UAM platforms ...25
Table 4. Main software and libraries used for the place suitability analysis ...27
Table 5. Main software and libraries used in the rooftop suitability analysis ...28
Table 6. Example of new proximity attributes calculated by using Driving Distance algorithm for a specific census block ...31
Table 7. Best input parameters configuration selected for SOM ...32
Table 8. Summary table showing the distribution of census blocks in each place suitability index per GeoSOM clusters ...46
Table 9. Table of results for the second part of the algorithm for the flatness rooftop assessment ...48
Table 10. Total potentiality of the rooftops by counting the usable surfaces available ...52
Table 11. Summary table showing the distribution of rooftops in each roof suitability index ...55
Table 12. Distribution of the rooftops in the final categorization of suitability for UAM platforms ...57
Annex 1 Table A- 1. Different parameter settings used for the sensitivity analysis of the SOM algorithm execution ...71
Annex 2 Table B- 1. Distribution of integral suitability per UAM platform type ...76
xiii
Index of Figures
Figure 1. General Methodology ...11
Figure 2. Study Area ...12
Figure 3. Environmental variables geo-visualization ...15
Figure 4. Socio-economic variables geo-visualization ...15
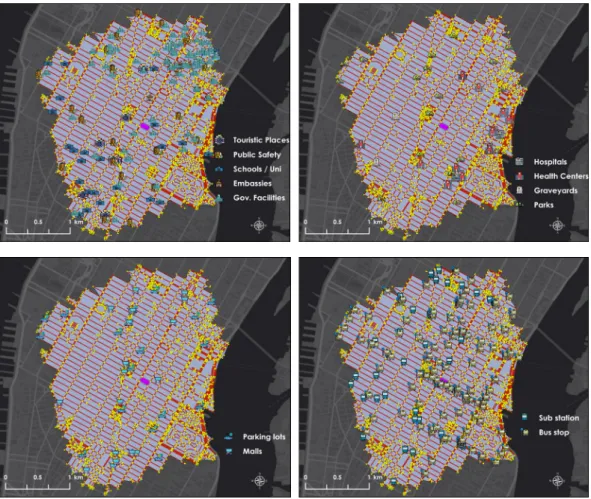
Figure 5. POI variables geo-visualization ...16
Figure 6. LIDAR tiles used in the rooftop flatness assessment ...17
Figure 7. Example of the proximity features extraction process. (a) Selection of closest node to each POI and census block. (b) Selection of all possible nodes within 2km Driving Distance. (c) Selection of the shortest path to each POI type from the census block node ...19
Figure 8. Example U-Matrix 5x5 neurons. (a) U-Matrix distances visualization (b) U-Matrix hints visualization ...20
Figure 9. Strategy for the visualization of the initial clusters through cluster projection per neuron from a U-Matrix base-line ...21
Figure 10. Scheme for the categorization of Place Suitability Levels for each of the n clusters calculated ...23
Figure 11. Main steps for rooftop flat surfaces extraction ...24
Figure 12. Example of attributes calculated by the algorithm in each of the main roof surfaces ...26
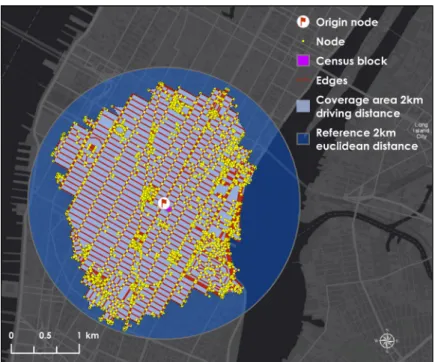
Figure 13. Coverage area obtained after executed Driving Distance algorithm at a distance of 2km for a specific block ...29
Figure 14. Visualization of the reachable POIs obtained after using Driving Distance algorithm ...30
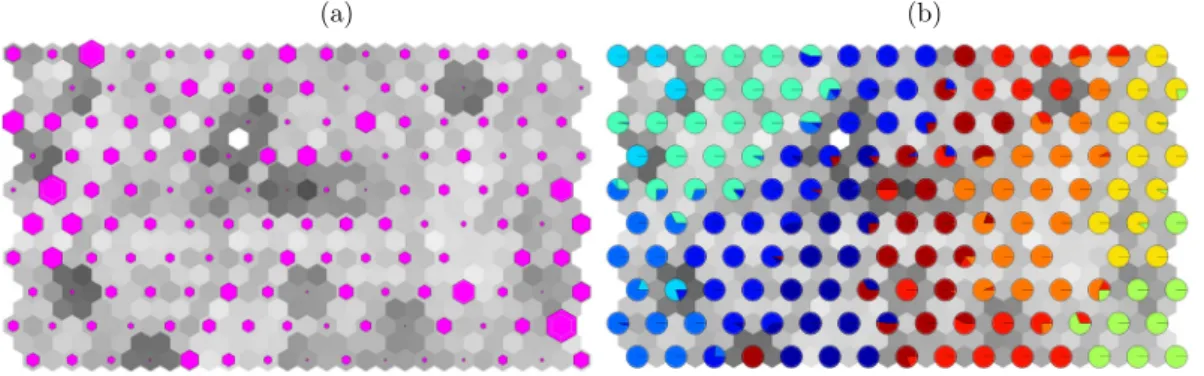
Figure 15. (a) SOM U-Matrix 10 x 15 obtained with best parameter configuration, (b) Reflected training pattern proportions from the 10 base-line clusters ...32
Figure 16. SOM Box-Histo for the 10 base-line clusters ...33
Figure 17. U-Matrix generated for the new 8 SOM clusters...33
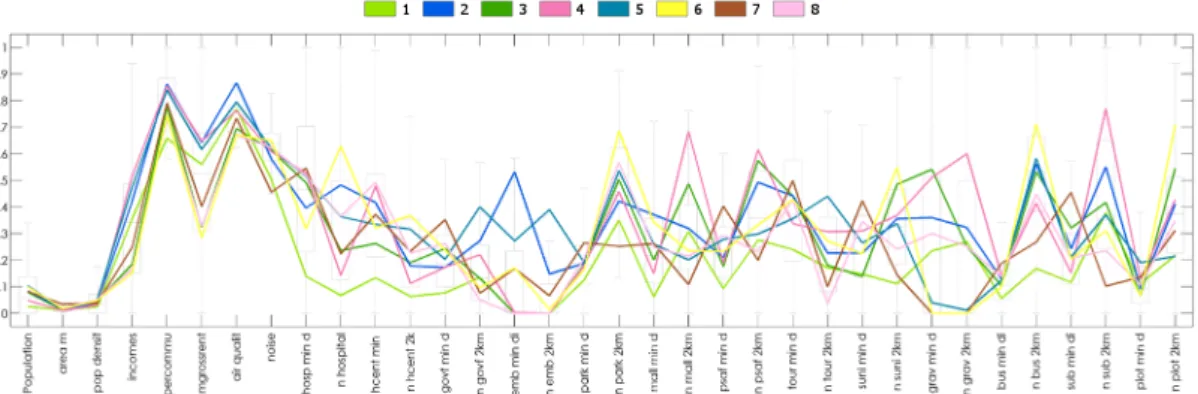
Figure 18. Box-Histo of the normalized variables for each of the 8 SOM clusters ....34
Figure 19. Manhattan census blocks clustered by SOM algorithm ...34
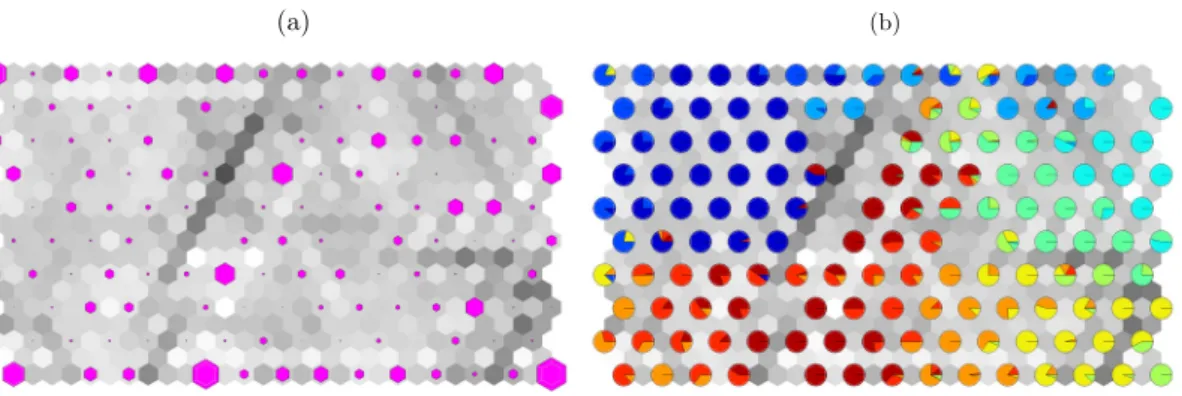
Figure 20. (a) GeoSOM U-Matrix 10 x 15 obtained with best parameter configuration, (b) Reflected training pattern proportions from the 10 base-line clusters ...35
Figure 21. GeoSOM Box-Histo for the 10 base-line clusters ...35
Figure 22. U-Matrix generated for the new 8 GeoSOM clusters ...35
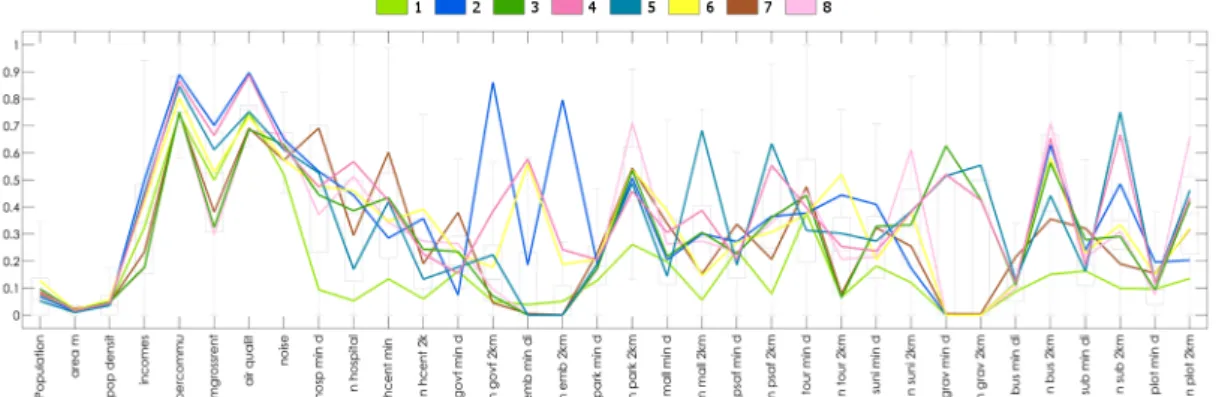
Figure 23. Box-Histo of the normalized variables for each of the 8 SOM clusters ....36
Figure 24. Manhattan census blocks clustered by GeoSOM algorithm ...36
Figure 25. Map comparison from clusters generated using SOM, GeoSOM, and k-means ...37
xiv
Figure 26. Bar-charts non-normalized variables (a) population density (b)
population ...40
Figure 27. Bar-charts non-normalized variables (a) Percentage of workers that commute more than 60 minutes one-way, (b) Area km2 ...41
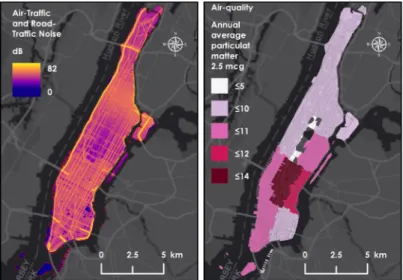
Figure 28. Bar-charts non-normalized variables (a) Road-traffic and air-traffic noise, (b) Air-quality ...41
Figure 29. Bar-charts non-normalized variables (a) Median household incomes, (b) Medium Gross Rent ...41
Figure 30. Comparative bar-charts for the number of POI present in each GeoSOM cluster ...42
Figure 31. Comparative box-plots for the minimum distance to POI in each GeoSOM cluster ...43
Figure 32. Place suitability map for Manhattan ...44
Figure 33. Census blocks proportions of place suitability levels per GeoSOM clusters ...45
Figure 34. Distribution of census blocks in each place suitability index per GeoSOM clusters ...45
Figure 35. Maps of rooftops height statistics ...47
Figure 36. Roof 1 (a) Lidar image with main surface, (b) satellite image, (c) 3D scene ...49
Figure 37. Roof 4 (a) Lidar image with main surface, (b) Satellite image, (c) 3D scene ...49
Figure 38. Roof 7 (a) Lidar image with main surface, (b) Satellite image, (c) 3D scene ...49
Figure 39. Roof 2 (a) Lidar image with main surface, (b) Satellite image, (c) 3D scene ...49
Figure 40. Roof 5 (a) Lidar image with main surface, (b) Satellite image, (c) 3D Scene ...50
Figure 41. Map distribution for UAM Platforms typology using the main surface level ...51
Figure 42. Waffle-chart for UAM typology distribution at different surface levels ...51
Figure 43. Suitability Index map for UAV platforms ...53
Figure 44. Suitability index map for Vertistops ...53
Figure 45. Suitability index map for Vertiports ...54
Figure 46. Suitability index map for Vertihubs ...54
Figure 47. Distribution of the suitability index levels for each UAM platform type .55 Figure 48. Combined suitability taking the criteria of place and flatness of the main surface on the roofs ...56
Figure 49. Total of rooftops distributed for each combined suitability class ...57
Figure 50. Proportions of combined suitability levels per UAM hub types ...58
Figure 51. Proportions of combined suitability levels per GeoSOM cluster ...59
xv
Figure 53. Operational mode when running subprocess library for the python
algorithm ...60
Annex 1 Figure A- 1. Component Planes from SOM algorithm part 1 ...72
Figure A- 2. Component Planes from SOM algorithm part 2 ...73
Figure A- 3. Component Planes from GeoSOM algorithm part 1 ...74
1
1. Introduction
1.1 Problem statement and motivation
The growing overpopulation and urbanization in metropolitan cities in the world have generated several transport-related challenges in the field of urban mobility [49]. Furthermore, the proliferating private car dependency and high levels of spatial aggregation of economic activities are leading to significant traffic congestions [16, 47]. Additionally, recent Mobility On-Demand (MOD) schemes such as ride-sharing and car-sharing as those implemented by Uber and Lyft, have contributed to increasing levels of traffic density on some urban areas while trying to solve limited parking lots issues [16, 18]. Consequently, inner-city commute time has been meaningfully affected, where commuters in cities like Chicago, New York, and Los Angeles, on average, lose 97 hours a year due to traffic jams [29]. Several alternatives are proposed to relieve traffic congestions such as non-motorized mobility and promoting the use of public transportation. Nevertheless, these options require new infrastructures which are limited by the lack of space in densely-populated urban areas [19, 48]. In this way, all the above alternatives are summarized in solutions focused on a two-dimensional matrix [9].
As a novel solution, Electrical Vertical Take-off and Landing technology (eVTOL) aircraft are being designed and tested to become a feasible means of transport to inner-city commuting [9]. The new approach converges on a path that contemplates the three-dimensional space, which had previously been explored by the development of Unmanned Aerial Vehicles (UAV) [43, 44]. New elements are then added to the concept of Urban Air Mobility (UAM), which seeks to optimize inner-city commuting-times by avoiding existing traditional impedances generated on road networks [48]. UAM scope contemplates not only the transport of passengers but also freight modalities to open the door for multiple purposes [44]. Besides, the features and specifications of the new eVTOL vehicles are quite promising for their sustainability in an urban environment. Concepts issued by the manufacturers and consultancies show notable differences between an eVTOL aircraft and a traditional helicopter. eVTOL vehicles will be four times quieter, twice safer and ten times less expensive to build than traditional helicopters [48]. While several companies and investors work on the development of new, efficient, and comfortable prototypes of eVTOL vehicles, leading space agencies around the world generate regulatory policies for the use of these vehicles in UAM system [48]. National Aeronautics and Space Administration (NASA), European Aviation Safety Agency (EASA), and Federal Aviation Administration (FAA) are some of the entities that are currently declaring concepts for the proper implementation of UAM [40, 55, 64]. Process certification, battery technology, vehicle efficiency, performance and reliability, air traffic control, cost and
2
affordability, safety, noise, emissions, pilot training, and infrastructure in cities summarize the challenges to overcome towards UAM implementation [27]. Subsequently, in recent years the interest of academic and scientific communities in different fields has aroused to contribute to the implementation of UAM. Geospatial technologies have been involved in this contribution, especially when creating 3D geofences for the design of inner-city flight route networks [25] and finding suitable locations for UAM infrastructures [11, 15]. The latter excels in the complexity it handles by involving a synergy of different urban, social, economic and environmental concepts, which play an important role in defining potential UAM hubs locations. Notwithstanding, the fact that UAM concepts are addressed to be applied in densely populated urban areas for the improvement of transport quality leads to add an evaluation of the infrastructure present in the city. Therefore, the lack of sufficient space in metropolitan areas implies taking into account the typology in the UAM platform designs and sizes for its construction on the rooftops of buildings.
Although not much work has been developed on this subject, some academics have contributed by applying and evaluating geo-scientific approaches in search of this ideal location. A suitability analysis was generated for the cities of Los Angeles (United States) and Münich (Germany) under an expert knowledge approach [15]. Therefore, after applying an Analytic Hierarchy Process (AHP), the consensus of experts allowed us to evaluate the importance of the social-economic and environmental variables involved [15]. The resulting map reflects regions of suitability where UAM ground structures can be located. However, an exact location was not calculated by not considering physical availability structures for UAM platforms. In contrast, another approach to the location of suitable UAV sites for landing and clearing was performed when considering the physical structure of the roofs. The study was based basically on the classification rooftop images generated both from Light Detection and Ranging (LIDAR) data and using satellite images [11]. Machine-learning classification techniques were used to distinguish different roof shapes in training samples from three cities that were manually labeled. Results of the classification allow separating seven types of roof shapes where those that are flat are the most feasible for UAV landing and take-off [11]. Despite good results, this approach does not include urban socio-economic and environmental aspects, and also it is not extending the scope to evaluate the total rooftops use according to area specifications to build different UAM types.
In this order of ideas, this research seeks to establish an unsupervised-data-driven and GIS-based methodology to find out potential locations for the development of UAM hubs in Manhattan, New York City (U.S). The proposed methodological process aims to increase the level of detail in the location of potential UAM hubs by considering both a place suitability analysis given by the urban ecosystem variables and rooftop suitability analysis when evaluating physical characteristics of flatness and area available to delimit UAM platforms types.
3
1.2 Research Questions
This thesis formulated the following research questions:
• Where are the most suitable places to develop UAM hubs in the study area? • What is the potential suitability of the rooftops in the study area for the
development of different UAM platforms types?
• Is it possible to increase the level of detail in the location of suitable places to
develop UAM hubs in the study area?
1.3 Objectives
In order to achieve the formulated research questions, this thesis proposed the following specific objectives:
• Maximize the information provided by input variables for the place suitability analysis when extracting proximity features from urban Points of Interest (POI) through routing algorithms.
• Design and implement a place suitability analysis when applying Self-Organizing Maps to identify clusters with similar urban ecosystem patterns. • Develop an algorithm to estimate the suitability of the roofs when evaluating
the main existing flat surfaces and the potential UAM platform type that can be settled on them.
• Examine the results obtained by matching both proposed approaches.
1.4 Assumptions
The following assumptions were assumed for the development of this thesis:
• Up until now, a UAM system has not been officially implemented in any city in the world. Therefore no UAM structure has been materialized at present. • The feasibility of the development of UAM hubs is based on considerations
issued by space agencies, consultancies, manufacturers and academics who are exploring the future of UAM as an inner-city transport system.
4
2. Literature Review
2.1 Urban Air Mobility
Urban Air Mobility (UAM) is a “new” concept that seeks to gather all those air passengers and cargo-carrying transport systems within metropolitan areas by means of both manned and unmanned aircraft [44]. Nevertheless, it is a term that has been the evolution of several projects and ideas developed before. Concepts such as Personal Air Vehicles (PAV) and On-Demand Mobility (ODM) were mentioned by National Aeronautics and Space Administration (NASA) in 2006 [15, 40, 41]. Around 2007, thanks to the ODM idea, the concept of air-taxis was already emerging as a response to the increase in traffic congestion on the roads [27, 40]. NASA and Federal Aviation Administration (FAA) even began to formulate feasibility studies for the air-taxi market and factors related to Air Traffic Control (ATC) [40]. Its applicability has depended on the technological advances achieved especially in the field of Unmanned Aerial Systems (UAS). Today the reliability given by Unmanned Aerial Vehicles (UAVs) has been the reason for its proliferation in multiple purposes such as hobbyists, cargo-services, emergency care, defense, etc. Nevertheless, regulatory considerations for both UAM and UAS are being designed to improve the ATC [59]. Regarding the passenger transport in the UAM scheme, there are several academics, industries, and governments that are strengthening and promoting the sustainability of this inner-city and intra-city transport system as a new alternative of mobility [44]. Cutting-edge technological advances in the field of electronics and aeronautics have led to the development of designs and prototypes based on electrical Vertical Take-Off and Landing (eVTOL) technology. Several prototypes of eVTOL aircraft are being designed and tested in order to guarantee the four key realms of the vertical mobility ecosystem: aircraft systems, certification and law, social acceptance and infrastructure [48]. Ehang, Volocopter, Airbus Vahana, and SureFly have been the pioneers developing eVTOL aircraft prototypes since 2015 and testing them with successful flights in 2017 and 2018 [1, 2, 48]. Up until the development of this research, the most recent test recorded by Volocopter was at Helsinki airport in August 2019 [10, 64]. Another important manufacturer of eVTOL aircraft is the German startup Lilium. They have designed a Jet-type air-vehicle called LiliumJet which was first tested in May 2019. Its design is also based to fulfill with EASA and FAA standards [35, 46]. Amazon with Prime Air [30] design and Boeing giant cargo drone are exploring and testing new designs for the delivery of goods of different sizes. This adds to the many other uses that UAVs have nowadays. In summary, there is evidence of a variety of companies working hard to develop prototypes that meet the requirements of a vertical mobility ecosystem.
5
2.1.1 Special Factors for Urban Air Mobility
2.1.1.1 Socio-economic factors
One of the realm keys of the UAM is social acceptance towards the project [28, 48]. Therefore the community must understand the benefits and problems that can cause the implementation of a new mode of transport in the city. UAM tries to minimize this impact by considering that this new mobility model does not physically replace existing mobility structures [9]. In addition, some of the existing infrastructures will serve as a pivot for the realization of future inner-city mobility [9, 27]. Thus, the location of hospitals, metro stations, bus stops, trade centers, green areas and other Points-of-interest (POI) will work to establish the appropriate geospatial environment for future UAM infrastructures. Population must also know what are the mechanisms that will guarantee a safe and reliable means of transport [48]. Furthermore, the population needs to be a participant in the definition of routes and hubs. 3D geofences have been simulated by Hildemann et al. [25] reflecting possible conditioned areas for air-taxis transit. The delimitation of areas with high population density and job density are relevant to find the communities that can benefit from UAM [15]. In this way, not only potential users of cities should be considered in the studies, but also all citizens who participate in the inner-city mobility in general [27, 48]. Sustainability studies of the UAM show favorable results especially for the passenger market [48] however, affordability will play an important role at the beginning of the implementation of UAM system. Therefore, spatially identifying variables related to income, job density, and mode of transport used to get job place could support the location of UAM infrastructure [15, 48]. Additionally, it is relevant to understand the cost of both monetary and time travel of commuters using similar transport systems. One of the most viable market schemes is the operation of air taxis under an on-demand approach [43]. Nevertheless, there might be other schemes which interest investors. Airport shuttle, air-ambulance, police, company shuttle and office-to-office travels, cargo-delivery are some of the potential UAM markets [43]. Another interesting approach was established by Fadhil 2018 [15] by involving office rental prices as an estimation for business trips. Potential demand for UAM could be located where rental prices are higher, leading to probable settlements of UAM structures [15].
2.1.1.2 Environmental factors
Noise pollution is one of the most worrisome variables when implementing eVTOL vehicles [9, 27, 48, 56]. Although according to the concepts, eVTOL aircraft generate less noise than helicopters, there will be an increase in noise levels in certain parts of the city [48]. Nevertheless, manufacturers and experts estimate that noise levels may be similar to those that a half-size truck can emit [27]. An eVTOL aircraft 90 meters from the ground can emit about 63dB measured at ground level [27, 48]. This could be considered "acceptable", but there are other implications that should be studied.
6
Therefore, this leads to recognizing the relevance of the noise variable in geospatial analysis for UAM infrastructure settlement. An important idea to mitigate noise was designed by Ancliff et al. [4] when trying to enhance paths for eVTOL aircraft when considering areas with high existing noise. In this way, highways and main roads of the city could function as noise absorption zones caused by the propulsion of the vehicles [4]. Consequently, areas with high emissions of particulate matter (PM) will indicate the presence of hot-spots where the development of UAM systems by implementing eVTOL technology would improve the urban air quality [43, 52]. Other environmental factors may be related to the presence of birds [56] and weather conditions that would limit the traffic of UAM vehicles.
2.1.2 Urban Air Mobility platforms
Keeping a successful business model for UAM requires an adequate infrastructure for the operation of eVTOL vehicles [9, 48]. Not only landing and take-off platforms should be considered, but battery charging infrastructures, ATC for surveillance and maintenance areas should be considered [9, 60]. Thus, the objective is to find strategic places for the development of both ground-based and rooftop structures for landing and take-off [9]. Notwithstanding, adverse conditions in highly populated cities can make it difficult to analyze, especially due to the availability of space [60]. Several concepts have been stated to classify the type of infrastructure necessary for the definition of the UAM infrastructure network. Uber Elevate [27] refers to Vertiports and Vertistops as the main types of infrastructure needed for eVTOL operations. Vertiports are considered as areas with multiple landing and clearance platforms for eVTOL vehicles [27, 43, 48]. In addition, they must have enough space to establish facilities that support maintenance, recharging, and staff [27, 48]. Uber Elevate [27] estimates Vertiports would have a maximum capacity of 12 eVTOL aircraft taking as an example the current heliports in New York. On the other hand, Vertistops are considered as a platform with a single pad for the landing and clearing of an eVTOL [48]. According to Uber Elevate [27] the advantage of these platforms is given by the fast embarkation and disembarkation of passengers but without the presence of complex support facilities. Fadhil [15] designed another category of a platform called Vertihub, which is considered as the biggest. These platforms could also have facilities for repair and maintenance, in addition, they would serve as parking for eVTOL vehicles [15]. Regarding UAVs there are no fixed specifications for the size of landing pads for traditional UAVs; however, portable landing pad designs range from three square meters depending on the drone size.
7
2.2 Review of Place Selection Methods for UAM platforms
Although several studies and investigations related to site selection analysis or place suitability analysis have been developed, only a few have been applied to find out the location of UAM platforms specifically. However, a bibliographic review has identified two approaches, the first one given by the urban environment conditions of the place and the second one under physical roof characteristics as potential landing and clearance spots of UAM vehicles.
2.2.1 Place Selection Approach
Regarding UAM ground infrastructure, Fadhil [15] developed his research by implementing a suitability analysis under an Analytic Hierarchy Process (AHP) methodology with a Delphi analysis. Therefore, his analysis involved an expert knowledge approach to generate suitability maps for UAM infrastructure in the cities of Los Angeles and Münich [15]. Even though the generated maps allow to identify regions with different levels of suitability, the exact location where UAM platforms can be established is not defined [15]. Similar studies applied not specifically to UAM location stations but to nodes of transport networks have also been included in this review. Multi-Criteria and Single-Criterion models were analyzed by Viera [63] in the solution of Hub Logistic Problems. Within the Multi-Criteria models analyzed by Viera [63], methods such as AHP, Fuzzy sets, Weighted Sum, Topsis, Genetic algorithms among others are applied. Apart from expert knowledge approach methods such as those already mentioned, data mining techniques have been applied to find patterns in regions of urban areas that can later be categorized [39]. Strategic site locations have been carried out using Self-Organizing Maps (Chapter 2.3) to find co-location patterns when using road networks on co-location-based services approach [66]. Spatial accessibility analysis is another important component in site location. Therefore, the evaluation of travel distances between points of interest directly influences urban planning [34]. Calculation of Euclidean distance, walking distance, bicycle distance, and Driving Distance are some of the methods that Geographical Information Systems (GIS) applies to determine characteristics of proximity and optimal route [34]. Driving Distance has been used to show disparities and deficiencies in the inner-city public transport, which is a starting point for urban planning and city design [34, 51]. Smart cities look for transport nodes to have rapid accessibility to citizens by increasing connectivity in travel modes [8, 14, 38]. The design of transport nodes and urban route planning have been developed by applying Driving
Distance algorithms directly from databases. Although some GIS applications embed
routing tools, database add-ons such as pgRouting for PostgreSQL databases run robust routing analysis when using Open Source road networks [17]. Thus, the quality of road networks influences the speed and accuracy of the results. Open Street Maps
8
(OSM) and contributing groups such as Geofabrik offer free sufficient data from road networks with node attributes, edges, cost and other impedances in the road system.
Driving Distance algorithm from pgRouting library usually calculates distances when
implementing the Dijkstra algorithm, which allows generating a realistic simulation of the situation [36]. Algorithms have not only been used to calculate optimal routes but also to consider coverage areas or catchment areas based on distances [20].
2.2.2 Rooftop Shape Identification Approach
An interesting approach was the one developed by Castagno et al. [11] when implementing a methodology for the detection of suitable roofs so that UAV can land in case of emergency. Although this approach was not properly designed for eVTOL aircraft, it takes advantage of the use of high-resolution satellite images and 3D point clouds (LIDAR) to perform a rooftop shape classification [11]. Castagno et al. [11] methodology, takes rooftop LIDAR data which is transformed into RGB raster files by tripling the elevation information. Subsequently, the rasters are the input for a Convolutional Neural Network and Random Forest (Machine-Learning approach) algorithms that classify the images according to the shape features. However, the labeling of training samples is done manually [11]. Castagno's research leads to that image classification performed with LIDAR data generates better results than using satellite images, but a combination of the two approaches increases accuracy [11]. Despite obtaining a good classification of the roof shape, suitability for UAV landing pads is limited to finding flat roofs. There are other approaches to identify roof planes, nevertheless these are not aimed at assessing the flatness for landing and clearance of UAM platforms, but breaking down the planes that make up the roof. Specific algorithms such as Region-Growing and Random Sample Consensus (RANSAC) have been implemented by Albano [3] and Chen et al. [12]. Clustering techniques have also been used for plane roof segmentation, therefore k-means and fussy k-means have been applied for roof reconstruction [54]. Cross-line Element Growth is also a technique has been provided by Wu et al. [65] for fast and accurate delineation of planes under airborne LIDAR data.
2.3 Self-Organizing Maps: SOM and GeoSOM
Self-Organizing Maps (SOM) is one of the most recognized types of Artificial Neural Network (ANN) created by Kohonen which is designed for the extraction and visualization of patterns employing an unsupervised learning process [5, 31]. Therefore, SOM is considered as a Machine-Learning method that provides solutions to problems that are modeled under a data-driven approach [33]. Analysis of patterns and structures are achieved after SOM performs a data reduction task by projecting
high-9
dimensional data to a lower space that is usually two-dimensional or three-dimensional [22, 42]. The fact that the output space resulting from data reduction preserves topological relationships makes SOM a more powerful method compared to others i.e
k-means; in addition to allowing it to be applied for different purposes such as mining
data, data visualization, clustering, and classification [5, 6, 32]. The essential idea of SOM is that the output space that is usually a two-dimensional grid composed of units called neurons, can match the input patterns presented in the input space (training patterns) for the establishment of the Best Matching Unit (BMU). The BMU is the result of an iterative process where randomly an input pattern is presented to each of the SOM neurons, then distances are calculated, and the closest one is assigned as BMU [22]. Formula (1) explains the process to find the BMU, where x is the input vector, ‖ . ‖ it is generally Euclidean distance, mc corresponds to the SOM neuron and mi to the BMU neuron.
‖𝑥𝑥 − 𝑚𝑚𝑐𝑐‖ = 𝑚𝑚𝑚𝑚𝑚𝑚𝑖𝑖{‖𝑥𝑥 − 𝑚𝑚𝑖𝑖‖} (1)
After BMU is found all SOM neurons are updated and moved closer to training patterns in each iteration. The SOM update is given by the formula (2), where α(t) is the learning rate in specific t time and ℎ𝑐𝑐𝑖𝑖(𝑡𝑡) is the neighborhood function around
the BMU unit c.
𝑚𝑚𝑖𝑖 = 𝑚𝑚𝑖𝑖(𝑡𝑡) + 𝛼𝛼(𝑡𝑡)ℎ𝑐𝑐𝑖𝑖(𝑡𝑡)(𝑥𝑥 − 𝑚𝑚𝑖𝑖) (2)
There are several neighborhood functions between them: Bubble, Gaussian and
Cutgass [22]. These neighborhood functions include another parameter called the
neighborhood radius, which along to the learning rate decreases in each SOM update. Therefore, SOM is increasingly adjusting to training patterns by narrowing BMUs and their topological neighbors [22]. The SOM training process is carried out in two phases, unfolding and fine-tuning. Some of the SOM parameters are configured depending on the problem being evaluated; however, Henriques [22] explains some special considerations before the algorithm is executed. SOM quality can be evaluated through two errors, quantization error and topographical error [22, 32]. The first one is more oriented to measure the adaptive capacity of the neural network, while the second one assesses the topology preservation of the SOM [22].
On the other hand, GeoSOM is a variation of the SOM algorithm considering the natural geographical component of training patterns [22, 23]. In this way, the GeoSOM concept affects the BMU search for a certain training pattern by considering only geographically close neurons [7, 23]. Therefore, the entire selection process for the winning unit selection is carried out in two steps: Definition of the geographic
10
neighborhood and final search when considering remaining multidimensional components [7, 24]. BMU search is performed when the parameter “geographical
tolerance” k is set to zero (k=0), which forces the BMU to be that unit that is
geographically closest [24]. The fact that k is equal to zero describes a different scenario than when k increases its value since the search radius is amplified, and when k reaches the map size, a basic SOM then executed [7, 24]. Thus, GeoSOM outputs will have similar behavior to SOM training but only considering the spatial coordinates, which leads to each neuron working as a “low-pass filter” for other non-geospatial variables [23]. Several visualizations modes will then allow verifying that the GeoSOM approach yields the creation of clusters composed of geographically contiguous areas by forcing units that are close in the output space to be close in the input space [7, 24]. It is remarkable to mention that GeoSOM algorithm not only evaluates spatial homogeneity when considering spatial autocorrelation but also heterogeneous areas that although geographically may be close, non-geographic attributes might depict low correlation [24]. Furthermore, GeoSOM clusters can be used for different purposes in many thematic fields, such as urban and environmental planning [24].
11
3. Methodology
This chapter of the thesis introduces a description of the study area and the data used to carry out the investigation. Besides, to explain each of the main processes performed to carry out a rooftop-place suitability analysis for the development of UAM platforms. The overall methodology is separated into two sections; the first one is focused on establishing the place suitability analysis, while the second one seeks to assess the suitability of the rooftops. Once the results of both sections have been obtained, a combined suitability analysis is executed (Figure 1).
12
3.1 Data and Study Area
3.1.1 Study Area
The research study area focuses on the metropolitan district (borough) of Manhattan, in New York City, northeast of the United States. The borough includes the Manhattan island and other additional islands such as Roosevelt, Randall, Governor, among others. It has approximately 1.6 million inhabitants and an area close to 59.1 km2; therefore, it is the most densely populated district in the entire city. It
concentrates the majority of economic and financial activities of the city, in addition to having multiple historical and tourist sites.
13
3.1.2 Data Description
Most of the data used in the research try to align with the social, economic and environmental factors described in Chapter 2.1.1 for the ideal location of UAM platforms. Table 1 and Table 2 describes the main variables and data involved in both place suitability analysis and rooftop suitability analysis. Maps of the environmental variables are shown in Figure 3, socio-economic variables in Figure 4 and Points of Interest (POI) in Figure 5. In addition, Figure 6 shows the grid of the LIDAR files (tiles) available for the rooftop flatness assessment algorithm. Due to the high density of 3D point clouds, only a small section is depicted.
Type/Analysis Variables Description Source
Environmental variables for
Place Suitability
Analysis
Air-traffic and road traffic noise
Format: Raster Units: Decibels (dB)
U.S. Department of Transportation 2017.
National Transport Noise Map Air-quality (annual
average mcg per cubic meter of fine particulate matter)
Format: Table per community district. Units: mcg PM 2.5
NYC Department of Health and Mental Hygiene, Environmental and Health Data Portal. 2013. 3rd Edition
Socio-economic variables for Place Suitability Analysis Population
Format: Shapefile per Census block. Units: Number of people
NYC Open Data, 2010. Census Block Statistics.
Population density
Format: Shapefile per Census block. Units: Number of people/km2
NYC Open Data, 2010. Census Block Statistics.
Commute 60 Minutes Or More One Way
Format: Table per census tract. Units: % of workers
Census Bureau, American Community Survey. 2018 table B08012
Median household incomes
Format: Table per census tract. Units: $US
Census Bureau, American Community Survey. 2018 table B08013
Median gross rent
Format: Table per census track. Units: $US
Census Bureau, American Community Survey. 2016 table B25064
Census blocks
Format: Shapefile per Census block. (Polygon)
NYC Open Data 2010. Census Block Statistics.
14
Purpose Variables Description Source
Point of Interest for Place Suitability Analysis Hospitals Format: Shapefile
(Polygon) Open Street Maps 2018.
Health centers
Format: Shapefile
(Point) NYC Open Data 2011.
Parks
Format: Shapefile
(Polygon) Open Street Maps 2018.
Graveyards
Format: Shapefile
(Polygon) Open Street Maps 2018.
Schools/Universities
Format: Shapefile
(Polygon) Open Street Maps 2018.
Touristic places
Format: Shapefile
(Point) NYC Open Data 2018.
Public safety
Format: Shapefile
(Point) NYC Open Data 2017. Government
facilities
Format: Shapefile
(Point) NYC Open Data 2017.
Embassies
Format: Shapefile
(Point) Open Street Maps 2018.
Parking lots
Format: Shapefile
(Polygon) NYC Open Data 2018.
Malls
Format: Shapefile
(Point) Open Street Maps 2018.
Subway stations
Format: Shapefile
(Point) NYC Open Data 2019.
Bus stops
Format: Shapefile
(Point) NYC Open Data 2018.
Rooftop flatness assessment inputs Rooftop building footprint Format: Shapefile
(Polygon) NYC Open Data 2018.
Airborne LIDAR 3D cloud points
Format: LAS (LASer) Tiles
USGS New York City. Woolpert Organization from GIS.NY.GOV 2014.
15
Figure 3. Environmental variables geo-visualization
16
17
Figure 6. LIDAR tiles used in the rooftop flatness assessment
3.1.3 Data preprocessing
Preprocessing for the place suitability analysis consisted of joining all the information coming from socio-economic and environmental variables to the census blocks since this is the minimum unit of information for this analysis. Therefore, all alphanumeric information from tables was joined to census block identifiers. Besides, air-traffic and road-traffic noise information was also associated with the census blocks by averaging noise values through geoprocessing tools. Polygon-type POIs were transformed to point geometry upon finding the centroid; however, polygons with a significant extent such as parks were transformed when densifying the polygon with random-placed points through GIS tools. Before the execution of the SOM, GeoSOM and k-means algorithms (Chapter 3.2.2), data transformation was implemented due to the variability of measurement units for each of the input data involved in the analysis. Among the main transformation methods, Min-Max and Z-score normalizations were tested for the evaluation of spatial patterns from GeoSOM suite software. Furthermore, verification of null values and the potential presence of outliers was assessed. However, due to the nature of some variables, especially those generated after the proximity feature extraction process (Chapter 3.2.1), null values and possible
18
outliers were preserved throughout the analysis when considering their information was relevant for pattern identification. Regarding the suitability analysis for roofs, LIDAR data was downloaded through a Transfer Protocol Files (FTP), and organized in a folder for easy handling. LIDAR tiles were examined individually to verify the existence of the information, and in some cases, it was necessary to apply coordinate system transformation for proper geolocation. Outliers verification for elevation values was also performed before the calculation of elevation statistics for each of the rooftops (Chapter 3.3.1).
3.2 Place Suitability Analysis
3.2.1 Proximity Features Extraction
Driving Distance algorithm from pgRouting library (Chapter 3.5) is calculated for
proximity feature extraction, which allows expansion and maximization of the information available in the Manhattan census blocks. Therefore, vector geographic layers with dimension 0 (point type) for each of the POI categories are stored in
PostgreSQL database with PostGIS extension (Chapter 3.5). A routable Manhattan
road network is downloaded from Open Street Maps (OSM) through Geofabrick repository. Then by using osm2pgrouting (Chapter 3.5), the road network can be stored in the PostgreSQL database. This network is characterized by having information about the source nodes, destination nodes, edges, and cost. Census block centroids are also stored in the PostgreSQL database. Once the information is organized, the first step is to calculate the closest node to each element for the different POI types and census blocks by using Euclidean distance (Figure 7-a). In this way, new tables of closets nodes are generated for each geographical layer.
Subsequently, Driving Distance algorithm is executed by assuming a maximum distance of 2km from each closest node of the census blocks. The result is a new table with all possible nodes and edges that are within 2km away for each census block
(Figure 7-b). Since all the information is properly related and referenced in the
database, SQL queries allow us to obtain the number of POI elements that are associated with the nodes within 2km. Moreover, it allows knowing what is the shortest distance to reach each of the POI type nodes (Figure 7-c). SQL routines lead associating these results as two new columns per POI types; which are the number of reachable POIs and minimum distance to reach each POI type. Thus, by using Driving
Distance we are adding real proximity information to the census blocks through the
19
(a) (b) (c)
Figure 7. Example of the proximity features extraction process. (a) Selection of closest node to each POI and census block. (b) Selection of all possible nodes within 2km Driving
Distance. (c) Selection of the shortest path to each POI type from the census block node
3.2.2 Clustering algorithms: SOM, GeoSOM, k-means
Prior to SOM Execution, it is necessary to apply a normalization of the variables due to they have different measurement units. Min-Max normalization technic was selected for this purpose. Therefore, the new attribute values for the census blocks (training patterns) will be between 0 and 1. For SOM training algorithm from
GeoSOM software, it is necessary to configure the input parameters requested by the
tool. It is important to note that the quality of the results is directly related to the parameters selected for SOM [22, 37, 62]. Although theoretically, there is no better configuration for the initialization of SOM parameters [22], special considerations from the literature review were studied for parameter selection. Subsequently, a sensitivity analysis after running the algorithm several times contributes to the detection of the minimum possible error of both quantization and topographical. Then this can helps in the best configuration selection. Regarding SOM structure parameters, most attempts were made using a hexagonal topology because it offers a connection to its six neighbors and generates smoother maps [22]. Different input space sizes were examined considering that the larger it is, patterns and grouping structures are clearer to define [22, 58].
On the other hand, within the training parameters, different values for the number of iterations, learning rate, and neighborhood radius were tested in each SOM attempt. These variations were established considering the two phases of SOM training, unfolding and fine-tuning. The learning rate and neighborhood radio values are usually smaller in the tuning phase than in the unfolding. In contrast, the number of iterations in the unfolding phase is usually less than in the tuning phase. These considerations are raised because in the unfolding phase all neurons are scattered throughout the input space, while in the tuning process, the neurons are located in areas where training patterns are highly concentrated [22]. Other training parameters such as
20
learning function and neighborhood function were selected according to literary review. The Inverse function was selected for the first one by allowing greater network mobility in the training phase and achieving rapid adjustments [22], while Gauss function was selected for the second according to showing a smoother granularity in the resulting map [22]. Once the selected configuration shows satisfactory results, the output space is analyzed by means of the U-Matrix, which provides information about the distance between neurons [26, 62] (Figure 8-a). The grayscale palette color shows high distances in dark tones, and low in the light ones. Hints visualization provides information about the number of training patterns associated with each neuron (Figure 8-b).
(a) (b)
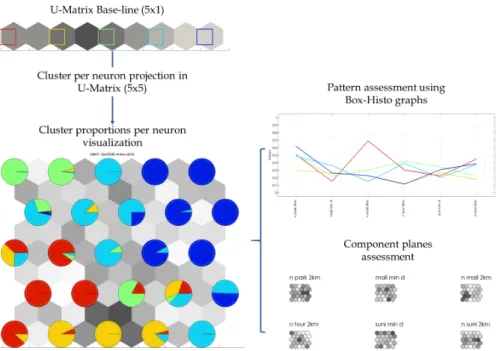
To simplify the visualization of the patterns in the output space, a new SOM is trained with the same size in X as the initial one but with only one neuron in Y. Figure 9 shows that for the previous example, the resulting U-Matrix size is 5x5, so the new U-Matrix will have a size of 5x1. This new U-Matrix is taken as a base-line for the cluster projection per neuron in the U-Matrix 5x5, where pie-charts depicts the proportions of associated clusters in each neuron (Figure 9). Visualization of the patterns and structures through Box-Histo diagrams and component planes allow observing potential similarities and differences present in certain variables for each of the generated clusters. Because this thesis is aimed at taking the initial clusters only as a guide, new clusters are created from GeoSOM software by identifying areas and clusters of the U-Matrix that may tend to reflect similar patterns.
Figure 8. Example U-Matrix 5x5 neurons. (a) U-Matrix distances visualization (b) U-Matrix hints visualization
21
Figure 9. Strategy for the visualization of the initial clusters through cluster projection per neuron from a U-Matrix base-line
Regarding the GeoSOM algorithm, this is trained from GeoSOM suite with the best configuration of parameters found in SOM. That is because the only difference between SOM and GeoSOM is that the latter considers the relationship of spatial contiguity offered by the nature of the geographic data. The methodological process described is again executed for the results of GeoSOM, thus generating a base-line U-Matrix that will project cluster per neuron in the initially generated U-U-Matrix. Pattern evaluation is performed for GeoSOM through Box-Histo and component planes. Although SOM is a powerful clustering technique when finding in its training process the best matching prototype in addition to updating topological neighbors on the map [5], the goal of running k-means is to have a point of comparison with an unsupervised clustering algorithm other than SOM. Therefore, k-means is executed by using the same initially normalized values, besides to take into account the same number of clusters selected for SOM. Subsequent visual inspection of the distribution of the spatialized clusters will allow the selection of one of these algorithms. The selected algorithm will be used to perform a cluster analysis of the non-standardized data. In this way, a description of the main characteristics of each cluster can be carried out when evaluating the collective behavior of the non-normalized variables. The defined clusters will be the main input to continue with the classification of place suitability levels.
22
3.2.3 Classification of Place Suitability Levels
While this thesis is aimed at developing a non-expert knowledge and unsupervised data-driven based methodology, suitability levels will be calculated from the results obtained by the clustering algorithm selected. Furthermore, the analysis ensures suitability levels are established within census blocks that have similar patterns. Consequently, the literature review allows an interpretation of the importance of the environmental, socio-economic and proximity variables involved in the study. High air/road traffic noise and PM values can influence the design of navigation routes for air-taxis [4, 9, 27, 48, 56], as well as defining pilot areas to improve air quality [27, 48]. Socio-economic variables such as medium household incomes and gross rent with high values could indicate the location of potential inhabitants who can afford air-taxi services for business trips [15, 27, 48]. In addition, demographic variables and workers' data could contribute to finding areas where UAM vehicles would facilitate not only public transport but also cargo and delivery activities [9, 28, 44]. Proximity variables calculated by the Driving Distance algorithm provide detailed information about the number of accessible POIs for each of the census blocks. Therefore, high values for these variables would indicate possible regions near nodes of recreation, health, transportation, public safety, and citizen care. In contrast, low values for attributes that describe the minimum distance to reach POIs show greater importance in accessing the mentioned nodes.
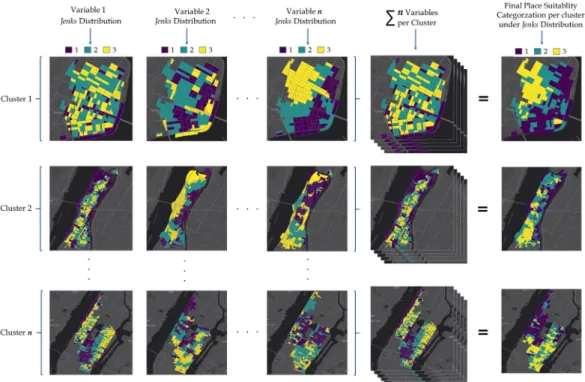
When considering these statements, this thesis proposes then to establish per cluster a statistical Jenks distribution in each of the variables. Jenks or “natural breaks” distribution allows establishing classifications by optimizing the differences between them [13]. Therefore, Jenks distribution is performed to establish three different class ranges per variable in each cluster. By bearing in mind the importance of the described variables, a score is assigned to each of the classes in each variable. This score is built in a range from 1 to 3. Where 3 will be assigned to classes of greater importance, 2 medium importance, and 1 low importance. Figure 10 allows us to observe the processing scheme about the generation of Jenks classifications given per variable in each cluster. Subsequently, the summation of the scores of the variables per cluster is performed in order to have totalized values of all scores in each cluster. Then these totalized scores are classified again by implementing Jenks distribution to keep the same class ranges previously established. Thus, the final suitability categories are established in each of the clusters.
23
Figure 10. Scheme for the categorization of Place Suitability Levels for each of the n clusters calculated
3.3 Rooftop-Flatness Assessment
This section of the thesis is aimed at explaining the methodology applied to the evaluation of roof-flatness, which is developed in two phases. The first one seeks to estimate the basic roof elevation statistics. The second stage is responsible for carrying out the flatness evaluation to then determine suitability levels to build UAM platforms.
3.3.1 Rooftop Elevation Statistics Calculation
The first step in the calculation of roof elevation statistics is to crop the tiles of LIDAR 3D cloud points with the rooftops footprint vector layer. The algorithm designed in Python takes advantage of the existing functions and methods in the ArcPy library for the LIDAR management data. In this way, the algorithm performs a routine to extract the 3D cloud of points in each roof of Manhattan. Due to the possibility that a roof can geographically share information from more than one LIDAR tile, the algorithm considers these situations by extracting the 3D points by sections and then annexing them. Therefore, the completeness of the information per roof is guaranteed. Taking as reference the work done by Castagno et al. [11] in the roof LIDAR data pre-processing, elimination of potential outliers was considered in the algorithm. These outliers can generate noise in the analysis when including topographic surface points.
24
Once the new LIDAR generated files are clean, roof elevation data is stored as pandas data frames to accelerate data processing. Thus, the algorithm calculates main statistics per roof such as mean elevation, maximum elevation, and standard deviation of the heights. This last statistic is of great importance since it works as a proxy in the identification of almost completely flat roofs by having values very close to zero. Then a geo-visualization of the statistics described yields to examine the spatial distribution and their patterns.
3.3.2 Rooftop Flat Surfaces Extraction
Once the cropped LIDAR files are obtained, the first stage of the algorithm is responsible for generating a raster file of the elevations for each roof. ArcPy LAS methods allow the rasterization of the 3D points where each pixel will take the corresponding elevation value. Pixels are generated with a size of 30 cm to increase the level of image detail. This step is based on the methodology applied by Castagno
et al. [11] in the generation of LIDAR images for roof shapes identification. Having
these images for each of the roofs, the next step is to perform a segmentation process to identify surfaces with similar height. This process is carried out by simulating GDAL polygonization function, where neighboring pixels that share the same value are grouped as a polygon. Nevertheless, this process is coded under ArcPy functions, where surfaces with the same height value are generated and stored as compact polygons. These polygons allow us to estimate the area of continuous surfaces with equal height based on the grouping of pixels at high resolution for each roof (Figure 11).
Figure 11. Main steps for rooftop flat surfaces extraction
Although other methods for precision segmentation and roof reconstruction have been proposed when working with LIDAR points directly [3, 12], LIDAR image segmentation simplifies the calculations necessary for this study by implementing GIS integrated tools. The algorithm orders these areas to select the five largest and then calculate the percentage they represent within the entire roof area (Figure 12). These
25
areas are then classified according to the size necessary for the construction of different UAM platforms. Sizes for eVTOL aircraft proposed by Fadhil, Seeley, and Uber Elevate [15, 27, 53] were taken as a reference for the definition of size ranges for each of the possible UAM hubs type. However, a new category was proposed for the landing and clearance of UAVs in order to maximize the potential for rooftop use (Table 3).
Potential UAM Hubs Type Area Range (m2) Vertihubs > 3400 Vertiports 1000 - 3400 Vertistops 160 - 1000 UAV vehicles 3 - 160
Table 3. Area ranges proposed for the categorization of UAM platforms
3.3.3 Rooftop Suitability Categorization
Because these polygons can have different forms, the designed algorithm evaluates the compactness of each of them by means of Elongation method or Length-Width proposed by Harris [21] and described by the formula (3). WMBB refers to the width
of the minimum bounding-box and LMBB to the length of the minimum bounding-box.
To calculate the ratio, the maximum measure of the polygon must be in the denominator.
𝐿𝐿𝐿𝐿 =𝑊𝑊𝑀𝑀𝑀𝑀𝑀𝑀
𝐿𝐿𝑀𝑀𝑀𝑀𝑀𝑀
(3)
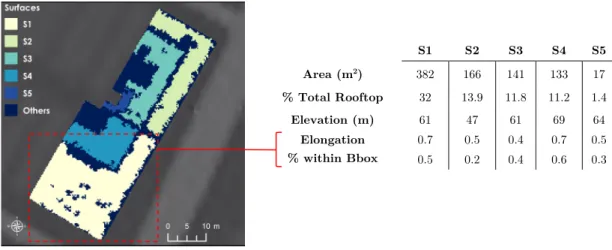
Ratio values close to 1 indicate greater compactness than those close to 0. Then, the algorithm saves this value per polygon in each roof. As a second evaluation metric for the detection of polygons with rectangular shapes and inclined orientation, the algorithm also includes the percentage of area covered by the polygon within the bounding-box region. Metric elongation is then categorized into quartiles for the definition of suitability ranges.
26
Figure 12. Example of attributes calculated by the algorithm in each of the main roof surfaces
3.4 Combined Categorization of the Suitability Indexes for
UAM Platforms
The last stage in the proposed methodology is the generation of the final suitability for the location of UAM platforms. Therefore the process consists of combining the place suitability calculated from the definition of clusters and rooftop suitability given by the flatness assessment. Consequently, the spatial overlapping of both geographical layers (census blocks and roofs) will allow establishing amalgamate suitability categories. This combined suitability leads to both spatially and statistically to verify the identification of total suitability levels in each of the potential UAM platform types which can be developed in the different clusters. Thus, an estimate of the number of rooftops with high integral suitability for UAM platforms can be found, in addition to geographically knowing where they lie in each of the clusters. In the same way, the outputs let knowing which roofs definitely do not show integral suitability for the development of the UAM hubs. Furthermore, joined suitability levels can also be examined by relating them to the features given by the non-standardized urban ecosystem variables in each of the clusters. The overlapping process is made considering that no ambiguities are generated in the combination of the categories by knowing in advance that entities in the rooftop building footprint layer used in the analysis can only be inside a single census block.
S1 S2 S3 S4 S5 Area (m2) 382 166 141 133 17 % Total Rooftop 32 13.9 11.8 11.2 1.4 Elevation (m) 61 47 61 69 64 Elongation 0.7 0.5 0.4 0.7 0.5 % within Bbox 0.5 0.2 0.4 0.6 0.3
27
3.5 Hardware and Software
All the data preprocessing and processes related to the place suitability analysis were developed and executed from a laptop with a processor Intel i7-9750H CPU 2.60GHz, 2592 MHz and 16 GB RAM. Table 4 provides a brief description and purpose of the main software and libraries used.
Software/Library Description/Purpose
PostgreSQL
v.10.10 Open-source relational database management system for the information involved in the place suitability analysis. PostGIS
v.2.5.3 r17699
It supports the management of the geographical component of the stored layers in PostgreSQL.
pgRouting
Extension library for PostGIS / PostgreSQL geospatial databases to provide geospatial routing functionalities. Specifically used for Driving Distance calculations.
Osm2pgrouting v.2.1
Library used to parse OpenStreetMap (OSM) road network information from Geofabrick and allow it to be routable.
QGIS v.3.8.2 Desktop GIS used for visualization of geographic information stored in PostgreSQL.
GeoSOM Suite v.201
An open-source application developed by NOVA University to develop Self-Organizing-Maps by considering the spatial properties of geographic information. Therefore used for the development of SOM and GeoSOM clusters in the place suitability analysis.
Spyder IDE v.3.3.3 (Anaconda) – Python v3.7.3
Scientific Python Development Environment for editing the code used by creating the k-means algorithm.
Scikit-learn
v.0.22.1 Python library to code the k-means clustering algorithm.
ArcGIS Pro v.2.2.0
Desktop GIS used in geoprocessing models design for the calculation of place suitability levels. Besides, it was used for mapping processing.
R v. 3.6.1 – Rstudio -ggplot2
R programing language for statistical computing was used under Rstudio for creating all the statistical graphics by using ggplot2 library.