F
ACULDADE DEE
NGENHARIA DAU
NIVERSIDADE DOP
ORTODevelopment of Computational
Methods for the Analysis of Neural
Coding Mechanisms of Sensory
Information in the Spinal Cord
Cristiana Raquel da Silva Carpinteiro
Mestrado Integrado em Bioengenharia Supervisor: Paulo de Castro Aguiar
Development of Computational Methods for the Analysis
of Neural Coding Mechanisms of Sensory Information in
the Spinal Cord
Cristiana Raquel da Silva Carpinteiro
Mestrado Integrado em Bioengenharia
Resumo
A medula espinal é uma estrutura central do sistema nervoso que tem um papel chave na perceção sensorial. Patologias associadas a esta estrutura, como dor crónica e lesões vertebro-medulares, são particularmente devastadoras. Para o desenvolvimento de estratégias de tratamento adequadas é necessário um conhecimento detalhado dos mecanismos de transmissão e integração de informação sensorial na medula espinal. A coluna dorsal está encarregue de processar a infor-mação sensorial e transmiti-la para regiões supra-espinais. Contudo, a maior parte dos detalhes sobre os mecanismos por detrás destas funções são ainda desconhecidos. As recentes melhorias nas tecnologias de microeléctrodos (MEA), aliadas aos novos conhecimentos sobre como estim-ular, registar e descodificar atividade neuronal, têm possibilitado avanços importantes em neuro-ciência e no estudo dos mecanismos acima mencionados. Desta forma, o principal objetivo desta dissertação consistiu no desenvolvimento de métodos computacionais para i) a análise dos mecan-ismos que alicerçam a codificação de informação sensorial nas vias ascendentes e ii) a análise dos circuitos espinhais. De modo a estudar as diferentes hipóteses de codificação, foi desenvolvido um modelo realista dos mecanismos de integração de informação nas vias ascendentes suportado por resultados experimentais. Este modelo foi capaz de simular a codificação de temperatura abso-luta e a localização do estímulo na pele e apresenta flexibilidade para integrar outros mecanismos de codificação e modalidades de estímulo. O estudo dos circuitos neuronais foi possível graças à implementação e validação de uma metodologia de inferência de conectividade. As ligações funcionais foram detetadas usando um algoritmo implementado em Python - histograma de cor-relação cruzada filtrada e normalizada (FNCCH) - e filtradas para obter conexões biologicamente realistas. Foram desenvolvidas e validadas três visualizações distintas para evidenciar a estru-tura da rede e possíveis ligações escondidas. A metodologia desenvolvida foi bem-sucedida na identificação de ligações funcionais concordantes com a estrutura imposta em experiências com microfluídica. Protocolos experimentais automatizados foram codificados e implementados no hardware de aquisição de dados com MEAs para lidar com a complexidade e volume de dados as-sociados a experiências de análise de circuitos espinhais. Os programas personalizados permitiram a amostragem automática em fatias da medula espinal, usando ciclos controlados de estimulação e aquisição de dados. A medula espinal possui atividade espontânea reduzida pelo que a estimulação é absolutamente necessária para ativar os circuitos espinais.
Em suma, as ferramentas desenvolvidas - modelo computacional de integração de informação sensorial, algoritmo e visualização de inferência de conectividade e protocolos experimentais automáticos – melhoraram consideravelmente a aquisição/análise de dados em experiências de eletrofisiologia com MEAs, potenciando a compreensão da integração de informações sensorial na medula espinal.
Abstract
The spinal cord is an important structure of the central nervous system that plays a key role in sensory perception. Pathologies associated with the spinal cord, such as chronic pain and vertebral-medullary lesions, are particularly devastating. For the design of adequate therapeu-tic strategies, the thorough knowledge of the mechanisms behind spinal cord sensory information integration and transmission is of utmost importance. The dorsal horn has a central role in pro-cessing sensory information and transmitting it to supraspinal regions. Nevertheless, most of the details regarding the coding and integration mechanisms occurring in this structure are still un-known. Recent improvements in microelectrode arrays (MEAs) and new knowledge on how to stimulate, record and decode neuronal activity, have made possible important advances in neuro-science and in the study of these mechanisms. Hence, the main goal of this dissertation was to devise computational methods that allow i) for the analysis of the mechanisms behind sensory in-formation coding in the ascending tracts, and ii) the analysis of spinal circuitry. A realistic model of sensory information integration and transmission was devised to study the different coding hy-potheses based on experimental findings. The model successfully simulated the coding of absolute temperature and stimulus location and presents flexibility to integrate other coding mechanisms and stimulus modalities. The study of neuronal circuitry was achieved by implementing and vali-dating a functional connectivity inference pipeline. Functional connections were detected through a Python implementation of the Filtered Normalized Cross-Correlation Histogram (FNCCH) algo-rithm. Three different visualizations were developed and validated to highlight hidden connections and more easily visualize the structure of the network. The developed pipeline successfully identi-fied functional connections consistent with the structure imposed in experiments with microfluidic compartmentalization. Automated experimental protocols were coded and implemented in the electrophysiology MEA hardware to deal with the complexity and sheer volume of data associ-ated with the circuit analysis experiments. The custom-made programming scripts allowed auto-mated sampling in spinal cord slices, using controlled cycles of stimulation and recording from the MEAs. Spinal cord slices have very limited spontaneous activity, so stimulation is necessary to activate the spinal circuits.
Altogether, these developed tools - computational model of sensory integration, connectivity inference algorithms and visualization, and automated experimental protocols - greatly improve data acquisition/analysis of MEA electrophysiology experiments, potentially fostering our under-standing of sensory information integration in the spinal cord.
Agradecimentos
Primeiro de tudo, queria agradecer ao meu orientador, o Dr. Paulo Aguiar, pela oportunidade, por todo o apoio e por tudo aquilo que me ensinou. Foi deveras um privilégio trabalhar no NCN e gostava de agradecer a todos os membros do grupo por me terem feito sentir que fazia parte desta equipa espetacular. Um obrigada especial ao Zé e ao Miguel por terem disponibilizado os dados das suas experiencias para eu poder fazer as minhas análises e ao Domingos por me ter ajudado a desenvolver o protocolo de estimulação ao som de boa música.
Numa nota mais pessoal, gostava de agradecer aos meus pais, que sempre acreditaram em mim em todas as etapas da minha vida, fossem elas boas ou más. A pessoa que sou hoje é mais forte por vossa causa e espero nunca vos desiludir. Ao meu irmão pelo exemplo de determinação e força de vontade e por todos os conselhos sinceros. Ao Tiago por me conseguir fazer rir sempre e por acreditar mais em mim do que ás vezes eu acredito em mim própria. Sou uma pessoa melhor por tua causa. Obrigada por tudo. Aos amigos da terrinha por tornarem Barcelos a cidade mais fixe de Portugal. Um especial obrigada à Leonor por todas as aventuras estúpidas ao longo destes anos e por ter estado lá para mim sempre que precisei. Ao Paulo, à Mariana, à Carolina, à Marina, à Lena, à Francisca, à Patrícia. . . Amigos que conheci na faculdade mas que levo para a vida. Obrigada Maggie e Joana por todas as pausas para café terapêuticas. Obrigada Maggie por me ajudares sempre independentemente de tudo.
Todas estas pessoas contribuiram para que terminasse esta etapa com sucesso. Obrigada!
"Nothing is permanent, not even our troubles."
Charlie Chaplin
Contents
1 Introduction 1 1.1 Motivation . . . 2 1.2 Objectives . . . 2 1.3 Challenges . . . 2 1.4 Document structure . . . 3 2 Literature Review 5 2.1 The Spinal Cord . . . 52.1.1 Principles of neurobiology . . . 5
2.1.2 Organization of the nervous system . . . 7
2.1.3 Neuroanatomy of the spinal cord . . . 8
2.1.4 Spinal cord pathologies . . . 13
2.1.5 Neuroprosthesis and the therapeutic potential of spinal cord stimulation . 14 2.2 Electrophysiology . . . 17
2.2.1 Neuronal membrane dynamics . . . 17
2.2.2 Instrumentation . . . 19
2.3 Neural Coding . . . 23
2.3.1 Stimulus-response relation . . . 23
2.3.2 Receptive fields and tuning curves . . . 25
2.3.3 Coding strategies in the nervous system . . . 27
2.3.4 Coding strategies in the spinal cord . . . 33
3 SensorySimLib 35 3.1 Model fundamentals . . . 35
3.2 NEURON simulation environment . . . 36
3.3 Library structure . . . 37
3.4 Individual neuron modelling . . . 37
3.4.1 Receptive field . . . 38
3.5 Population modeling . . . 38
3.6 Model for spinal sensory information transmission – a 2-neuron layered system . 39 3.6.1 Dorsal root ganglia . . . 39
3.6.2 Interneuron Population . . . 42
3.7 Results . . . 43
3.8 Discussion . . . 48
4 Functional Connectivity Inference 51 4.1 Filtered normalized cross correlation histogram . . . 52
4.2 Connectivity matrix spatio-temporal filtering . . . 52
4.3 Hard thresholding . . . 53
4.4 Connectivity map visualization . . . 53
4.5 Synthetically generated data for algorithm validation . . . 54
4.6 Results . . . 55
4.6.1 Algorithm validation - results in synthetically generated data . . . 55
4.6.2 Unconstrained cell cultures connectivity inference results . . . 56
4.6.3 Connectivity inference in compartmentalized cell cultures in microfluidics 59 4.7 Discussion . . . 64
5 Experimental Setup 67 5.1 Experimental setup overview . . . 67
5.2 Spinal cord slice preparation . . . 68
5.3 Data acquisition and stimulation routine . . . 68
5.3.1 Electrophysiological system overview . . . 68
5.3.2 MCS software . . . 69 5.3.3 Stimuli/recording protocol . . . 70 5.3.4 Validation . . . 72 5.4 Results . . . 75 5.5 Discussion . . . 78 6 Conclusion 79 7 Future Work 81 References 83
List of Figures
2.1 (a) General morphological features of the axon of local circuit neuron (LCN) from lamina I lumbar spinal cord. Main axon (asterisk), with origin in the soma (arrow). (b) Photomicrograph of the soma, dendrites, and axon branches of a typical flat-tened LCN in a sagittal spinal cord section. Adapted from [95]. . . 6
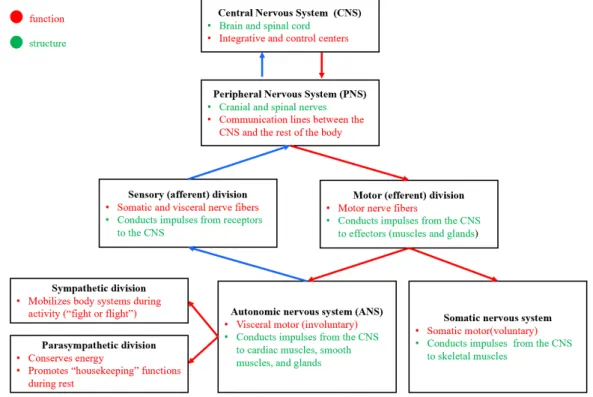
2.2 Diagram portraying the major divisions of the nervous system and its main func-tions and general structure. . . 7
2.3 Spinal cord cross-section. The spinal cord is protected by a set of membranes: the pia mater, the arachnoid mater and the dura mater. The dorsal and ventral roots, emerge from the posterior and anterior columns of the spinal cord, respectively. Adapted from [15]. . . 8
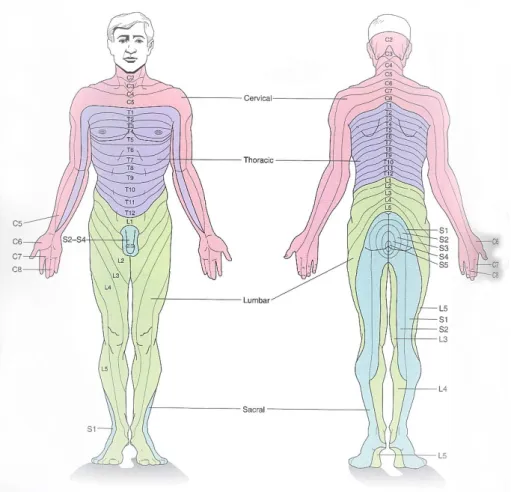
2.4 The area of skin supplied by a single spinal nerve is called a dermatome. In the trunk the dermatomes are roughly horizontal. In the limbs, dermatomes have been stretched out by the advancing limb bud during development. Adapted from [14]. 9
2.5 Laminar organization of the dorsal horn and primary afferent inputs. Primary afferents terminate in the dorsal horn in an organized way. Myelinated A tactile and A hair afferents end mainly in lamina III–V, with some ramifications to lamina IIi. A hair afferents branch in lamina II and lamina III, whereas A nociceptors terminate mainly in lamina I. C/A peptidergic afferents arborize mainly in lamina I and lamina IIo, while non-peptidergic C afferents terminate in the lamina II [66]. Figure adapted from [99]. . . 10
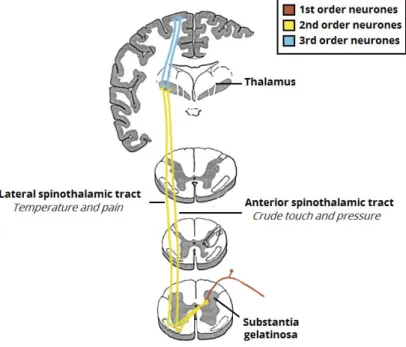
2.6 The spinothalamic tracts, which carry the sensory information of crude touch, pressure, pain and temperature. Adapted from [4]. . . 11
2.7 On the left, photomicrograph of cross section of the spinal cord just above the level of the lesion. The spinal cord section was stained for myelin, and the arrow shows a region of demyelination that demarcates the extent of the lesion, which interrupts the fasciculi gracilis bilaterally for a short distance on either side of the midline. On the right, ba drawing representing the extent of the demyelination. Adapted from [106]. . . 14
2.8 The Hodgkin–Huxley equivalent electrical circuit, representing the cell’s mem-brane. Adapted from [92]. . . 18
2.9 General principle of patch-clamp recordings. A glass pipette containing elec-trolyte solution is tightly sealed onto the cell membrane and thus isolates a mem-brane patch electrically. Currents fluxing through the channels in this patch hence flow into the pipette and can be recorded by an electrode that is connected to a highly sensitive differential amplifier. In the voltage-clamp configuration, a cur-rent is injected into the cell via a negative feedback loop to compensate changes in membrane potential. Recording this current allows conclusions about the mem-brane conductance. Adapted from [103]. . . 21
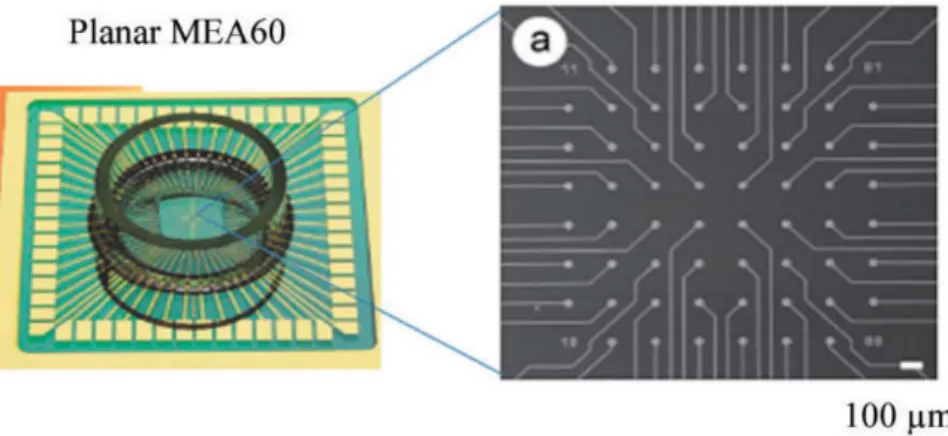
2.10 Planar MEA. On the left, overview of the MEA60 chamber; on the right, design of MEA60, where it is possible to see the 60 microelectrodes connected to strip conductors that the recording field is composed of 60 microelectrodes connected to strip conductors. Adapted from [58]. . . 22
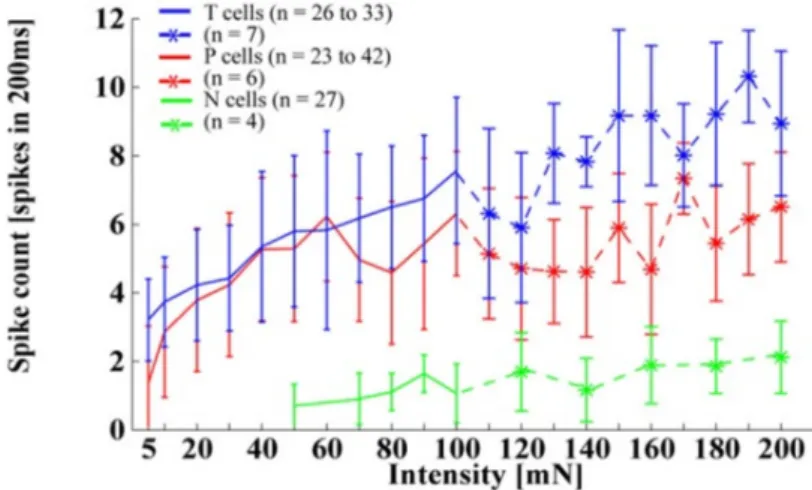
2.11 Spike count for T cells (blue), P cells (red) and N cells (green) responding to tactile stimuli with intensities of 5–200 mN applied at 0. Stronger pressure intensities (> 100 mN) were tested with fewer cells (see legend). Adapted from [103]. . . 24
2.12 Diagram of mechanisms of integration of nociceptive inputs in lamina I neurons. Left panel indicates the receptive fields of three mechanical nociceptors with over-lapping receptive fields. The three primary afferents terminate on the same lam-ina I neuron in the middle panel. The right panel indicates the resulting receptive field. The receptive field is somewhat larger, and more responsive points are found within the responsive area. Thus, unlike primary afferent receptors, spinal noci-ceptive neurons have nearly continuous renoci-ceptive fields with less unresponsive regions between responsive spots. Adapted from [13]. . . 26
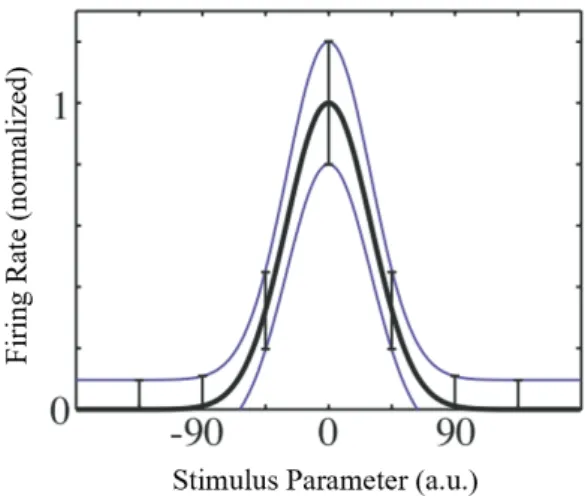
2.13 Typical tuning curve of a neuron, with mean firing rate (thick line) and standard deviation (thin lines) shown as a function of the stimulus parameter h. Adapted from [18]. . . 26
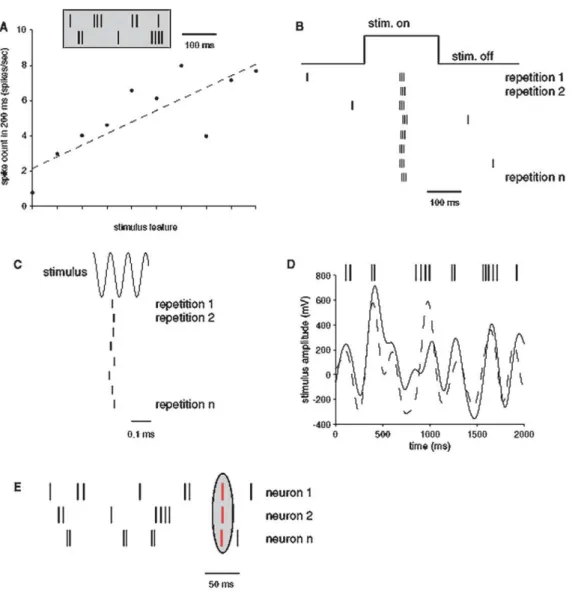
2.14 Schematic illustration of different coding schemes and their corresponding tem-poral resolutions. (a) In a rate coding scheme, the number of spikes in windows of several hundred ms correlates with some stimulus feature. The two spike trains shown on the top part are considered to be equivalent for a rate code since they carry the same number of action potentials in spite of the different temporal pat-terns. Although a linear trend is illustrated here, the relationship between stimulus and the spike count may be non-linear. (b) In a sparse representation, the neuron shows a very low spontaneous activity. The neuron reliably fires a single burst of spikes at a particular time from stimulus onset during multiple repetitions of the same stimulus. (c) A neuron shows very precise spike timing, with a trial-to-trial variation which can be less than 1 ms. (d) A time varying signal (solid trace) is represented by a neuron that can follow the rapid changes in the stimulus (top, action potentials). The stimulus can be reconstructed (dashed trace) from the in-stantaneous firing rate of the neuron. (e) In this example, the synchronized activity of multiple neurons (symbolized by the spikes marked in red) constitutes the code to represent information. Adapted from [18]. . . 28
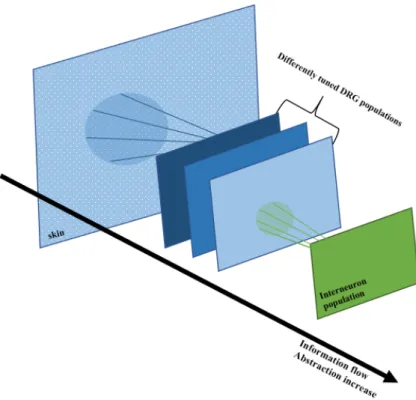
3.1 Model architecture. The stimulus information is transmitted through a series of layers. The first layer represents the DRG nerve endings located on the skin -doted plane, each dot represents a nerve ending. There are differently tunned DRG populations that sense stimuli applied to the skin. Each DRG receives information from a specific area - its receptive field - represented by the blue circle on the first layer. Interneurons are activated by the DRGs within its receptive field. As the information flows through the layers, the level of abstraction over the stimulus features increases. . . 40
3.2 Representation of the organization of the nerve endings and influence on DRGs re-ceptive field. (a) Cylindrical arrangement of the nerve endings and their influence on the different DRG receptive fields. (b) Cylinder’s surface projection, where the hexagonal geometry of the DRGs receptive field is evident. . . 43
LIST OF FIGURES xiii
3.3 Temperature sensed on the skin, resulting from the application of a stimulus with 10◦C at nerve ending 10000. The temperature rises exponentially as the distance to the stimulus application point increases. The maximum temperature is 22 degrees - the room temperature. . . 44
3.4 Activation pattern of DRG non-monotonically tunned for 20◦C population, result-ing from the application of a stimulus with 10◦C at nerve ending 10000 during 2 seconds. Each square represents a DRG. The activation of the individual neurons is measured as the maximum firing frequency registered during the total course of the experience. . . 44
3.5 Differently tunned DRGs responses to a linear, spatially uniform temperature in-crease (from 12◦C to 23◦C). (a) Monotonic tunning curves of the DRGs tunned for different temperatures (15◦C, 17.5◦C, 20◦C). (a)Non-monotonic tunning curves of the DRGs tunned for different temperatures (15◦C, 17.5◦C, 20◦C). . . 45
3.6 An overlay of the temperature trace of a cooling stimuli (white, from 32◦C to 16◦C) with neuronal responses during this stimulus - heatmap. Adapted from [79]. 45
3.7 Overlay of heatmap of the activity of the different interneurons populations and the temperature trace. The different interneurons populations are distinguished by the DRGs to which they are connected. In the graph NM stands for connections with non-monotonically tunned DRGs, whereas M stands for connections with monotonic neurons. The blue line represents the temperature trace during the course of the experience. The maximum temperature is 32◦C, while the starting temperature is 16◦C. . . 46
3.8 Interneurons responses to a spatially uneven thermal stimulus applied to the skin. (a) Temperature distribution across the skin’s surface. (b) Population of interneu-rons connected to non-monotonically tunned for 17.5 degrees and monotonically tunned for 20 degrees DRG populations responses. Each square represents the response of an interneuron. . . 46
3.9 Representation of the connections between DRGs monotonically tunned for 15 de-grees and two different interneurons. Black markers represent the different DRGs, whereas the different colored markers portray the different interneurons. The con-nections between the two layers are represented by lines, whose color identifies with which interneuron the connection is made. . . 47
3.10 Targeted stimuli interface. First, the user sets the number of active cells and then, identifies which cells are going to be stimulated and at which moment, finally, a visualization of the stimulated neurons is produced. . . 47
4.1 Background of visualization. Electrically non-significant electrodes are shaded gray, while active electrodes are highlighted in yellow. . . 54
4.2 Standard visualization of the excitatory connectivity map of hippocampal cul-ture at 12 DIV. Connections are colored according to its strength. The maximum strength among the detected connections is 0.050. . . 56
4.3 Characterization of the functional connections detected in hippocampal culture at DIV 12. (a) Probability histogram of the connections’ strength, where 97.2% of the links have strength below 0.035. (b) Histogram of connections’ length. The average length is 0.71 mm. (c) Histogram of connections’ delay. The average delay is 6.2 ms. . . 56
4.4 3D visualization of excitatory links detected with the FNCCH algorithm for hip-pocampal culture at DIV 12. The third dimension of the graph represents the electrode’s clustering coefficient, which is valued between 0 an 1. The cluster-ing coefficient is a measure of the degree to which elements in a network tend to cluster together. . . 57
4.5 Characterization of the functional connections detected in the second hippocam-pal culture at DIV 12. (a) Probability histogram of connections’ strength. The strength of the links is concentrated in the 0.020 to 0.030 spectrum. (b) Probabil-ity histogram of connections’ length. The average length of the links is 0.71 mm. (c) Probability histogram of connections’ delay. The maximum delay is 12 ms. . 57
4.6 Standard visualization of the connections detected in the second hippocampal cul-ture at DIV 12. . . 58
4.7 3D visualization of the excitatory links resulting from the connectivity analysis of the second hippocampal culture at DIV 12. Electrodes N1, A10 and D6 present maximum clustering coefficients. . . 58
4.8 Visualizations of the excitatory connectivity map detected in microfluidic com-partmentalized hippocampal cultures at DIV 11. (a) Standard visualization of excitatory connectivity map. The majority of the connections detected is parallel to the MEA’s electrode columns. (b) Curved Lines visualization. This view of the CM allows fof the identification of hidden connections between electrodes of the same column. . . 59
4.9 Confocal microscopy image (10x magnification) of microfluidic compartmental-ized hippocampal culture at DIV 11, where the microfluidic structure is evident. The vertical grooves of the structure are aligned with the MEA’s electrode columns from index 10 to 16. The electrode marked red - electrode C9 - is positioned near an agglomerate of neurons, which may explain the high number of connections coming from this electrode detected with the connectivity inference pipeline. . . 60
4.10 3D visualization of the excitatory links identified in microfluidic compartmental-ized hippocampal culture at DIV 11. The majority of the electrodes that participate in the links between electrodes of the same column present maximum clustering coefficient. . . 60
4.11 Characterization of the functional excitatory links detected in microfluidic com-partmentalized hippocampal culture at DIV 11. (a) Probability histogram of con-nections’ strength. The most frequent strength is 0.1. (b) Probability histogram of connections’ length. The average link length is 0.25 mm. (c) Probability his-togram of connections’ delay. The average connection delay is 0.46 ms. . . 61
4.12 Standard visualization of the inhibitory connections detected in microfluidic com-partmentalized hippocampal culture at DIV 11. All connections have strength inferior to 0.0001. . . 61
4.13 Visualizations of the excitatory connectivity and inhibitory connectivity maps de-tected in microfluidic compartmentalized hippocampal cultures at DIV 12 after axotomy.(a) Standard visualization of the excitatory connectivity map. The num-ber of connections parallel to the electrode columns reduced significantly after axotomy. (b) Standard visualization of the inhibitory functional connections de-tected. Most of the links are long - range. . . 62
LIST OF FIGURES xv
4.14 3D visualization of the excitatory links identified in microfluidic compartmental-ized hippocampal culture at DIV 12 after axotomy. The number of electrodes with maximum clustering coefficient significantly reduced, in fact, the overall cluster-ing coefficient decreased to 0.23. . . 63
4.15 Characterization of the functional excitatory links detected in microfluidic com-partmentalized hippocampal culture at DIV 12, 12 hours after axotomy. (a) Prob-ability histogram of connections’ strength. The average connection strength is 0.2. (b) Probability histogram of connections’ length. Most of the links are short-range - the most frequent length is 0.2. (c) Probability histogram of connections’ delay. The average delay is 4.3 ms. . . 63
4.16 Histogram comparison of the excitatory and inhibitory connections’ length. In-hibitory connections are on average longer. . . 64
5.1 Experimental setup. The acquisition is carried out by the computer and the MEA-2100 system. The MEA containing the spinal cord slice is placed inside the head-stage. . . 68
5.2 MEA-2100 system overview. The MEA100-System consists of several compo-nents: MEAs, headstage, interface board, PC with software. Adapted from [1]. . 69
5.3 Multi Channel Experimenter: stimulus design interface. Easy-to-use drag and drop interface, you simply create your virtual experiment with e.g. data source, filters, spike detection, and recorder. The software indicates the battery level and signal quality and displays the data in real-time. . . 70
5.4 Flowchart explaining the sequence of actions that make the data acquisition and stimulation routine. . . 71
5.5 256MEA Stimulus Generator. The position of the control button and the DIP switches determines which stimulus is generated. . . 72
5.6 Signal read in each electrode with the MATLAB custom-made data acquisition protocol. The signal is acquired with a high signal-to-noise ratio. . . 73
5.7 (a) H12 electrode signal read with the custom-made script.(b) H12 electrode signal read with Multichannel Experimenter. . . 73
5.8 Signal read in each electrode after stimulation of A2 electrode. It is possible to see that the signal is picked up by nearby electrodes. . . 74
5.9 Signal read in each electrode after stimulation of P16 electrode.A stimulation ar-tifact is recorded in nearby electrodes. . . 74
5.10 Voltage trace of the period of stimulation in channel A2. The stimulation produces a 40 mV artifact. . . 75
5.11 On top, voltage trace of a segment of the signal acquired on the channel A2 with the identified spikes marked. On the bottom, it is shown a zoomed view on the highlighted spike. It occurs immediately after the blanking period, suggesting that it is a stimulation artifact. . . 76
5.12 Raster plot of the spikes detected using the thresholding method. Spikes were detected as being local maxima (or minima) with amplitude higher than the median of the signal plus 8 times the standard deviation, and a minimum separation in between peaks of 1 ms. . . 76
5.13 Filtered voltage trace of A2 channel with detected spikes(red markers). The spikes are identified near a peak of 600 µV , a value not compatible with that of action potentials. . . 77
5.14 Excitatory links identified on the spinal cord slice recording. The average strength of the links is 0.13. . . 77
List of Tables
2.1 Types of correlation between spike patterns. Adapted from [23]. . . 31
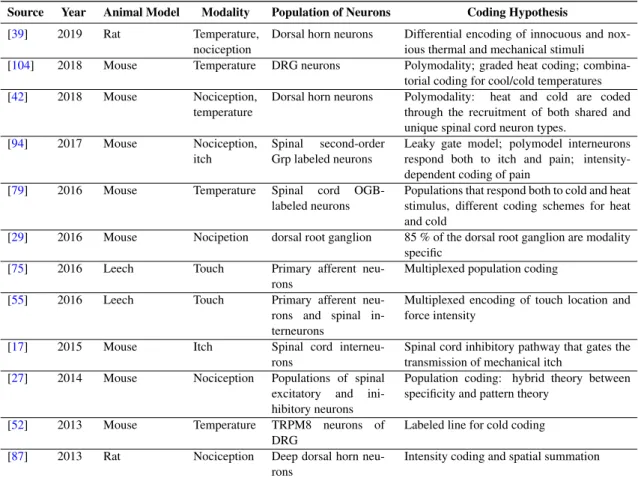
2.2 State-of–the-art coding hypothesis in the spinal cord. . . 34
4.1 Results of functional connectivity assessment on different pairs of synthetically generated spike trains. The FNCCH output can be interpreted as the strength of the connection between the spike trains. When FNCCH is valued at 1, the spike trains are fully correlated and a link with maximum strength is identified. On the other hand, when FNCCH equals 0, no connection is identified. The delay corresponds to the value within the time window (25 ms) where the FNCCH was evaluated where the maximum correlation is registered. . . 55
Abbreviations
ACSF Artificial Cerebrospinal Fluid
API Application Programming Interface
CNS Central Nervous System
CM Connectivity Matrix
DSP Digital Signal Processor
DRG Dorsal Root Ganglia
DIP Dual In-line Package
DLL Dynamic Link Library
ECAP Electrically Evoked Compound Action Potentials FNCCH Filtered Normalized Cross-Correlation Histogram
HTMR High-Threshold Mechanoreceptor
LCN Local Circuit Neuron
LTMR Low-Threshold Mechanoreceptor
MEA Micro-Electrode Arrays
MEA-SG 256MEA Signal Generator
MCS MultiChannel Systems
NE Nerve Endings
PBS Phosphate-Buffered Saline
PNS Peripheral Nervous System
SNR Signal-to-Noise Ratio
SCI Spinal Cord Injury
Chapter 1
Introduction
The human nervous system possesses one of the most complex architectures ever known. In recent years, efforts to understand its mechanism have incited technological progress. In fact, artificial neural networks, a revolutionary computing system, were inspired in biological neural networks, drawing knowledge from the basis of neural communication.
The spinal cord is the main pathway of communication between the brain and the rest of the body, allowing for the collection signals from the outer world and the interaction with it. Spinal cord injury (SCI) interrupts this communication, compromising several fundamental body func-tions. Therefore, it is easy to understand why SCI is such a debilitating condition. Normally, it is caused by trauma, resulting from an accident, which means it strikes unexpectedly, transform-ing completely the lives of the ones who suffer it. Accordtransform-ing to the World Health Organization, between 250k and 500k people suffer a SCI, every year. Besides having their quality of life dras-tically reduced, patients with SCI are 2 to 5 times more likely to die prematurely [107]. Restoring spinal cord function is, thus, an appealing goal, yet very demanding. Beyond restoration of mo-tor control, it is of fundamental importance to regain sensory function, this requires a thorough knowledge of the mechanisms behind information integration and transmission at the spinal cord level. Both pharmacological therapies and neuroengineering solutions, such as direct electrical stimulation of the spinal cord, demand the investigation about modulation and controlling meth-ods of the electrical activity of neurons, the working units of the nervous system. The patterns of electrical activity of neurons encrypt information about the stimulus that triggered it. The search for a neural code, a language that describes the translation between stimulus and response, is the motivation behind neuroscience and requires the alliance of traditional (neuro)biology techniques with other areas of study to grasp the complexity of it.
The recent improvements in micro-electrode arrays (MEAs) technologies propelled the re-search in the neuroscience field. MEAs are devices that enable the simultaneous recording and stimulation of large populations of neurons in a non-invasive way for long periods of time, giving relevant information about population dynamics and the neural code [91].
The keyword to understand the nervous system is information. Thus, the future of neuro-science involves inevitably approaches in computational theory, signal processing, biophysics,
computational modeling, and simulation. For this reason, in this dissertation, neurons are viewed as biological units for information processing and transmission, going beyond the conventional neurobiological approach.
1.1
Motivation
The neurons from the dorsal horn play an essential role in the perception of changes both inside and outside the body, being responsible for the integration and processing of sensory information before its transmission to the brain. Despite its high importance, there is still no detailed descrip-tion of how the sensory informadescrip-tion is processed in the spinal neural circuits. The discovery of these mechanisms can give way to better therapeutic strategies to both restore spinal functioning in the context of SCI and tackle fundamental problems, such as chronic pain. Knowing the prin-ciples behind these processes, it is possible, for example, to design correct electrical stimulation protocols that mimic normal function, reestablishing the lost communication. This dissertation takes important steps towards the clarification of the coding and transmission mechanisms in the spinal cord, by developing specific computational tools to deal with the complexity in MEA data acquisition/analysis. These computational tools are created with the purpose of facilitating the process of identifying the governing principles of sensory information encoding in the ascending pathways.
1.2
Objectives
This work is framed in the recently funded FCT research project MindTheGap and its main goal is to devise computational methods to analyze the mechanisms behind sensory information coding in the spinal cord, with the purpose of answering the following research questions:
• How is peripheral sensory stimulation mapped in the spinal cord?
• What are the local circuits supporting sensory integration in this structure? • How is sensory information encoded in the ascending tracts?
To fulfill these objectives, this work will encompass the development of a library for simulation of spinal sensory information integration and transmission using the NEURON simulation environ-ment, the implementation of algorithms for automatic identification of functional connections in experimental data acquired with MEAs, and the design of a custom-made automated protocols for the stimulation and recording of spinal cord slices.
1.3
Challenges
The current electrophysiological methods to record neuronal activity still present challenges. MEAs excel in temporal resolution, however, the spatial precision is limited, so electrodes record
1.4 Document structure 3
the activity of several neurons at the same time, which difficults data analysis. Moreover, neural activity is inherently noisy, making it hard to isolate the relevant information encrypted in the electrical signal. Furthermore, the existing coding hypotheses, especially for the processes occur-ring in the spinal cord, are incomplete. Models contemplate only a few stimulus modalities and significantly reduce the complexity of the nervous system. Also, coding schemes are not usually tested and simulated in a virtual environment, to assess its reliability. The present work tries to fill these gaps.
1.4
Document structure
This document is structured in 7 chapters. Background information and review of the literature is provided in Chapter 2. This Chapter first presents a description of the anatomical aspects of the spinal cord and, in more detail, of the dorsal horn and gives an overview of the pathologies that affect the spinal cord and the therapeutic potential of neuroprosthesis and spinal cord stimulation. Then describes the basic principles behind the generation of electrical signals and the methodolo-gies used to record these, highlighting the importance of MEAs. Finally, approaches the different coding strategies in the nervous system and the current hypothesis for the coding in the spinal cord. Chapter 3 presents the fundamentals of the developed model, its structure and the function-alities implemented, and presents and discusses the results of the developed framework. Chapter 4 describes the connectivity analysis pipeline and discusses the results obtained for the testing of the algorithm in the different datasets. Chapter 5 details the experimental setup implemented to both stimulate and record activity in the spinal cord and examines the outcome of the experiment performed and the main obstacles. Finally, Chapter 6 draws the main conclusions about the work developed. Prospective future directions are presented at the end of the document.
Chapter 2
Literature Review
This Chapter explores the anatomical and physiological aspects of the spinal cord and, in more depth, of the dorsal horn and the ascending tracts. Additionally, it describes the methods and principles behind neural activity recordings, highlighting the importance of MEAs for the problem in hands. Furthermore, it reviews the state-of-the-art of coding strategies in the nervous system, mentioning the ones that prevail in the spinal cord.
2.1
The Spinal Cord
The spinal cord is the information highway of the nervous system, transmitting signals to and from the brain to the rest of the body. It is responsible for the perception of the outer world, its state and threats. Injuries in this structure break this connection, and consequently, the most basic func-tions of the body are compromised. Understanding the spinal cord in physiological condifunc-tions is fundamental to devise appropriate and effective therapeutic strategies for pathological conditions. In this chapter, it will be addressed the underlying mechanisms and anatomical principles that make this communication possible. As this thesis is focused on sensory information integration and transmission (and not on motor information), this chapter gives more attention to the spinal cord structure associated with the somatosensory system: the dorsal horn. As to better under-stand the anatomy (circuit architecture) and electrophysiology (dynamics) of the dorsal horn, this chapter starts with a general overview of neurobiology and the organization of the nervous system.
2.1.1 Principles of neurobiology
The building blocks of the nervous system are electrically excitable nerve cells, named neurons. These cells are responsible for the transmission and processing of information. The neuron is constituted by the cell body or soma, where the nucleus is located, dendrites, whose function concerns the transmission of the electrical impulses (action potentials) to the cell, and an axon, a long, slender projection that specializes in the conduction of electrical impulses, outward and away from the cell body towards the axon terminus. The length of an axon may vary: it can traverse large fractions of the brain or, in the peripheral nervous system, the entire body. Additionally, it
may be myelinated or unmyelinated, whether it possesses an electrically insulating layer, called myelin sheath, or not. Myelinated axons drive electrical impulses faster, since the propagation occurs from one node of Ranvier (gap between myelin sheats) to the next. In Fig.2.1 can be observed a real neuron with the detailed morphology pointed out.
Figure 2.1: (a) General morphological features of the axon of local circuit neuron (LCN) from lamina I lumbar spinal cord. Main axon (asterisk), with origin in the soma (arrow). (b) Photomi-crograph of the soma, dendrites, and axon branches of a typical flattened LCN in a sagittal spinal cord section. Adapted from [95].
As above stated, the fundamental goal of the nervous system is information processing. This is possible through the organized communication of neurons, which is mainly carried out by synapses. This process typically occurs between the axon of one neuron and the dendrites of the next. Synapses can be one of two kinds: electrical or chemical. Electrical synapses are less frequent than chemical ones. In electrical synapses, the membranes of the two communicating neurons are linked together by an intercellular specialization, called gap junction, allowing ionic currents to flow passively through the gap junction pores from one neuron to another [78]. On the other hand, chemical synapses occur through the diffusion of signaling molecules, known as neurotransmitters, to pass rapidly from one cell to the other. The complex branching structure of the dendritic tree enables the reception and compartmentalization of inputs from several other neurons.
In fact, based on the information they convey, neurons can be categorized in different special-izations. Sensory neurons respond to one particular type of stimulus, such as temperature or touch, and converts it to an electrical signal. Motor neurons receive signals from the brain and spinal cord to control muscle contraction or glandular output. Finally, interneurons make the connection be-tween two neurons, within the brain or spinal cord.
2.1 The Spinal Cord 7
2.1.2 Organization of the nervous system
The nervous system can be divided into two major parts, the central nervous system (CNS), that consists in the brain and the spinal cord, and the peripheral nervous system (PNS), which connects the central nervous system to the rest of the body.
At a structural level, the central nervous system is organized in gray matter and white mat-ter. Gray matter is made of neurons, embedded in neuroglia, a tissue specialized in nutrition and support of the central nervous system, while white matter refers to the areas that are mainly con-stituted by myelinated axons. In Fig. 2.2can be observed a diagram portraying the organization of the nervous system.
Figure 2.2: Diagram portraying the major divisions of the nervous system and its main functions and general structure.
The autonomic nervous system is responsible for involuntary control of the body, accounting for the innervation of involuntary structures, namely the heart, smooth muscle, and glands. There are two divisions of the autonomic nervous system – the sympathetic and the parasympathetic[15]. The sensory or afferent division carries sensory signals through afferent nerve fibers coming from receptors in the peripheral nervous system. It is constituted by the somatic and visceral divisions. The somatic sensory division carries signals from receptors in the skin, muscles, bones, and joints, while the visceral sensory division carries signals mainly from the viscera of the thoracic and abdominal cavities [63]. On the other hand, the motor (efferent) division carries motor signals by way of efferent nerve fibers from the CNS to effectors (mainly glands and muscles). It can be subdivided into somatic and visceral divisions. The somatic motor division carries signals to
the skeletal muscles. The visceral motor division, also known as the autonomic nervous system, carries signals to glands, cardiac muscle, and smooth muscle. It can be further organized into the sympathetic and parasympathetic divisions, which are responsible for the arouse and calming of the body, respectively [63].
2.1.3 Neuroanatomy of the spinal cord
The spinal cord is located inside the vertebral canal of the vertebral column. It is surrounded by three meninges, namely the dura mater, the arachnoid mater, and the pia mater, observed in Fig.2.3. The cerebrospinal fluid gives extra protection and it is located in the subarachnoid space, surrounding the spinal cord. The spinal cord begins at the foramen magnum in the skull and terminates in the lumbar region [63].
Figure 2.3: Spinal cord cross-section. The spinal cord is protected by a set of membranes: the pia mater, the arachnoid mater and the dura mater. The dorsal and ventral roots, emerge from the posterior and anterior columns of the spinal cord, respectively. Adapted from [15].
Along with its length, the spinal cord varies in size and shape, depending on whether the emerging motor nerves innervate the limbs or trunk. The spinal cord is organized in an inner core of gray matter surrounded by an outer layer of white matter.
From the spinal cord emerge 31 pairs of spinal nerves that link the spinal cord to muscles and sensory receptors in the skin. An area of the skin that is supplied by the same sensory nerve is called dermatome. The body can be divided into several dermatomes depending on the sensory nerve that supplies it, as seen in Fig.2.4. Each nerve has a sensory division that begins in the dorsal root and a motor division that rises from the ventral root. The dorsal roots carry sensory information into the spinal cord from muscles and skin. Different classes of axons coursing in the dorsal roots mediate sensations of pain, temperature, and touch. The cord also receives sensory information from internal organs. The ventral roots are bundles of the outgoing axons of motor neurons that innervate muscles. The motor neurons of the spinal cord comprise the final common pathwaysince all higher brain levels controlling motor activity must ultimately act through these
2.1 The Spinal Cord 9
neurons in the ventral horn and their connections to muscles. Ventral roots from certain levels of the spinal cord also include sympathetic and parasympathetic axons [48].
Figure 2.4: The area of skin supplied by a single spinal nerve is called a dermatome. In the trunk the dermatomes are roughly horizontal. In the limbs, dermatomes have been stretched out by the advancing limb bud during development. Adapted from [14].
Looking at the cross section of the spinal cord, Fig. 2.3, it is possible to observe a butterfly-shaped gray matter core. It is typically divided into dorsal and ventral horns. The dorsal horn contains an orderly arrangement of sensory neurons that receive input from the periphery, while the ventral horn contains motor nuclei that innervate specific muscles. The white matter is consti-tuted by longitudinal tracts of myelinated axons that form the ascending pathways through which sensory information reaches the brain and the descending pathways that carry motor commands, and modulatory influences from the brain[48].
2.1.3.1 Dorsal horn architecture
The dorsal or posterior horn is further subdivided into 6 layers or laminae, in an organization that can be observed in Fig. 2.5. Their denomination is not only based on their topographic organization, with the lower numbers being towards the back of the spinal cord, but also on the types, and functions, of the neurons in each laminae.
Figure 2.5: Laminar organization of the dorsal horn and primary afferent inputs. Primary afferents terminate in the dorsal horn in an organized way. Myelinated A tactile and A hair afferents end mainly in lamina III–V, with some ramifications to lamina IIi. A hair afferents branch in lamina II and lamina III, whereas A nociceptors terminate mainly in lamina I. C/A peptidergic afferents arborize mainly in lamina I and lamina IIo, while non-peptidergic C afferents terminate in the lamina II [66]. Figure adapted from [99].
Lamina I, also called the posterior marginal nucleus, locates at the outermost tip of the dorsal horn. Cells in this layer answer to primary afferent axons carrying information about pain and temperature sensations. Most of the neurons located here give rise to axons of the spinothalamic tract (further explained on subsection2.1.3.2).
Lamina II, also called substantia gelatinosa, receives afferent fibers from Lissauer’s fasciculus, conveying impulses important in transmission of pain, temperature and touch. It is primarily composed of Golgi II interneurons, which broadly project to secondary neurons in laminae I and V [38].
Lamina III and IV, also named nucleus proprius, include interneurons that receive touch and pressure stimuli. The dendrites of some of these neurons project into lamina II, while axons of certain neurons contribute to the spinothalamic tract.
Lamina V is situated at the neck of the dorsal horn. Neurons here receive input from afferent axons transmitting both harmfull and innocuos stimuli. Similar to what happens in laminae III and IV, axons of interneurons cross to the contralateral side and colaborate in the spinothalamic tract.
Lamina VI is located at the base of the dorsal horn in the cervical and lumbar enlargements and only conveys afferent input from central processes of primary sensory neurons [26].
Besides neurons from local circuitry and interneurons, the dorsal horn possesses also projec-tion neurons that give rise to the different ascending tracts.
2.1 The Spinal Cord 11
2.1.3.2 The ascending tracts
The ascending tracts refer to the neural pathways by which sensory information from the pe-ripheral nerves is conveyed to the cerebral cortex. It is linked to the conscious perception of touch, pressure, pain, temperature, position, movement and vibration, coming from muscles, joints, skin, and fascia. It obeys three major functions: exteroceptive and interoceptive, which control response to external and internal stimuli, respectively, and proprioceptive, for the perception and control of body movement and balance [6].
Sensations detected in the periphery are forwarded through pathways via the spinal cord, brain-stem, and thalamic relay nuclei to the sensory cortex in the parietal lobe over a 3-neuron system [3], as seen in Fig. 2.6. First, occurs the activation of primary sensory neurons whose cell bodies lie within the dorsal root ganglia (DRG) and cranial sensory ganglia. DRG neurons convert the physical and chemical state of the external and internal environment into neuronal activity [104]. DRG neurons are pseudounipolar, with one axonal branch that reaches peripheral targets, such as receptors located in the skin or muscles, and another axon that enters the spinal cord directly, without synapsing [6]. The total length of the processes of the primary neurons can reach over 2 meters (from receptors in the big toe to the medulla) [26]. At this point, the axon forms branches that either communicate with second-order neurons in the spinal cord gray matter or ascend to nuclei located at the junction of the spinal cord with the medulla [48].
Figure 2.6: The spinothalamic tracts, which carry the sensory information of crude touch, pressure, pain and temperature. Adapted from [4].
The exteroceptive somatosensory system is specialized in the detection of harmful sensations. The perception of innocuous and harmful touch depends on special mechanosensitive sensory neurons that can be classified into two classes: low-threshold mechanoreceptors (LTMRs) and
high-threshold mechanoreceptors (HTMRs), that respond to innocuous and harmful mechanical stimulation, respectively [6].
The ascending branches are conveyed to lower brain regions (location of third-order neurons) where they are processed. In case of fast responses, the processed information may be dispatched directly to a motor system. But, when a thorough analysis is necessary, the information is transmit-ted to higher brain regions for additional processing. The sensory input reaches then the forebrain where the perception of complex patterns occurs. Fibers coming from the lower part of the body project to the superior aspect of the cortex, while fibers from the thoracic and cervical regions end in the more inferior aspect of the cortex. This fiber arrangement leads to an inverted representation of the body in the cortex identified as homunculus [26].
Differently tuned sensory pathways are uniquely activated by distinct stimuli modalities and the corresponding sensation depends on which pathway is activated, according the labeled line theory [104].
The ascending tracts can be organized into different tracts, which denomination is based on the trajectory of the nerve fibers, from the site they start (spinal cord) to the site they terminate, thalamus and cerebellum, respectively. Although this thesis will focus on the spinothalamic tract, for completeness a detailed list of the ascending tracts is provided.
The Anterolateral System
The anterolateral system consists of two separate tracts: the lateral and anterior spinothalamic tracts.
The lateral spinothalamic tract conveys sensations of pain and temperature from receptors throughout the body (except the face) to the brain. Free nerve endings, projected from processes of primary neurons, are sensitive to molecules indicative of cell damage and are, therefore, the principal receptors. The central processes of the primary neurons enter the Lisauer’s fasciculus and ascend at least one segment before entering the dorsal horn to synapse with the secondary neurons (interneurons) [48]. Secondary neurons of the spinothalamic tract are mostly found in laminae I, IV, V and VII. Interneurons from laminae I and V ascend in the lateral spinothalamic tract, through the brainstem, reaching the thalamus. The third order neurons in the thalamus will, then, project to various regions of the somatosensory cortex [48].
On the other hand, the anterior spinothalamic tract conducts impulses related to sensations of light, poorly localized touch.Axons of the primary neurons drive impulses of soft touch from re-ceptors in the hairless areas of the skin to the cell bodies located in the DRG. The central processes of these primary neurons reach into the dorsal horn, through laminae IV to VII. Here, they synapse with secondary neurons, whose axons cross in the anterior white commissure and turn rostrally to form the anterior spinothalamic tract in the anterolateral part of the spinal white matter. In the medulla, this tract merges with the lateral spinothalamic tract. Finally,they reach the posterior re-gion of the thalamus [74]. This tract is phylogentetically newer in mammals, contributing to more precise sensations of pain and temperature [26].
2.1 The Spinal Cord 13
The Spinocerebellar Tracts
Within the spinocerebellar tracts, there are four individual pathways: the anterior and rostral spinocerebellar, the posterior spinocebellar and cuneocerebellar tracts.
The anterior and rostral spinocerebellar tracts convey impulses related to movement and posi-tion sense from tendon organs and muscle spindels to the cerebellum. The informaposi-tion conducted in this pathway may contain information regarding an entire limb. Peripheral processes of the primary neurons of the anterior spinocerebellar system approach their cell bodies in the DRG of lumbar and sacral spinal nerves. The central processes of these neurons enter the cord at these levels and synapse with interneurons in the bases of the posterior and anterior horns.The axons of these secondary neurons then cross to the contralateral side and turn rostrally to form the anterior spinocerebellar tract. Finally, the tract ascends the brain stem to enter the cerebellum.
On the other hand, the rostral spinocerebellar tract is the equivalent of the anterior tact for the upper limbs. The central processes of the primary neurons enter the cervical cord, synaps-ing with secondary neurons. The axons of these neurons remain uncrossed and join the rostral spinocereberllar tract, entering the superior cerebellar peduncle [48].
The posterior spinocerebellar tract conveys muscle spindle or tendon organ related impulses from the lower half of the body, while the cuneocerebellar tract transmits such impulses from the lower part of the body. The axons conducting impulses from the lower half of the body are large Ia, Ib, and II fibers, the cell bodies of which are in the spinal ganglia of spinal nerves below C8. Primary neurons below L3 deliver their processes into the laminae of the dorsal horn. These processes, then, bend and ascend in the laminae to the L3 level. From L3 up to C8, incoming central processes and those in the dorsal columns project to the medial part of lamina VII. At this point, the central processes of primary neurons synapse with secondary neurons, the axons of which are, then, rerouted to the leateral funiculi as the posterior cerebellar tracts. Finally, they ascend and communicate with the cerebellum. Fibers of this tract are among the most rapidly conducting elements of the central nervous system.
Similarly to the posterior spinocerebellar tract, the cuneocerebellar tracts conduct impulses from muscle spindels, tendon organs and skin but of the upper part of the body. The primary axons enter the spinal cord above C8 and the secondary axons run rostrally as the cuneocerebellar tract [48].
2.1.4 Spinal cord pathologies
The spinal cord carries in a small cross-sectional area nearly the whole sensory input and motor output of the trunk and limbs. Thus, diseases in this part of the nervous system cause more damage than in any other [31]. The diversity of pathologies associated with the spinal cord’s sensory components are vast. This chapter focuses on spinal cord injury and chronic pain.
When the spinal cord is lacerated, it starts neurological damage in the spinal cord that is usually named primary injury. The mechanical injury produces a cascade of biological events, described as secondary injury, which results in additional neurological damage. Finally, there is the chronic
phase, which can occur days to years after the injury, leading to neurological impairments, in-cluding in brain regions. The chronic phase involves events such as white matter demyelination, exemplified in Fig. 2.7, gray matter dissolution, connective tissue deposition and reactive gliosis that lead to glial scar formation [88].
Figure 2.7: On the left, photomicrograph of cross section of the spinal cord just above the level of the lesion. The spinal cord section was stained for myelin, and the arrow shows a region of demyelination that demarcates the extent of the lesion, which interrupts the fasciculi gracilis bilaterally for a short distance on either side of the midline. On the right, ba drawing representing the extent of the demyelination. Adapted from [106].
The disability associated with irreversible spinal cord damage is determined primarily by the level of the lesion and by whether the disturbance in function is complete or incomplete [31]. A complete spinal cord injury (SCI) produces a total loss of motor and sensory function below the level of the injury, producing paraplegia or quadriplegia[31]. On the other hand, an incomplete injury causes damage in a limited section of the spinal cord, which leads to different disabilities depending on the areas affected. For example, anterior cord syndrome is associated with deficits referable to bilateral anterior and lateral spinal cord columns, which translates in loss of touch sensation, pain, temperature, and motor function below the level of the lesion. The posterior column functions of proprioception and vibratory sensation remain intact, though [9].
Other spinal cord syndromes include Brown-Sequard syndrome, which is caused by the dam-age to one half of the spinal cord, and central cord syndrome, the most common form of cervical SCI, causing loss of motion and sensation in the arms and hands.
Long-term complications after SCI may include respiratory, cardiovascular, urinary and bowel complications, spasticity, pressure ulcers, osteoporosis and bone fractures [84].
Despite the loss of sensory function, many patients with spinal cord injury experience chronic pain. The hyper-excitability of the sensory neurons of the dorsal horn is presented as the major causing factor [88].
2.1.5 Neuroprosthesis and the therapeutic potential of spinal cord stimulation
Neuroprosthesis have the potential to improve the quality of life of patients that have seen their mobility compromised either by a trauma or a disease in the spinal cord. By applying controlled electrical stimulation to paralyzed nerves and muscles, neuroprosthesis may restore part of their
2.1 The Spinal Cord 15
function [7,101,10]. This is particularity important in patients where the conventional pharma-cological approaches do not produce the intended results.
Contrary to what happens in the CNS, peripheral nerves when transected, exhibit regenerative abilities to a certain extent. Nevertheless, this process is slow and the target area may atrophy. By recording the electrical activity from the proximal nerve stumps, peripheral interfaces can produce motor commands for a neuroprosthesis, replacing central motor control. Furthermore, information can be translated into electrical impulses to excite the nerve, simulating tactile and proprioceptive sensation, thus, mimicking ascending pathways [7].
Clinical applications range from the control of micturition to activation of lower extremity motion and reduction of pain [68,22]. Regarding the latter, investigation has increased rapidly, since the first paper on pain inhibition by electrical stimulation, almost 50 years ago [86].
Currently available spinal cord simulation systems for the treatment of chronic pain aim to replace the pain sensation with paresthesia, a comfortable tingling sensation. These techniques usually deliver electrical impulses with a fixed frequency to the dorsal columns. Nevertheless, this method is compromised by shunting of energy by the cerebrospinal fluid (CSF) or lead migration. As a result, in recent years a new type of stimulation has risen, which consists in the direct stimu-lation of the dorsal root ganglia associated with the pain generating area. This method was linked with a greater quality of life [108].
The aforementioned methods deliver an electrical input to the neural target without sensing or automatically adjusting to the nerve fibers’ response to stimulation (open-loop stimulation) [82]. For this reason, the efficacy diminishes over time [49], since 29 % of patients develop tolerance [57], due to the plasticity of the nervous system. In response to tolerance development, the am-plitude of the stimulus is increased to achieve the same analgesic effect. Additionally, patients’ discomfort may increase with change in body positioning and current stimulation therapies do not adjust their settings accordingly [93].
As a result, there has been a development of techniques that aim to adapt the stimulus to the electrophysiological response of targeted neurons (closed-loop stimulation) [82].
A closed-loop system uses measured ECAPs (electrically evoked compound action potentials) as a feedback control mechanism to automatically maintain the desired recruitment levels. The ECAP amplitude is compared to a set point determined by the patient, in a feedback algorithm, and calculates a new stimulus amplitude by changing the input current. This process is repeated for every stimulus, resulting in a continuously adjusted current that maintains constant ECAP am-plitude [82]. Thus, a more consistent and improved pain relief is provided, allowing for stimulus adaptation to both prevent tolerance development and discomfort in position change [93].
Furthermore, present stimulation methods use extremely basic protocols, with very poorly defined spatial targets, and elementary temporal profiles (based sinusoidal signals limited to am-plitude and frequency definition). If we compare neurons in the dorsal horn to musicians in an performing orchestra, we are trying to restore proper dynamics using a maestro that attempts to coordinate the intricate spatiotemporal activity by blowing a horn. It is paramount to uncover the sensory integration circuits of the dorsal horn and the coding strategies in the ascending tracts in
order to devise effective and long-term therapeutic strategies (based or not in electrical stimulation) for spinal cord pathologies.
2.2 Electrophysiology 17
2.2
Electrophysiology
Electrophysiology concerns the study of the electrical activity of living cells and tissues. It is considered the main tool in neuroscience investigation, since it can capture a wide spectrum of neural events, from the electrical activity of a single neuron to the behavior of small populations, allowing for the decoding of intracellular and intercellular messages [20].
The recording of neuronal activity is only possible due to the electrical properties of the neuron and the dynamic behavior of its membrane, which enable the propagation and transmission of electrical impulses. These signals can be detected using electrodes, even at a distant source [69].
Electrophysiological approaches to record neuronal activity can be broadly separated into ex-tracellular and inex-tracellular recording techniques [105]. Intracellular methods, such as the patch clamp, expose in detail the cell’s membrane dynamics and electrical properties. However, com-promise the cell’s structure and, for that reason, prevent long duration recordings. Conversely, extracellular techniques monitor the neuronal activity from outside the cell, measuring patterns of action potentials from neuronal populations, allowing for the examination of population behav-ior and the study of pathologies. Extracellular methods include electroencephalography and, at a smaller scale, multi-electrode arrays. This dissertation concerns the development of computa-tional tools for study of spinal local circuitry, thus only small-scale recording methods, such as the patch clamp and MEAs, will be addressed. But, first, as to fully comprehend the principles behind electrophysiology recording methods, this chapter begins with an overview of neuronal membrane dynamics.
2.2.1 Neuronal membrane dynamics
Neurons are highly specialized cells, both in morphology, as described in section2.1.1, and in physiology. In fact, the neuron’s membrane possesses a wide variety of ion channels. Structures that allow ions, predominantly sodium (Na+), potassium (K+), calcium (Ca2+) and chloride (Cl−), to move through the cell’s membrane, giving it a semipermeable character. Ion channels control the flow of ions across the cell’s membrane by opening and closing in response to voltage changes and both internal and external signals [24].
The flow of ions across the membrane causes a difference in the distribution of charges in the exterior and interior of the cell, generating an electrical field across the membrane. Any structure that keeps electric charges separated by a fixed potential, can be modeled as a capacitor. So, the cell’s membrane can also be viewed as one. This uneven distribution of charges leads to a difference in electrical potential across the membrane, that is, under resting conditions, -70 mV, since the interior of the cell is negative.
Ionic flow across the membrane can be attributed both to voltage changes and concentration gradients. When positive ions move to the exterior of the cell, the membrane’s potential decreases. This phenomenon is called hyperpolarization. On the other hand, when the current is negative, the membrane potential increases, in a process named depolarization [26].
Action potentials or spikes occur when the membrane potential at a specific location suddenly rises and, then, falls, characteristic pattern. This is, a depolarization followed by a hyperpolariza-tion, which translates in an electrical potential fluctuation of roughly 100 mV, that lasts about 1ms [35]. They occur following a stimulus, when there is a sudden change in the permeability of the membrane, that causes the ions to flow across it [26].
After that, there is a refractory period, in which Na+ channels are inactive. Therefore, any stimulus given to the cell will not trigger another action potential, no matter how strong it is.
2.2.1.1 Hodgkin-Huxley model
The Hodgkin-Huxley model describes the generation and propagation of action potentials. It was first proposed in 1952 [45], and is still used nowadays as the basis for computational neuro-science modelling. This model assumes that the cell membrane can be represented as an electrical circuit, as described in Fig.2.8. The explanation, hereafter presented is based on [92]. The
mem-Figure 2.8: The Hodgkin–Huxley equivalent electrical circuit, representing the cell’s membrane. Adapted from [92].
brane is, therefore, characterized by a capacitor, Cm, and three ionic currents: a sodium current,
INa, a potassium current, IK, and a leakage current, which represents the sum of some factors that
contribute to the total membrane current that can be assumed to be relatively constant [24]. Each ionic channel is described as a battery in series with a resistance. The current can be calculated using equation2.1, where the sodium, potassium and leak conductances are represented by gNa,
gK and gL,respectively, and ENa, EK and ELare the corresponding equilibrium potentials. gLis
constant, whereas gNaand gK change with voltage.
2.2 Electrophysiology 19
The equation that corresponds to the circuit drawn is given by2.2. Where Ii corresponds to
the sum of the ionic currents and Ic represents the capacitive current.
I= Ic+ Ii= Ii+Cm
dV
dt (2.2)
For the description of the ion currents, it is assumed that the membrane contains a number of gates, which can be either closed to the passage of all ions or open to the passage of potassium ions. Each gate is controlled by a number of gating particles, that can be either in a closed or open conformation. The transition between one state and the other is dictated by the membrane poten-tial. Considering that the particles are independent of each other, the probability of the entire gate being open is nx, where n is the probability of a single potassium gating particle being in the open state and x is the number gating particles in the gate. Therefore, the membrane conductance for potassium can be calculated by2.3, considering the probability of it being open and the maximum membrane conductance gk. Experimentally, the number of gating particles was found to be equal
to 4.
gk= ¯gknx (2.3)
However, the same behaviour is not observed for the sodium ion. The sodium conductance de-cays, after it reaches a maximum, even when applying voltage to the membrane. This phenomenon is called inactivation. To discriminate the inactivation level of the gate particles, the variable h was introduced. Variable m identifies the sodium activation, similarly to the variable n for the potas-sium activation. Experience shown that the number of gating particles can be approximated to 3. This way, the conductance for the sodium ion can be observed in equation2.4.
gNa= ¯gNam3h (2.4)
Thus, combining equation2.3,2.4,2.2and2.1, one can deduce the Hodgkin and Huxley equa-tion to describe the membrane potential, equaequa-tion2.5, where ILC corresponds to the contribution
of the axial current from the vicinity regions of the axon.
Cm
dV
dt = − ¯gL(V − EL) + ¯gnam
3h(V − E
Na) + ¯gkn4(V − EK) + ILC (2.5)
The Hodgkin-Huxley model can also describe the propagation of an action potential along an axon, however, to do so a multi-compartment model, which can describe spatial variations in the membrane potential, must be developed [24].
2.2.2 Instrumentation
The available tools to record neural activity depend on the scale one intends to observe it. In spite of patch clamping enabling the accurate recording of electrical activity, it only does it for a few neurons. In contrast, methods such as functional magnetic ressonance imaging detect activity in