Improving Soil Primary Productivity Conditions with
Minimum Energy Input in the Mediterranean
Elsa Sampaio and Júlio C. Lima
Additional information is available at the end of the chapter http://dx.doi.org/10.5772/52466
1. Introduction
As stated by the editors Brandt, C. and Thornes, J., 1996, “Both the vegetation and land use in the Mediterranean areas of Europe strongly reflect human activity since at least the Bronze Age”. Putting it briefly for the recent past ca. ninety-year period, the natural land‐ scape covered by the original “silvalusitana” has been deforested for agricultural purposes and substituted by monocultures of cereal crops, mainly wheat and barley, aiming at trans‐ forming the overall Alentejo region, southern continental Portugal, into the “granary of Por‐ tugal” (Pedroso, M. et al., 2009).
The so transformed natural landscape resulted in what has been called cereal steppe or pseudo-steppe, since the 1930´s, when the “wheat campaign” started (Pedroso, M. et al., 2009). However, such a “new” land-use system soon revealed to be aggressive to the envi‐ ronment and of discussable sustainability for the soil physics, chemistry and ecology. Nega‐ tive impacts to the landscape physiognomy and dynamics and also soil quality have been declared when it has been realized that the initial and abundant soil organic matter (SOM) content (say then, the original (accumulated) soil’s capital”) was inexorably exhausted due to its induced unbalance. In fact, the regional, Mediterranean climate is prone to accelerate the SOM mineralization process in combinations with the intensification of the crop produc‐ tion system through, for example, the action of mechanical soil ploughing practices.
The persistence in space and time of such un intensive rain-fed, land use system for cereals production has let to the lessening of (1) crops dry matter (DM) production per hectare (ha), or yield; (2) rain-water use efficiency (WUE); (3) the light/radiation use efficiency (LUE) and (4) the overall efficiency of the energy-input into the agro-ecosystem per unit crop DM pro‐
© 2012 Sampaio and C. Lima; licensee InTech. This is an open access article distributed under the terms of the Creative Commons Attribution License (http://creativecommons.org/licenses/by/3.0), which permits unrestricted use, distribution, and reproduction in any medium, provided the original work is properly cited.
duced. The promotional motivation for national self-sufficiency of food, mainly wheat (and other correlated cereals) has generated the dominant, monoculture production system al‐ ready described above. The way the production system has evolved ultimately originated the present, semi-anthropogenic rural landscape with sparse tree-cover and whose general physiognomy still reflects a history of severe soil erosion by run-off and increasing land use extensification, continuous biophysical degradation of soils, regional desertification risk and environmental hazards.
The sustainable exploitation of the natural resources in agro-ecosystems for improving the primary and secondary production of food, fibbers and bio-energy must be explicitly as‐ sumed as a common framework for policies and decision-makers worldwide. A fundamen‐ tal pillar that should support such a collective goal (e.g., of food safety) is the ecological principal of sustainability of the agro-ecosystems by putting in practice a set of rational prin‐ ciples for agriculture, soil and on farming water management.
The present-time context of “global changing” that affects the “Earth [as an auto-regulated] system” (Journal of Earth System Science, 2012: http://www.springer.com/earth+sciences +and+geography/journal/12040) claims a great effort to improve the rational exploitation of the natural resources that constitute the primary agro-ecosystems input-factors, namely, the atmospheric radiant energy (solar radiation), carbon dioxide (CO2) gas and liquid water, as
rain (precipitation) (Brandt, C. and Thornes, B., 1996; Bolle, H. et al., 2006; IPCC, 2001; Le Houérou, H., 1996;Monteith, J., 1972). These are the three basic “raw materials” supporting plant photosynthesis, the biophysical process which is responsible for the energetic autono‐ my of any plant and terrestrial ecosystem (Monteith, J., 1972).
In the particular case of the rain-fed Mediterranean agro-ecosystems, the typical seasonality of the annual distribution and inter-annual variability patterns of precipitation, often gener‐ ate situations of soil-water (soil-moisture) shortage and thus intense plant water-stress dur‐ ing their developmental cycles that spans in spring-summer, rainless season (e.g., Brandt, C. and Thornes J.,1996; Tenhunen, J. et al., 1987).
By the way, based on the ratio “mean annual precipitation (MAP)/MA-Potencial Evapo‐ transpiration (PET)” − the aridity index, where PET = ETo, as calculated using the Penman-Monteith formulation − the Mediterranean-type climates are semi-arid climates (Le Houérou, H.,1996; World Climate Classification System, 2009), which means these areas are under desertification risk, according to updated biophysical indicators (Brandt, C. and Thornes J.,1996; Bolle, H. et al., 2006).
One realizes that the general diagnosis of desertification is the continuous biophysical deg‐ radation of the affected ecosystem; also the actual ecosystem’s equilibrium state is reflected, for instance, on the destruction of soil aggregates, soil structure disorganization, lessening of the soil organic matter, soil-water contents and increasing soil erosion (e.g. Brandt, C. and Thornes J., 1996). Altogether these “active agents” trigger a series of desertification-promot‐ ing processes, interconnected through positive feed-back loops, leading the ecosystem to a
state of significant lesser overall biomass production. All these environmental threatsulti‐ mately induce a decrease in the ecosystem maximum carrying capacity, relative to that a healthy ecosystem could bear with the same genotypes, under the same edaphic and climat‐ ic conditions. Several case-studies in the Mediterranean are described in the text-book edited on this issue (Brandt, C. and Thornes J., 1996).
In the context of this chapter, the potential maximum net primary production (NPPp) of the most sustainableagro-ecosystem is analysed via the soil-water balance (SWB), the actual available soil-water (ASW) for the soils having different effective soil-depths (and water res‐ idence time) for plant rooting, in connection to the precipitation regime and infiltration depth (Rodriguez-Iturbe and Porporato, A., 2004). Thus, this chapter focuses on the analysis of the technical viability of alternative agricultural practices to be adopted as intended to re‐ verse soil degradation processes in terms of their impacts on the soil physical-hydraulic properties and SWB terms as compared to the control-system’s prior state of evolution. The perspective outlined, as above, supported as the main objective of this study the adop‐ tion of some intervening measures towards the restoration of degraded soils to ultimately re-establish a good level of soil fertility indexes for plant health and integrated land manage‐ ment. The integrated approach should be able to augment the overall ecosystem WUE, basi‐ cally in part due to a higher water reservoir capacity than it was in the former soil-degraded phase. Note that, for a given crop, the WUE is a quasi-inverse function of the atmospheric air vapour pressure deficit (VPD); WUE is higher when plants are experiencing some level of water stress (Tenhunen, J. et al., 1987). The soil-water reservoir capacity (a proxy of effective soil depth for plant rooting), along with the structural stability, is the main soil feature to be promoted in the first phase of a soil restoration programme, if any. This is followed by installing crops as part of a rotational scheme.
Relative to agricultural activity under present Mediterranean, water-controlled agro-ecosys‐ tems, the parameter “plant water-use efficiency” of the cultivated varieties (cultivars) sub‐ jected to the traditional, intensive land-cultivation system (i.e., TS), may be a key criterion to deal with, if one’s objective is to improve agriculture practicing based on adequate water and soil management. This goal is more important in ecosystems whose biophysical diag‐ nostic reveals a degraded soil/substrate, such that it requires either conservation or remedia‐ tion practice to mitigate or reverse the positive feed-back (FB+) loops of the complex, natural
dynamics of the desertification process (Lima, J. and Sequeira, E., 2004).
2. Problem statement
2.1. From the traditional to conservation agriculture
After farmers and agronomists, and policymakers have realized the negative impacts of the cereal monoculture system through the decreasing productivity per ha cultivated land-area
and of soil buffering capacity for water conservation, they decided to implement mitigation measures against the negative pressure the production system was exerting on the environ‐ ment. The mitigation measures involved the adoption of a crop-rotational scheme that is now designated the “traditional rotational system” (TS) of cereal crops production in the Alentejo. In effect, the cultural rotation has been based on cultivated varieties (cultivars) of wheat (Triticum sp.) and barley (Scale sp.) as the autumn/winter crops, followed by spring/ summer ploughed-field, often “covered” with the water-stress resistant, oil-seed crop sun‐ flower (Helianthus annuusL.). Eventually this last “(crop-)covered”, ploughed-field technique was just substituted by fallow (consisting of, and according to the Webster’s Dictionary, as “n”: a) “usually cultivated land that is allowed to lie idle – i.e. not occupied, useless - during the growing season, for one or two consecutive years”; or b) the tilling of land without sow‐ ing it for a season; as “vb”: “to plough, harrow, and break up land without seeding to de‐ stroy weeds and conserve soil moisture”; as “adj”: “left untilled or unsown after ploughing”).
Yet, by the middle eighties, the paradigm of land-use management has changed again fol‐ lowing the integration of Portugal into the (former) EC, since the land-area of cereals (wheat and other species) has retreated over 35% under the “set-aside” agro-environmental political measure. Then, farmers with lands under site-aside should receive compensatory pecuniary payments aiming at protecting and stabilizing farmers´ incomes (Agri-environmental indi‐ cators, 2010) according to the CAP (Common Agriculture Policy) framework and legal mechanisms of election. Pedagogically, the set-aside principle of rural landscape manage‐ ment has opened an intense, intellectual debate based on the tension that arose around the “intensification/extensification” antagonism, dealing with rain-fed agro-silvo-pastoral pro‐ duction systems in the Alentejo (Pinto-Correia, T. and Mascarenhas, J., 1999). The fact is that technically the “set-aside” meant the conversion of acreages previously under the traditional system (TS) into abandonment, which is an extreme, useless extensification situation from the farmer’s standpoint.
Lands under set-aside are presently claimed for an alternative, ecologically sustainable mod‐ el for primary and secondary production systems. Ideally, in such a system, plants should be integrated in a food, fibre and energy-crop production system of minimum energy-input by specifically adopting no-tillage technique and null conventional fertilizer application (Jørgensen, U. and Kirsten, S., 2001; Dumanski, R. et al., 2006).
In extending the idea of energy-conversion efficiency improvement, the more adequate agro-technical itinerary, that is intended to be adopted, should minimize the fuel-oil-derived energy input into the agro-ecosystem through the application of “the modern agriculture technologies to improve production while concurrently protecting and enhancing the land resource on which production depends” (Dumanski, R. et al., 2006). This quotation introdu‐ ces and greatly defines the concept of “conservation agriculture” (CA) whose main concepts and proposed techniques are thoroughly revised by Dumanski, R. et al., 2006 and summar‐ ized at the thematic Food Agriculture Organization’s (FAO) and European Conservation Agriculture Federation (ECAF) websites on this issue.
Apart present time legislation framework on items related to conservation agriculture, the acreage under CA is increasing worldwide, but slowly in Europe (Dumanski, R. et al., 2006; ECAF, 2012). As examples upon local CA programs, a cost-benefit analysis of a case-study in Portugal is available for Castro Verde, in the inner-Alentejo (Pedroso, M. et al., 2009). For a broader scale, Kassam, A. et al.,(2012), offer a comparative overview of the importance of trade-off between CA practice (that is recommended) and the return value attributed to some selected features linked to the agro-environmental services, in countries having Medi‐ terranean climate, that leads to a soil organic matter content that is chronically low to very low (Zdruli, P. et al., 2004; Bach, G. et. al., 2008).
The “cornerstone of conservation agriculture is the zero-tillage (seeding) technique and oth‐ er related soil conservation practices” (Dumanski, R. et al., 2006). A recent inventory analy‐ sis shows that CA is increasing worldwide and particularly in countries having dry Mediterranean climate, including Portugal (Kassam, A. et al., 2012). The, now revised, alter‐ native perspective offered under CA practicing allows the rational management of the natu‐ ral, local resources for crop production, as well as their use and conservation, like soil fertility, available soil-water and solar radiation energy inputs. Philosophically, one should think of “any fraction of the available water and of solar radiation that enter an agro-forestry ecosystem could not be lost”. This philosophy implies a land surface area unit fully covered by active vegetation all along the year and, in practice, it is equivalent to say that the ASW and net solar radiation (Rn) waste has to be minimized and their efficient use maximized un‐
der ecosystems management, while guaranteeing an adequate plant nutritional state too. From the territory management viewpoint, the reclamation of the “unproductive” lands un‐ der set-aside into an ecologically, and operationally sustainable agricultural use can be done through the establishment of an adequate “technical itinerary” aiming at stabilizing in time the subsequent crop production. In turn, this “re-built” production system should promote cultural biodiversity (under rotational agriculture) to “compensate” (or substitute) biomass production for fluctuating opposite behaviours of different species, or cultivars, while re‐ sponding to local climate and features of soil fertility during a given hydrologic year. This is an expectable situation if the crops´ respective life cycles can partially overlap, as the case study involving oilseed rape (Brassica napusL.) and sunflower in a fertile, clayey soil, has shown at Beja, Portugal (Lourenço, M. et al., 2000).
Under CA this plant production scheme is thought to optimize both WUE and LUE. These are two complementary, key eco-physiological parameters which can be used to describe the growth of plants. To accomplish this strategy in Mediterranean, rain-fed areas, fertile soils that can be selected are deep clayey soils with high water-holding capacity (WC) and cation-exchange capacity (CEC), for indicating only two indicators of soil fertility. Besides, the se‐ lection of plants species (the commonly used, or alternative, crops) of actual genomes should consider their propensity for (1) high values of both WUE and LUE; (2) deep root systems; (3) duration of the growing season and associated lower-temperature threshold and high relative growth rate (RGR) interactions and short lost-time for emergence (Gou‐ driaan, L. and Monteith, J.,1990; Monteith, J., 1993), also (4) multi-purpose specimens and (5) cultural biodiversity, for instances, for biological control of plagues.
Finally, as water is certainly the major factor limiting crop production in the Mediterranean areas, attention is essentially drawn on the efficient water use in crop production (Monteith, J. 1993).
2.2. Water-Use Efficiency (WUE) of crop production
The WUE may be determined at the leaf level, for instantaneous gases exchange measure‐ ments (stomatal conductance, transpiration and photosynthetic rates), or long-term amount (gram, g), of plant-assimilated dry mater (biomass), divided by the concurrently amount of transpired water (kg) (Tanner, C, and Sinclair T., 1983). The magnitude and units of the WUE-parameter depends on the chosen computational base (or reference) selected to ex‐ press it numerically, examples being per unit molar-mass of glucose (C6H12O6) or CO2 mole‐
cules or an atom of carbon (C). The choice determines a mass-based scale of WUE, its “absolute scale” being a function of the atmospheric air vapour-pressure deficit (VPD, say, in kPa), which in turn is a function of the air temperature at the reference height of 2-m above plants/vegetation canopy. By the way, Lindroth, A. and Cienciala, E. 1996 found a unique relationship between the WUE and the VPD (the argument-variable) valid for leaf, tree and stand levels for willow (Salix viminalisL.) forests, in Sweden.
On the other hand, the product VPD × WUE defines the “normalized scale of WUE” (or
NWUE), which is quite invariant over a specified range of VPD, plant species and both C3
and C4 photosynthetic pathways (Jørgensen, U. and Kirsten S., 2001; Monteith, J., 1993; Tan‐
ner, C, and Sinclair T., 1983). Else, these three bibliographical references offer typical values of the NWUE for different geographical locations, in units of g [dry matter (DM)] per kg [water] times VPD (in kPa).
3. Material and methods
3.1. Location and characterization of the experimental site
The field trials were carried out on two regional, representative soil types under two differ‐ ent land-cultivation systems for crop production, in the rain-fed areas of the inner-Alentejo‐ Province, southern continental Portugal. The study site (Herdade da Almocreva) is located nearby Beja town and reference geographical coordinates (relative to the International Meri‐ dian) are 37º 59’ 48’’ N; 37º58’50’’ S; 7º 58’ 00’’ W; – 7º 55’ 32’’ E.
3.1.1. Climate
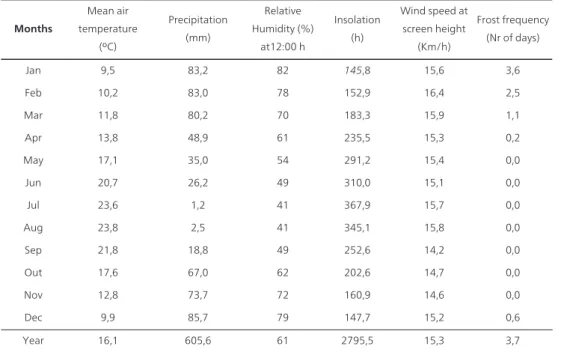
The Köppen´s climatic classification scheme characterizes the overall Portuguese continental territory as having a warm, temperate subtropical Mediterranean climate of the type Cs; this type of climate identifies a hot, dry summer season in which the sum of the monthly precipi‐ tation of the driest consecutive three months (June – August) is less than 30 mm (Table 1).
Months Mean air temperature (ºC) Precipitation (mm) Relative Humidity (%) at12:00 h Insolation (h) Wind speed at screen height (Km/h) Frost frequency (Nr of days) Jan 9,5 83,2 82 145,8 15,6 3,6 Feb 10,2 83,0 78 152,9 16,4 2,5 Mar 11,8 80,2 70 183,3 15,9 1,1 Apr 13,8 48,9 61 235,5 15,3 0,2 May 17,1 35,0 54 291,2 15,4 0,0 Jun 20,7 26,2 49 310,0 15,1 0,0 Jul 23,6 1,2 41 367,9 15,7 0,0 Aug 23,8 2,5 41 345,1 15,8 0,0 Sep 21,8 18,8 49 252,6 14,2 0,0 Out 17,6 67,0 62 202,6 14,7 0,0 Nov 12,8 73,7 72 160,9 14,6 0,0 Dec 9,9 85,7 79 147,7 15,2 0,6 Year 16,1 605,6 61 2795,5 15,3 3,7
Table 1. Mean monthly values of climatic variables recorded at Beja (37º 59´ N; -7º 57´W) (1951-1980):
Soil Vc / TS Depth limits of soil layers (cm)
Classes of soil particles Units 0.0 – 10 11 – 20 21 – 30 31 – 40
Coarse sand % 5.7 4.4 5.5 3.1
Fine sand % 11.1 11.4 11.6 10.2
Silt % 20.1 20.4 19.9 25.5
Clay % 63.1 63.9 63.0 61.2
Texture class Clayey Clayey Clayey Clayey
Coarser elements % 9.1 10.8 17.6 45.6
Soil Bvc / TS Depth limits of soil layers (cm)
Classes of soil particles Units 0.0 – 10 11 – 20 21 – 30 31 – 40
Coarse sand % 7.5 7.2 6.4 5.3
Fine sand % 13.4 18.0 12.5 10.2
Silt % 23.4 19.2 22.3 24.6
Clay % 55.7 55.6 58.8 59.9
Texture class Clayey Clayey Clayey Clayey
Soil Vc / DS (10) Depth limits of soil layers (cm)
Classes of soil particles Units 0.0 – 10 11 – 20 21 – 30 31 – 40
Coarse sand % 5.7 3.8 3.5 4.2
Fine sand % 11.9 12.1 10.7 11.8
Silt % 18.8 19.3 18.0 19.1
Clay % 63.6 64.8 67.8 64.9
Texture class Clayey Clayey Clayey Clayey
Coarser elements % 10.7 10.1 8.2 33.5
Soil Bvc / DS (10) Depth limits of soil layers (cm)
Classes of soil particles Units 0.0 – 10 11 – 20 21 – 30 31 – 40 41 – 50 51 – 60
Coarse sand % 7.1 6.3 5.8 4.9 4.5 3.2
Fine sand % 17.4 17.5 16.3 10.8 12.7 15.3
Silt % 23.5 24.6 22.5 19.9 20.0 20.2
Clay % 52.0 51.6 55.4 64.4 62.8 61.3
Texture class Silty clay Silty clay Silty clay Clayey Clayey Clayey
Coarser elements % 7.1 6.7 6.6 6.2 5.4 5.1
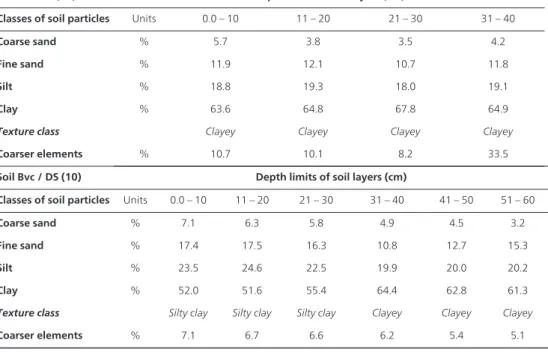
Table 2. Mass fractions of the mineral components and coarser elements
Soil Vc / TS Depth limits of soil layers (cm)
Parameters Units 0.0 – 10 11 – 20 21 – 30 31 – 40
Bulk density g cm-3 (= Mg m-3) 1.53 1.55 1.57 1.64
Resistance kgf cm-2 (=0.098 MPa) 32 35 39 37
Soil Bvc /TS Depth limits of soil layers (cm)
Units 0.0 – 10 11 – 20 21 – 30 31 – 40 Bulk density g cm-3 (= Mg m-3) 1.45 1.59 1.63 1.66
Resistance kgf cm-2 (=0.098 MPa) 34 39 42 31
Soil Vc / DS
(10) Depth limits of soil layers (cm)
Units 0.0 – 10 11 – 20 21 – 30 31 – 40 Bulk density g cm-3 (= Mg m-3) 1.53 1.46 1.45 1.51
Resistance kgf cm-2 (=0.098 MPa) 49 46 40 36
Soil Bvc / DS
(10) Depth limits of soil layers (cm)
Units 0.0 – 10 11 – 20 21 – 30 31 – 40 41 – 50 51 – 60 Bulk density g cm-3 (= Mg m-3) 1.36 1.53 1.51 1.52 1.45 1.39
Resistance kgf cm-2 (=0.098 MPa) 50 49 46 45 41 39
Soil Vc /TS Depth limits of soil layers (cm)
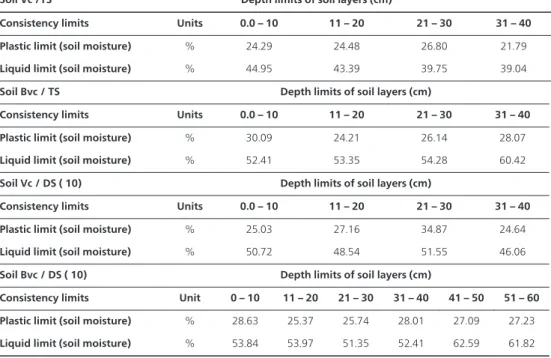
Consistency limits Units 0.0 – 10 11 – 20 21 – 30 31 – 40 Plastic limit (soil moisture) % 24.29 24.48 26.80 21.79 Liquid limit (soil moisture) % 44.95 43.39 39.75 39.04 Soil Bvc / TS Depth limits of soil layers (cm)
Consistency limits Units 0.0 – 10 11 – 20 21 – 30 31 – 40 Plastic limit (soil moisture) % 30.09 24.21 26.14 28.07 Liquid limit (soil moisture) % 52.41 53.35 54.28 60.42 Soil Vc / DS ( 10) Depth limits of soil layers (cm)
Consistency limits Units 0.0 – 10 11 – 20 21 – 30 31 – 40 Plastic limit (soil moisture) % 25.03 27.16 34.87 24.64 Liquid limit (soil moisture) % 50.72 48.54 51.55 46.06 Soil Bvc / DS ( 10) Depth limits of soil layers (cm)
Consistency limits Unit 0 – 10 11 – 20 21 – 30 31 – 40 41 – 50 51 – 60 Plastic limit (soil moisture) % 28.63 25.37 25.74 28.01 27.09 27.23 Liquid limit (soil moisture) % 53.84 53.97 51.35 52.41 62.59 61.82 Table 4. Soil consistency limits
The virtually rainless early-spring and (the subsequent) summer season, followed by the typical winter (markedly from November to March), rainy season and low temperature re‐ gime does not promote as an intense as desirable vegetation activity (growth/development) for primary dry mater (biomass) production. In fact, these limiting factors are among the main atmospheric determinants of Mediterranean environments for the selection of both (crop) cultivars and the production systems to implement at the local and regional scales. These local limitation relies on two major aspects: (1) the optimum combination of required heat units (thermal-time) and the available soil water (ASW) for optimal plant growth and development is generally absent and (2) during the rainy season, the combination of short-daylight length and low temperatures are harmful to vegetation activity which is empha‐ sized under soils characterized by deficient drainage, a common negative feature of the soils in the Alentejo.
3.1.2. Relief
The terrains in the study area have generally gentle or very gentle to quasi plane slopes. A set of twenty soil profiles aiming at the study of soil properties had been dogged on very gentle to plane (0 to 2%) mid land-hill positioned in the landscape, facing south-east, the dominant local landscape aspect.
3.1.3. Soil units
In the Portuguese, national main soil survey ever conducted for the Southern continental territory (Cardoso J., 1965), both experimental fields have been installed on the same soil types, namely, a VerticCambisol (Vc; Portuguese Nomenclature (PN)) and a Chromic Vertisol (Bvc; PN), as they are classified on the available soil map Nº 43C of the “Carta dos Solos de Portugal”, the Portuguese Soil Map (hereafter PSM) on the cartographic scale of 1:50 000. The soil labels “Bvc” and “Vc” stand for the designation used in the Portuguese soil classifi‐ cation system.
Pedo-genetically, these Vc and Bvc soil types encompass relatively incipient soils with typi‐ cal pedologic profile that consists of a sequence of horizons A/C or A/B/C of calcareous ma‐ terials(with sub-layers in some cases) and the mean depth of the C horizon goes down to 40-60 cm below ground. The difference between the two soil units is established through the B horizon, that is, Bc in Vc soils, and Btx in Bvc soils. A prominent feature of the Bvc soils is their higher content in expansive clay minerals of the type 2:1 bi-layer structure, as the montmorillonite in this case, that are self-mulching, a process associated to the alternating seasonal swelling (watering) and shrinking (drying) processes. The high concentration of montmorillonite clay of these soils determine some of their relevant physical properties, such as a high plasticity, hardiness, anisoform structure at the more surfacial layers that changes to the prismatic in the B horizon, slick-in-side planes, surfacial and deep cracking under desiccation; in the B (if any) and C horizon it is common noting the occurrence of manganese concretions. Other properties directly determined by the presence of montmoril‐ lonite clay are, for instance, the high “cation-exchange capacity” (CEC), soil pH > 7, and the ability to accumulate soil-organic matter.
Both soil types involved in the study were present in the two experimental fields where they have been subjected to the same land-production (land-cultivation) systems next described. 3.2. Characterization of the land-production systems
The traditionally intensive crop-production systems (TS) imposed on both Bvc and Vc soils are based on rotational schemes of rain-fed agriculture of cereal crops (i.e., winter-sowing wheat, late-winter-sowing barley and sunflower in mid-spring). However, an alternative ag‐ ricultural rationale, the low-tillage, or low-ploughing system is now an increasing agricul‐ tural practice in dry Mediterranean countries, including Portugal (Kassam, A. et al. 2012), as is the case of direct (say no-tillage) seeding (SD) system. By this reason, the TS and the DS (or zero-tillage system) under a Mediterranean environment will be analysed in this chapter by taking the former as the ecosystem’s initial state and, the later, as the alternative system for soil conservation. Both TS and DS are known to differ in the amount of energy input re‐ quired to produce a unit-mass (or weight) of plant/crop biomass and, also, in their diverse environmental impacts and soil water conservation.
Because the biomass, or plant dry matter production (DM) has not been quantified during the experiments described here, the expected grain yields (Y) and correlated harvest indexes
(HI) factor of the following crops were collected in the literature (e.g., Ahmad R. and Jabran K., 2007):
Crop species Mean grain yield (kg/ha) Harvest index (HI) Wheat (Triticumaestivum L.) 3 000 0.5
Barley (Hordeumvulgare L.) 2 000 0.5
Sunflower (Helianthus annuus L.) 1 600 0.4 Table 5. Insert table caption if needed
In turn, total dry mater (DMT) production will be estimated based on known plant dry ma‐ ter partitioning coefficients (e.g. Stockle, C. and Nelson, R., 1996). Notice that both TS and DS crop-production systems integrated those same crops and rotational schemes (see bel‐ low) whilst their main differences relies on the types of soil tillage, weed control and fertili‐ zation criteria (Sampaio, E., 2002).
It follows the characterisation of both crop-production systems already referred to.
3.2.1. Traditional Rain-Fed System (TS) = Ecosystem initial state
Crop rotation - (soft wheat→ barley → sunflower)associated to the following schemes deal‐ ing with land tillage, cropdisease control and nutrient applications.
• Soft-wheat – The seed-bed was prepared with two cross-deep ploughings down to 30-cm of the soil depth. Seeding proceeded with an in-line seeder and soil-surface roller. A phy‐ to-sanitary prevention measure was taken. As demanded by the crop, it was used a chem‐ ical fertilizer containing the three primary (main) macro-nutrients (N, P, and K), namely 250 kg/ha of the “10-14-36” composed fertilizer for a prior fertilization at seeding and 70 kg/ha of N in a covering fertilization at the inner-spring.
• Barley – As for wheat, the seed-bed was prepared with two cross-deep ploughings down to 30-cm of the soil depth and seeding proceeded using an in-line seeder and rolling the ground. A phytosanitary, chemical product was used for preventing plant diseases; min‐ eral fertilization was accomplished using250 kg/ha of “10-14-36” fertilizer at seeding and 46 kg/ha of N to covering in the inner-spring.
• Sunflower– in preparing the seed-bed the soil is initially submitted to deep-ploughing down to 30-cm of the soil depth, followed by shallower steam-ploughing (< 10-cm below the ground surface) and some times passes with cultivator shanks, depending on the ac‐ tual soil hardiness. Subsequent seeding, croskiling and usually two mechanical weeding during the vegetative period follow. Neither phytosanitary nor nutrient application was made..
3.2.2. Direct-Seeding System (DS) = Ecosystem final state
Crop rotation - (soft wheat→ barley → sunflower)adopting the direct-seeding agro-techni‐ que for a continuous period that spans 10 consecutive years. Referring to the mechanical soil preparation, phyto-sanitary treatments and mineral fertilizations, for all crops, the weed-control technique were applied in the pre-emergence phase by using a mixture of an inte‐ gral, systemic and no-residual herbicide, and an hormonal herbicide against the broad-leaved weedy species. Only 10 days later the direct seeding treatment was able to be executed using a proper seeding-machine.
• Soft-wheat – it was applied an initial, deep fertilization (N and P) at the rate of 230 kg/ha of the “18-46-0” composed fertilizer, at seeding. Early in spring nitrogen was top dressed with 70 kg N per hectare (ha) and also performed a new weed plants control.
• Barley – A deep fertilization (N and P) was made simultaneously at seeding with 200 kg/ha of the “18-46-0” composed fertilizer; it fallowed top dressed (fertilization) with 80 kg/ha of N. In the beginning of spring new chemical control on the weeds took place. • Sunflower – nor fertilization neither weed control was done in spring.
3.3. Field work
Tasks in the open had been carried out in the two experimental fields on both two types of soil that have been subjected to both (DS and TS) land-production systems. For each of the four (n = 4) combinations resulted from the two soil types under the two cultivation systems, it were dogged five (n = 5) representative soil profiles to totalize 20 of them. The soil-type × production-system output was as follows:
• Profile type 1 – DS10/Bvc: Soil Bvc subjected to direct seeding (DS) for a consecutive ten (10) year time-period;
• Profile type 2 – TS/Bvc:- Soil Bvc subjected to the traditional system (TS) for more than a 10 year time-period;
• Profile type 3 – DS10/Vc: - Soil Vc and direct seeding (DS) for a consecutive ten (10) year time-period;
• Profile type 4 – TS/Vc:- Soil Vc and traditional system (TS) for more than a 10 year time-period.
Among other properties, also of interest in this study, are the identification of the soil tex‐ ture classes for soil particles diameter and water properties computations and also the soil-water retention (pedotransfer) function fitting.
3.4. Soil sampling criteria
These soils have been characterized after excavating five representative soil profiles per soil type, thus an overall of 20 soil profiles have been surveyed by sampling specific properties on soil physics, chemistry and hydraulics. In the sixth and tenth (last) year of the beginning
of the experiment, the soils survey have been performed in May, when the dried, finest (clayey) soil experienced its seasonal swelling process.
The ensemble of soil properties elected to characterize the ecosystems´ initial and final states (then, of the experiment time span) have been surveyed at depth, with a constant 10-cm ver‐ tical increment, from the ground surface down to the upper-boundary of the C-horizon, of variable depth, between 40 cm and 60 cm below ground. The survey involved all the 20 soil profiles sampled for: soil texture and volumetric mass (soil density); soil strength; soil-ma‐ tric water-retention-curve (WRC); porosity of the porous media,; mechanical consistence (re‐ lated to the “physical resilience of soils, their ability to resist deformation under stress” (Kimmins, J.,1997), for plasticity and liquid-limits of the soil fine-earth fraction; actual size of the aggregates and aggregation index; the soil organic-matter (SOM) content; typology and size classes for the continuity of such vertical soil pores distribution, as well.
In the field it was evaluated the soil strength and, for statistics, five (n = 5) replications per soil layer (of 10 cm) were taken for averaging results as arithmetic means. Five (n = 5) stand‐ ard soil-sampling cylinders (internal volume = 90 cm3) per soil layer were collected, hermeti‐
cally conditioned in the field and transported to the laboratory for subsequent analysis. Five soil samples, weighting 1 kg, were collected each 10-cm depth increment in all soil profiles. 3.5. Physical analysis
Texture and coarse materials – the mass fractions of the fine-earth mineral components (sand, silt and clay) for soil textural classification and the coarser materials present in the same soil samples were based on sieving separation and mechanical analysis.
Bulk density (BD), the mass per unit volume of soil – despiteits numeric value, the soil BD (106 g m-3) is an integrating parameter that results from the combined effect of texture, ag‐
gregates structure and dimensions, intrinsic porosity and organic matter content. This pa‐ rameter has been determined on intact soil samples.
Soil Strength and Penetrometry - a portable cone-shaped penetrometer (“Soil Test, ref. TL 700A”) have been used for measuring the strength of the soil material. The lower and upper instrument’s scale-limits were, respectively, 0.25 and 4.5 kgf/cm2, which are equivalent to
24.5 kPa and 441 kPa. In-field readings were taken by pressing the walls of all the 20 soil profiles at right angles, at constant depth-increments of 10 cm.
Soil-Water Tension via pF scale - the ability of the soils to retain water has been evaluated by determining the mathematical relationship between the soil-moisture that remains in the soil samples subjected to prescribed water-extracting suctions, expressed on the pF scale. The usual operational (agronomic) limits of pF are 1.8 (for saturation) and the 4.2, while the soil-moisture under pF 2.54 is currently related to the upper limit for plant water comfort at the “field capacity” (FC). The lower limit is for pF 4.2 at the “permanent plant wilting point” (WP). From lower to higher values, pF has been determined through the suction-method with silt under a “sand-bath”, the method of pressure-membranes and the method of pres‐ sure-plates. Results are referred to as the arithmetic means of n = 5 statistical elements.
Distribution of Soil Porosity – this determination followed the work of (Blume H., 1984), where it was established a quantitative relationship between the actual hydrated mean pore-diameter and the corresponding pF (retention force) value; the relationship is based on the Hagen equation that assumes the soil pores as having circular shape of variable dimension. For example, (Blume H., 1984), indicated ordered-pairs of the type (pF, ≤ pore-diameter) of (1.8, 50 μm), (2.5, 10 μm) and (4.2, 0.2 μm), which estimates the volume occupied by all pores giving a mean diameter less than the values indicated inside the parenthesis, as deter‐ mined in the laboratory, and enabling one to estimate its percentage relative to the total soil-volumetric porosity (θs = 1 − (BD/2.65)).
Aggregates Distribution and Soil Stability – For this task it was used the sieving method of Yoder (1936), at time, the one supported by the apparatus available in the laboratory. Apart from the existence of several modern methods that could be used for, this early one is relia‐ ble enough to generate confidence on the results obtained. The distribution of aggregates and their stability in a soil-ped are related to soil consistence.
3.6. Chemical analysis
Soil Organic Matter (SOM) - the (mass-based) SOM content had been determined by de‐ stroying each organic samples via the “humid-oxidation” method. The soil nitrogen (N) con‐ tent had been determined on air-dried samples using the Kjeldahl method. Based on this, the carbon/nitrogen (C/N) ratio had been calculated, since the relationship C = 0.574 SOM stands.
Cation-Exchange Capacity (CEC)– a solution of barium-chloride and trielanolamine, at pH of 8.2, was used that was combined with the spectro-photometry technique. Here CEC (meq[H+]/100g of oven-dried soil) represents the soil fertility and nutrient buffering effect of the soil. CEC is dependent on soil pH.
Phosphorus and Potassium (for plant nutrition) – both nutrients had been determined on air-dried soil samples via the Van der Paaw method.
Exchangeable Cations and Base Saturation – it was also analysed via spectro-photometry on lixiviates from soil samples previously saturated with barium. The contents of the four chemical cations, Ca2+, Mg2+, Na+ and K+, were determined as well; their total gives the sum
of bases (S). When expressed as a fraction of CEC, S is converted into the base-saturation degree (V).The CE is effectively determined by the colloidal (clay and humus) components of the soils.
Soil reaction or pH– The soil pH is a measure of the hydrogen ion (H+) concentration and it has
been determined in a 1:1 aqueous suspension of soil material. The apparatus used was a poten‐ tiometer. An aqueous solution that has a pH of 4.5 has 10-4.5 moles of hydrogen ions [H+] per li‐
ter of solution at the (standard) temperature of 25 ºC. Soil pH affects the availability of nutrients for plant nutrition and is, of course, an important chemical descriptor of soil fertility.
3.7. Vertical continuity of the soil porosity (the distribution of space in soils)
Aiming at identifying and evaluating the continuity of the soil porous phase (soil voids) net‐ work, it was used the relative frequency distribution of pores (Blume H., 1984) with the morpho-metric classification of bio-pores, soil cracks and irregular void space suggested in Sampaio E. and Sampaio J., 2010.
The method used consists of preparing a blue coloured plaster suspension in water (in one part of plaster per three parts of water in volume) which is brought to infiltrate into the soil profile from the ground surface. After the infiltration cessation and a given time-lag, enough to the strengthening of intruded material, horizontal slices of the soil material are removed from the profile in order to visualize the “filled voids” at depth that are counted and classi‐ fied by dimension classes and morphometric typology (Sampaio E. and Sampaio J., 2010). There are a lot of methods that use shaping substances to fill the soil voids through their infiltration into the soil. The plaster have been elected because i) it is a lesser degrading (more innocuous) material to the study-soil environment and ii) it gives results as good enough to be used in such evaluations (Bouma J., et al., 1982).
Following Schneider J. and Stunke A., 1991, we introduced the innovation of blue-colouring the prepared suspension in order to avoid confusing some soil constituents and an uncol‐ oured suspension.
Soil voids had been distinguished through: i) the presence of plaster or ii) plaster was absent (this was subdivided into “continuous” and “non-continuous”). Only the continuous voids had been counted because the difference between the total porosity and themselves can be used to evaluate the “non-continuous” voids without the need to perform individuals counting of the last type.
Three types of soil voids (bio-pores; cracks and irregular voids) were distinguished for class dimensions, as follows:
1. Bio-pores are all circular-shaped soil-voids that are mainly originated by the soil fauna or plant roots activities that, in turn, generate cylindrical-shaped channels in the soil matrix; generally these channels have a tortuous path –length oriented toward any di‐ rection in a soil volume unit, attain variable depths and are of paramount importance in establishing preferential soil-water drainage paths under saturation and may facilitate the soil colonization by plant roots. As a rule, the bio-pores are big enough to exert an important role on the soil-water retention function.
2. Cracks (often deep) are all elongated voids (lengths were at least twofold their own widths) that naturally result from the shrinking (under drying), alternating with the swelling (under soil hydration) processes where there was a high expansive, montmor‐ illonite clay content. Ultimately the cracks promote the infiltration of water into the soil only in the beginning of watering after a dry season or year.
3. Irregular voids, of a not well defined origin, are thought to result from soil compaction that may lead to the destruction of the last crack types previously describe. As their are
relatively ephemerals, the irregular voids cannot be considered as having relevant im‐ portance neither on the typical soil-water movement nor for roots colonization.
All these three void types, say bio-pores (P), cracks (F, from “fissure”) and irregular voids (Esp) are distinguished and quantified according to their dimensions into the light of their influence on water deep-drainage, soil-water balance and production of crops. The bio-pores dimension classes so defined were base on their diameters (Ø): large bio-bio-pores (PG): Ø >5 mm; medium bio-pores (PM): 1 < Ø <5 mm; small bio-pores (PP): 0.4 < Ø <1 mm; very small bio-pores (Pmp): 0.15 < Ø <0.4 mm and “minimal” bio-pores (Pm): 0,03 < Ø < 0,15 (cri‐ terion of[32]).
In the beginning, the classification of soil voids had been established based on their lengths by(Scneider J. and Stunke A., 1991) and the classes are: large cracks (FL), i.e., greater than 200 mm; medium cracks (FM), which are between 5 and 200 mm; short cracks (FC), that are lesser or equal to 5 mm. Subsequently, the dimension of each void class became classified based on width, as “large” (≥5 mm), “medium” (1 to 5 mm) and “narrow” (<1 mm). The ir‐ regular voids had been not classified into dimension classes; alternatively it has been record‐ ed the individual area that was summed out.
Despite it seems somewhat antiquate the (already described) method used to study the con‐ nectivity of voids through the soil porous media profiles, there are evidences that support modern alternative methods using the 3D approach do not describe well the reality, which opens the possibility to improve them (Weerts A., et al, 2001). The 3D modern methods al‐ ready referred to include, e.g., gaseous diffusion, computer-assisted axial tomography (CAT), Lattice-Boltzmann simulation models, fractal analysis.
From previously prepared horizontal surfaces (or planes) for the observation of the soil pro‐ file at depth, digital pictures from horizontal planes of the soil were taken in vertical se‐ quence at a constant 10 cm-depth increment down to the C-horizon. The digital pictures captured by the operator have a square plane representing a 50-cm width (the area is 2 500 cm2) quadrate; it can be distinguished on each quadrate the blue-coloured plaster in the im‐
pregnated voids. The first, uppermost picture of the (first) observation surface was taken from a plane at 1 to 2 cm of depth; the operator proceeds by digging the 10-cm depth incre‐ ments for more picture takings on different horizontal planes of the soil profile. In this meth‐ od pictures are only taken after homogenizing the actual soil-plane surface using a spatula, levelling and cleaning. This task ends at the depth where it is no more visible any blue mate‐ rial trait.
Each of these planes was photographed under the maximum magnificence of the camera used (a Nikon F90, with an objective lens of the type AF NIKKOR 35 to 135 mm). The se‐ quence of tasks just described were replicated three times for each of the four combinations (soil type x crop production system) used and under study to obtain a total of twelve photo-sequences.
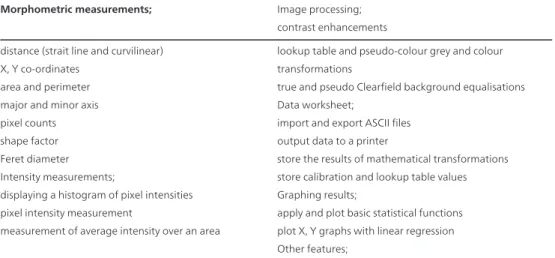
The soil-surface pictures then collected were subjected to an image analyser “Sigma ScanPro” and processed to allow the voids classification according to the outlined typology followed by counting the void classes. This software allows the development of works that comprises
Morphometric measurements; Image processing; contrast enhancements distance (strait line and curvilinear)
X, Y co-ordinates area and perimeter major and minor axis pixel counts shape factor Feret diameter Intensity measurements;
displaying a histogram of pixel intensities pixel intensity measurement
measurement of average intensity over an area
lookup table and pseudo-colour grey and colour transformations
true and pseudo Clearfield background equalisations Data worksheet;
import and export ASCII files output data to a printer
store the results of mathematical transformations store calibration and lookup table values Graphing results;
apply and plot basic statistical functions plot X, Y graphs with linear regression Other features;
Table 6. Insert table caption if needed
It’s noteworthy that this software automatically distinguishes and classifies the pores and cracks by their geometric properties. In order to do that it constructs a table through small built-in programs in its own computing sheet (Sampaio, E. and Sampaio, J., 2010).
3.8. Soil-water retention curves
As it is presented, the RC derives from converting the original pF – volumetric soil moisture (water), θ (m3 m-3), relationship, in which the pF scale is converted into the matric potential,
ψm in kPa (or J/kg). The mass fraction of soil coarser elements is useful in correcting the
available soil-water (ASW) calculated from texture only because of the scarcity of such kind of information, whose lacking overestimates the ASW.
3.9. Estimation of crop biomass production
The potential rate of the maximum net primary production (NPPp, in g(DM) m-2 day-1) is
estimated for local agro-ecosystems, as thought to be virtually independent on soil type, while plant types are distinguished through their biochemical C3 or C4 photosynthetic path‐
ways. Contrary to the solar radiation load, the soil water availability is considered here as the biophysical factor that effectively reduces NPPp to its (positive) actual rate to the condi‐ tion NPP ≤NPPp. Plant, or ecosystem, total dry matter (TDM) biomass production over time can be readily estimated from available information on NPP, say, the potential maximum TDM (or DMp), the normalized (transpired) water-use efficiency (NWUE), and the local at‐ mospheric air vapour pressure deficit (VPD).
Formally, this is the Tanner-Sinclair approach (Tanner, C. and Sinclair T. 1983) for which the linear relationship NWUE = WUE × VPD holds. Existing database (Jørgensen, U. and Kirsten S., 2001) shows that NWUE is quite conservative for a lot of plant groups having the same photosynthetic mechanisms, C3 or C4. Finally, the above-ground component of the total dry
mater for wheat is related to the corresponding grain-yield (Y) through the harvest index (HI) factor (section 3.2; White, E. and Wilson F., 2006), while 30% of TDM is allocated to the root system, as done in the CropSyst model (Stockle, C., 1996). Else, because plant dry mater production is directly proportional to the transpired water (TDM = WUE × WT), for healthy plants (Lima, J. 1996; Abreu, J. 1994; Monteith, J. 1993; Tanner, C. and Sinclair, T. 1983), the use of these data in a reverse-parameter modelling approach facilitates the crop water re‐ quirements (only WT, here) to be computed, without the imperative need to tackle the soil-water balance problem.
The transpired water during the (daily) time-step expresses the soil water uptake by plant roots integrated at depth, which can be used to truncate the effective rooting depth (Lima, J. et al. 2011). There also exists a linear relationship between the maximum effective rooting depth (Zrx in meter) and the maximum leaf-area index (LAIx: 3.0 to 6.3 m2 m-2): Zrx (m) =
0.2487LAIx + 0.2734 (n = 9; r2 = 0.842) (Stockle, C. and Nelson, R 1996). For an irrigated wheat
crop grown in a clayey, chromic vertisol soil in Lisbon, observed values of LAIx and Zrx reached 3.0 m2 m-2 and 0.80 m, respectively (Abreu, J. 1994).
The spatial and time resolution of the model is the square meter and the astronomic day (24 h), while the time-period of interest covers the entire growing season. The criterion for nu‐ merical convergence analysis is minimizing the difference between the calculated WT and the soil water holding capacity (WC) for the effective rooting depth.
The DMp is estimated for a winter-wheat (C3) crop in a clayey soil and local climatic condi‐
tions similar to that of Alvalade-do-Sado in the Alentejo, where a maize (Zea maysL.) crop has been intensively managed in a modern Fluvisol and is considered here as a reference high crop production system, neither short of water nor for mineral nutrition (Lima, J. 1996). For the maize as a C4 species, NWUEp = 10.3 kPa g kg-1 (Jørgensen, U. and Kirsten S., 2001); this figure
is, in turn, converted to the NWUEp for the wheat crop by dividing it by the empirical coeffi‐ cient 2.0 to scaling from the C4 to the C3 photosynthetic mechanism efficiency. This sets
NWUEp = 5.1 kPa g kg-1 for wheat which eventually can be adjusted for local VPD and water
shortage (e.g. lowering soil water holding capacity) under rain-fed production regime. In this exercise, a six-year (1996-2002) time period of climatic variables data for Évora (80 km distance northern Beja) is used as inputs. For this period, the mean range VPD = 0.88 ± 0.52 kPa were observed for air humidity, while the total evapotranspiration ET (WT + direct evaporation from the soil) for maize varied between 500 and of 600 mm per growing season, typically of 130 days (from 05 May to 13 September, 1995) (Lima, J., 1996). So, 550 mm is limiting the maximum water use of a cereal crop in the Mediterranean
4. Results
Results are sequentially presented as the soils profiles description; mass fractions of fine and coarse components; volumetric mass (bulk density) and the resistance to the penetrometer; hydric limits for consistency; aggregates´ stability; coefficient of aggregation; aggregates´
size; organic matter (SOM) content; elemental N (nitrogen) total; C/N ratio; cation-exchange capacity (CEC); exchangeable cations (EC); base saturation degree (V) pores connectivity and soil-water retention curve (RC).
4.1. Profiles description
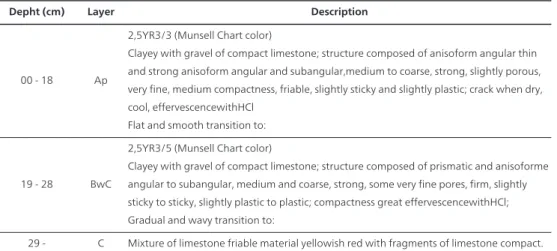
Depht (cm) Layer Description
00 - 18 Ap
2,5YR3/3 (Munsell Chart color)
Clayey with gravel of compact limestone; structure composed of anisoform angular thin and strong anisoform angular and subangular,medium to coarse, strong, slightly porous, very fine, medium compactness, friable, slightly sticky and slightly plastic; crack when dry, cool, effervescencewithHCl
Flat and smooth transition to:
19 - 28 BwC
2,5YR3/5 (Munsell Chart color)
Clayey with gravel of compact limestone; structure composed of prismatic and anisoforme angular to subangular, medium and coarse, strong, some very fine pores, firm, slightly sticky to sticky, slightly plastic to plastic; compactness great effervescencewithHCl; Gradual and wavy transition to:
29 - C Mixture of limestone friable material yellowish red with fragments of limestone compact. Table 7. VerticCambisol / Traditional System - Vc / TS =
Depth (cm) Layer Description
00 - 14 A
2,5YR3/4 (Munsell Chart color)
Clayey-loam with some quartz gravel and limestone, structure anisoform angular very fine to fine, strong, medium to fine anastomosing cracks, slightly porous, very fine, medium compactness, consistency very hard, sticky and plastic; many roots thin crack when dry, cool, zero effervescent with HCl.
Flat and smooth transition to:
15 - 21 BA
2,5YR3/4 (Munsell Chart color)
Similar as above, clayey withsome gravel ofquartz, schist and feldspar materials, structure anisoform angular to subangular, coarse to very coarse, strong. Flat and smooth transition to:
22 – 44 Bt
2,5YR4/5 (Munsell Chart color) with small gray dark reddish spots.
Clayey with gravel and some rubble of quartz, schist and feldspar materials; structure composed of prismatic and anisoformsubangular, medium and coarse, moderate to strong, some thin and medium vertical cracks, some very fine pores; consistency very firm, sticky to very sticky, plastic very plastic; great compactness, aggregate faces with film of clay and polished surfaces; additions of organic matter giving a clear stained. Gradual and wavy transition to:
Depth (cm) Layer Description
45 – 55 BCca
Lithological materials in an advanced state of decomposition with some clay (YR4 2.5/6 color) that makes strong effervescence with HCl.
Gradual and wavy transition to:
56 - Cca Limestone materials, hard quartzite, schist and sandstone materials. Table 8. Chromic Vertisol / Traditional System – Bvc / TS
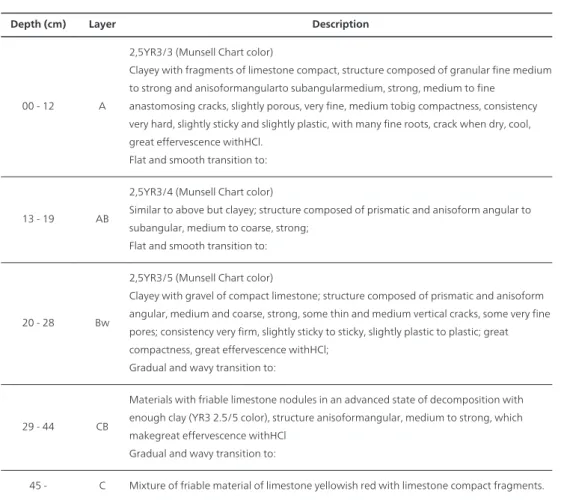
Depth (cm) Layer Description
00 - 12 A
2,5YR3/3 (Munsell Chart color)
Clayey with fragments of limestone compact, structure composed of granular fine medium to strong and anisoformangularto subangularmedium, strong, medium to fine
anastomosing cracks, slightly porous, very fine, medium tobig compactness, consistency very hard, slightly sticky and slightly plastic, with many fine roots, crack when dry, cool, great effervescence withHCl.
Flat and smooth transition to:
13 - 19 AB
2,5YR3/4 (Munsell Chart color)
Similar to above but clayey; structure composed of prismatic and anisoform angular to subangular, medium to coarse, strong;
Flat and smooth transition to:
20 - 28 Bw
2,5YR3/5 (Munsell Chart color)
Clayey with gravel of compact limestone; structure composed of prismatic and anisoform angular, medium and coarse, strong, some thin and medium vertical cracks, some very fine pores; consistency very firm, slightly sticky to sticky, slightly plastic to plastic; great compactness, great effervescence withHCl;
Gradual and wavy transition to:
29 - 44 CB
Materials with friable limestone nodules in an advanced state of decomposition with enough clay (YR3 2.5/5 color), structure anisoformangular, medium to strong, which makegreat effervescence withHCl
Gradual and wavy transition to:
45 - C Mixture of friable material of limestone yellowish red with limestone compact fragments. Table 9. VerticCambisol / Direct Seedalong 10 years – Vc /DS (10)
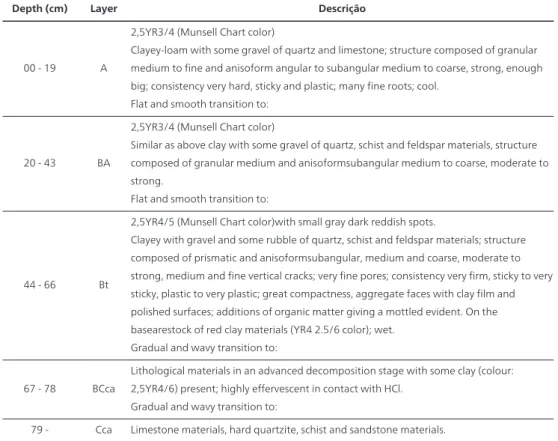
Depth (cm) Layer Descrição
00 - 19 A
2,5YR3/4 (Munsell Chart color)
Clayey-loam with some gravel of quartz and limestone; structure composed of granular medium to fine and anisoform angular to subangular medium to coarse, strong, enough big; consistency very hard, sticky and plastic; many fine roots; cool.
Flat and smooth transition to:
20 - 43 BA
2,5YR3/4 (Munsell Chart color)
Similar as above clay with some gravel of quartz, schist and feldspar materials, structure composed of granular medium and anisoformsubangular medium to coarse, moderate to strong.
Flat and smooth transition to:
44 - 66 Bt
2,5YR4/5 (Munsell Chart color)with small gray dark reddish spots.
Clayey with gravel and some rubble of quartz, schist and feldspar materials; structure composed of prismatic and anisoformsubangular, medium and coarse, moderate to strong, medium and fine vertical cracks; very fine pores; consistency very firm, sticky to very sticky, plastic to very plastic; great compactness, aggregate faces with clay film and polished surfaces; additions of organic matter giving a mottled evident. On the basearestock of red clay materials (YR4 2.5/6 color); wet.
Gradual and wavy transition to: 67 - 78 BCca
Lithological materials in an advanced decomposition stage with some clay (colour: 2,5YR4/6) present; highly effervescent in contact with HCl.
Gradual and wavy transition to:
79 - Cca Limestone materials, hard quartzite, schist and sandstone materials. Table 10. Chromic Vertisol / Direct Seed along 10 years
4.2. Physical and chemical properties of soils (their analytic integration)
Results are sequentially presented as the soils profiles description; mass fractions of fine and coarse components; volumetric mass (bulk density) and the resistance to the penetrometer; hydric limits for consistency; aggregates´ stability; coefficient of aggregation; aggregates´ size; organic matter (SOM) content; elemental N (nitrogen) total; C/N ratio; cation-exchange capacity (CEC); exchangeable cations (EC); base saturation degree (V) pores connectivity and soil-water retention curve (RC).
The measured and estimated physical and chemical parameters of the soils are summarized in Tables 2 to 7.
CEC is an effective chemical descriptor of the soil fertility and, in general, the higher the CEC the highest the fertility. It represents the maximum amount of cations a soil is capable of holding, at a given pH, available for exchanging with the soil solutions. It is expressed in units of milli-equivalent (meq [H+]) of hydrogen ion per 100 g of dry soil, which is equiva‐
lent, and numerically coincident to its S.I. units, the cmol per kg. A clayey soil has higher CEE than a sandy soil and CEC increases if the formation of humus is promoted.
Titration: is a method or the process of determining the strength of a solution or the concen‐ tration of a substance in solution in terms of the smallest amount of reagent of known con‐ centration required to bring about a given effect in reaction with a known volume of the test solution.
4.3. Pores connectivity: Vertical distribution of the soil pores type
In order to observe the vertical connectivity of the porous space (biopores, cracks and irreg‐ ular spaces) along the entire profile data were organized in each soil type and production system by depth layer. Like Graphics 1 to 4 which shows the results obtained for the bio‐ pores, others have been made for the cracks and irregular spaces but there results are only referred because they are published in (Sampaio E., 2009).
4.4. Soil-water retention curves
The soil-water retention curves (RC) are presented in Table 8. These RC are presented in or‐ der to highlight the interactions between soil types, on one hand, and the land-use systems,
on the other hand. For each of the three pF values, the volumetric soil-water content θ (m3
m-3) has been determined at four our six soil-layers depth. Once the variations of θ was low,
only mean values are presented per each ψm value of the RC curves.
4.5. Estimation of crop biomass production
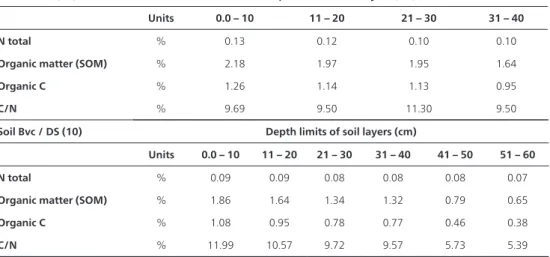
At this point the fertility of both (Bvc and Vc) soil types has been characterized through quantitative physical and chemical analysis. However the potential maximum total crop dry matter (DMp) production under rain-fed condition is generally limited in this sort of soils by frequent intra- and inter-annual soil-water (ASW) shortage and chronic low organic mater (SOM) content (Kassam et al., 2012; Zdruli, P. et al., 2004), thus low available elemental ni‐ trogen (N) for plant nutrition and low C/N ratio for soil microbes´ activity.
Now, consider a winter-wheat cultivar that yields 3 000 kg per ha and year in average, un‐ der the TS, intensive rain-fed production system (Barros, et al., 2004). According to the pro‐ cedure and parameters described in section 3.9, the corresponding TDM would be 7 800 kg ha-1 per year. But for the available soil-water holding capacity (WC) the effective rooting
depth is Zr = 60 cm, for the “Soil Bvc/DS(10)” in Table 5, with increased soil depth after ten years under DS treatment. Dividing TDM by the adjusted WUE = 6.44 g kg-1 and setting
ASW = 0.2 m3 m-3, the amount of total transpired water, so returned, is WT = 121 mm to jus‐
tify that dry mater production, imposed under VPD = 0.8 kPa. This result is just for balanc‐ ing the calculated rooting depth (Zr = 60.6 cm) to the observed effective mean soil depth (as above), setting the numerical convergence relative error to −0.97%, essentially zero. For the same soil, but under TS treatment foe which Zr = 40 cm, the calculated WT is only 80 mm. The expected Zrx that conforms the wheat’s LAIx is 1.01 m, thus a water deficit of 45% is esti‐ mated for the growing season. The practical effect of this is a potential biomass deficit of wheat crop under rain-fed Mediterranean. Note that total demand for water by crops are compared to the net water input into the agro-ecosystem, as calculated through a water balance model
(Thornthewaite), in which rooting depth is a key parameter. For the historical climatic period of 1951-1980, for example, the estimated annual total of actual evapotranspiration is ETR = 450 mm. This means that WT just calculated for wheat production under DS(10) and Zr = 60 cm represents the fraction of 0.27 ETR versus 0.18ETR for TS and Zr = 40 cm.
5. Discussion
The soil profiles in both soils subjected to the DS system have evolved pedogenetically, i.e., horizons differentiation, and also have augmented their maximum depth and, thus, the po‐ tential rooting depth and water-holding capacity.
Soil texture is analysed in comparing both soil types and the effects of both (DS an TS) pro‐ duction systems on each one. The profiles were very similar in texture but when subjected to the DS system for 10 years the more surfacial horizons in the Bvc soil became coarser than previously, meaning a relative loss of finer elements; the Vc soil maintained its texture unal‐ tered. In this soil, the coarse fraction is more important than in Bvc, ranging between 9% at the upper soil-layer and 46% at 40-cm depth in the former.
In the Vc soil, the vertical distribution of bulk density (BD) showed a relative decrease dur‐ ing the 10-year period under DS system which is attributed here to a less compaction situa‐ tion than in the ploughed field under TS. Although the increase of BD with depth is natural, under DS it revealed an almost constant distribution. This can be attributed, among other factors, to a more intensive biological activity such as plant root colonization and/or soil fau‐ na activity that promotes water infiltration. In the Bvc the vertical distribution of BD main‐ tained its natural behaviour but at lower values under DS than under TS. Once again, this effect reflects the augmentation of the porosity, or a corresponding decrease in soil compac‐ tion under DS. The same applies to the soil resistance (to the penetrometer) but these effects are amplified.
The hydric limits for the workability of both soil types increased and stabilized at depth during the 10-year period under DS.
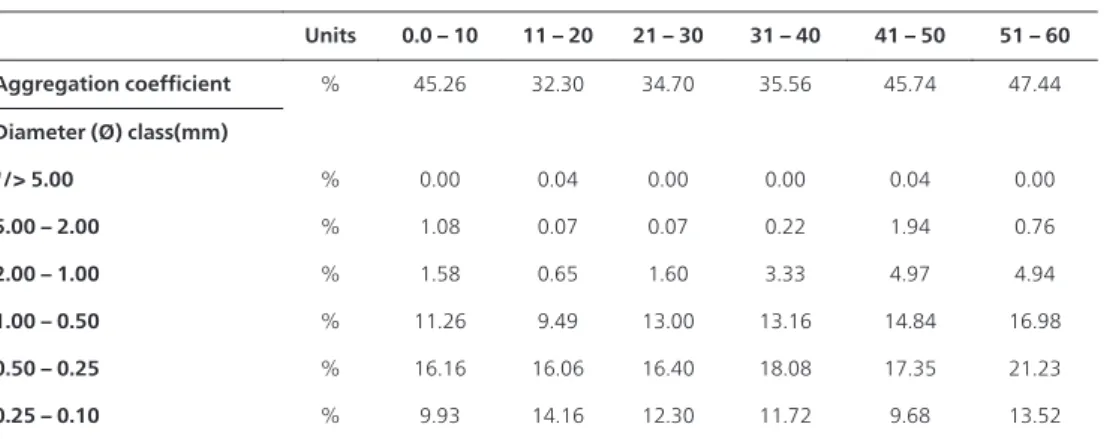
This parameter is indirectly accessed via the combination of the aggregation coefficient (AC) and size distribution of aggregates. Thus, both soils´ AC showed an effective increase under DS ranging between 23% and 48% in the upper soil-layer and from 36% to 44% at 40-cm depth, for the Vc soil. In turn, the corresponding ranges for the Bvc soil are 27%-45% and 29%-36%, respectively. These figures sustain the experimental evidence that the DS produc‐ tion system is a more conservative agricultural technique in respect to this physical soil fer‐ tility descriptor than the ploughed TS is.
The size distribution of the aggregates is embodied in the evaluation of the stability of the aggregates´ parameters. For both Vc an Bvc soils, total percentage of aggregates increased a lot under DS while under TS the soil matric is signifficatively less aggregated, what degener‐ ates a loose soil, so more susceptibility to erosion process for the same land cover. The size
classes of aggregates that have been increased under DS are the media (1 – 0.25 mm in diam‐ eter) (Table 5); the two soils did not show signifficative difference in this parameter.
Soil Vc / TS Depth limits of soil layers (cm)
Units 0.0 – 10 11 – 20 21 – 30 31 – 40 Aggregation coefficient % 23.40 23.54 38.78 36.50 Diameter (Ø) class (mm) "/> 5.00 % 0.07 0.56 0.00 3.00 5.00 – 2.00 % 0.67 1.38 2.03 3.35 2.00 – 1.00 % 1.24 0.71 7.18 3.39 1.00 – 0.50 % 5.29 3.50 14.53 4.93 0.50 – 0.25 % 13.00 12.32 14.85 15.23 0.25 – 0.10 % 12.54 12.57 12.44 9.19
Soil Bvc / TS Depth limits of soil layers (cm)
Units 0.0 – 10 11 – 20 21 – 30 31 – 40 Aggregation coefficient % 27.12 27.35 28.16 28.80 Diameter (Ø) class (mm) "/> 5.00 % 0.20 0.00 0.57 0.67 5.00 – 2.00 % 0.60 0.94 2.27 1.50 2.00 – 1.00 % 1.29 1.83 1.40 2.57 1.00 – 0.50 % 8.90 9.24 8.65 8.75 0.50 – 0.25 % 9.51 9.85 10.67 10.80 0.25 – 0.10 % 13.10 14.15 13.71 13.81
Soil Vc / DS (10) Depth limits of soil layers (cm)
Units 0.0 – 10 11 – 20 21 – 30 31 – 40 Aggregation coefficient % 47.76 60.80 61.08 43.54 Diameter (Ø) class (mm) "/> 5.00 % 0.11 0.39 0.07 0.04 5.00 – 2.00 % 0.29 7.29 6.93 1.85 2.00 – 1.00 % 2.64 14.79 15.55 3.52 1.00 – 0.50 % 15.79 18.96 16.72 17.58 0.50 – 0.25 % 18.47 9.57 11.28 15.84 0.25 – 0.10 % 12.92 5.75 6.90 12.47
Soil Bvc / DS (10) Depth limits of soil layers (cm) Units 0.0 – 10 11 – 20 21 – 30 31 – 40 41 – 50 51 – 60 Aggregation coefficient % 45.26 32.30 34.70 35.56 45.74 47.44 Diameter (Ø) class(mm) "/> 5.00 % 0.00 0.04 0.00 0.00 0.04 0.00 5.00 – 2.00 % 1.08 0.07 0.07 0.22 1.94 0.76 2.00 – 1.00 % 1.58 0.65 1.60 3.33 4.97 4.94 1.00 – 0.50 % 11.26 9.49 13.00 13.16 14.84 16.98 0.50 – 0.25 % 16.16 16.06 16.40 18.08 17.35 21.23 0.25 – 0.10 % 9.93 14.16 12.30 11.72 9.68 13.52
Table 11. Aggregate stability, coefficient of aggregation and aggregates size
It is seen from Table 6 that the SOM content in both soils has increased along the entire pro‐ files, after having been submitted to the conservative (DS) production system, as an ade‐ quate alternative system to the TS one; this augmentation is more evident in the upper 30-40-cm layer. This result is expected since the stubble in the field determines less soil-surface heating (relative to bare soil), stabilizes the soil temperature regime over time and conserves water as direct evaporation is diminished (Gill, S. and Jalota, S., 1996). These are conditions that lead the plant residues left on the soil surface to have more opportunity un‐ der humification rather than under mineralization. Ultimately the SOM residence time in the soil augments (Zdruli, P. et al. 2004).
Soil Vc / TS Depth limits of soil layers (cm)
Parameters Units 0.0 – 10 11 – 20 21 – 30 31 – 40
N total % 0.18 0.11 0.10 0.09
Organic matter (SOM) % 1.90 1.60 1.32 1.02
Organic C % 1.10 0.93 0.77 0.59
C/N % 6.12 8.44 7.66 6.57
Soil Bvc / TS Depth limits of soil layers (cm)
Units 0.0 – 10 11 – 20 21 – 30 31 – 40
N total % 0.08 0.07 0.07 0.06
Organic matter (SOM) % 1.32 1.24 1.18 1.05
Organic C % 0.77 0.72 0.68 0.61