COMPASS
CERN-EP-2016–xxx October 4, 2017
Longitudinal double-spin asymmetry A
p1and spin-dependent structure function g
p1of the proton
at small values of x and Q
2The COMPASS Collaboration
Abstract
We present a precise measurement of the proton longitudinal double-spin asymmetry Ap1 and the proton spin-dependent structure function gp1at photon virtualities 0.006 (GeV/c)2< Q2< 1 (GeV/c)2 in the Bjorken x range of 4 × 10⁻⁵< x < 4 × 10⁻². The results are based on data collected by the COMPASS Collaboration at CERN using muon beam energies of 160 GeV and 200 GeV. The statistical precision is more than tenfold better than that of the previous measurement in this region. In the whole range of x, the measured values of Ap1and gp1are found to be positive. It is for the first time that spin effects are found at such low values of x.
Keywords: inelastic muon scattering, spin, structure function, A1, g1, low x, low Q2.
(to be submitted to Phys. Lett. B)
The COMPASS Collaboration
M. Aghasyan24, M.G. Alexeev25, G.D. Alexeev7, A. Amoroso25,26, V. Andrieux28,20, N.V. Anfimov7, V. Anosov7, A. Antoshkin7, K. Augsten7,18, W. Augustyniak29, A. Austregesilo15, C.D.R. Azevedo1, B. Badełek30, F. Balestra25,26, M. Ball3, J. Barth4, R. Beck3, Y. Bedfer20, J. Bernhard12,9, K. Bicker15,9, E. R. Bielert9, R. Birsa24, M. Bodlak17, P. Bordalo11,a, F. Bradamante23,24, A. Bressan23,24,
M. B¨uchele8, V.E. Burtsev27, W.-C. Chang21, C. Chatterjee6, M. Chiosso25,26, I. Choi28,
A.G. Chumakov27, S.-U. Chung15,b, A. Cicuttin24,c, M.L. Crespo24,c, S. Dalla Torre24, S.S. Dasgupta6, S. Dasgupta23,24, O.Yu. Denisov26, L. Dhara6, S.V. Donskov19, N. Doshita32, Ch. Dreisbach15,
W. D¨unnweberd, R.R. Dusaev27, M. Dziewiecki31, A. Efremov7,u, P.D. Eversheim3, M. Faesslerd, A. Ferrero20, M. Finger17, M. Finger jr.17, H. Fischer8, C. Franco11, N. du Fresne von Hohenesche12,9, J.M. Friedrich15, V. Frolov7,9, E. Fuchey20,e, F. Gautheron2, O.P. Gavrichtchouk7, S. Gerassimov14,15, J. Giarra12, F. Giordano28, I. Gnesi25,26, M. Gorzellik8,p, A. Grasso25,26, A. Gridin7, M. Grosse Perdekamp28, B. Grube15, T. Grussenmeyer8, A. Guskov7, D. Hahne4, G. Hamar24, D. von Harrach12, F.H. Heinsius8, R. Heitz28, F. Herrmann8, N. Horikawa16,f, N. d’Hose20, C.-Y. Hsieh21,g, S. Huber15, S. Ishimoto32,h, A. Ivanov25,26, T. Iwata32, V. Jary18, R. Joosten3, P. J¨org8, E. Kabuß12, A. Kerbizi23,24, B. Ketzer3,G.V. Khaustov19, Yu.A. Khokhlov19,i, Yu. Kisselev7, F. Klein4, J.H. Koivuniemi2,28, V.N. Kolosov19, K. Kondo32, K. K¨onigsmann8, I. Konorov14,15, V.F. Konstantinov19,
A.M. Kotzinian26,k, O.M. Kouznetsov7, Z. Kral18, M. Kr¨amer15, P. Kremser8, F. Krinner15, Z.V. Kroumchtein7,*, Y. Kulinich28, F. Kunne20, K. Kurek29, R.P. Kurjata31, I.I. Kuznetsov27, A. Kveton18, A.A. Lednev19,*, E.A. Levchenko27, M. Levillain20, S. Levorato24, Y.-S. Lian21,l, J. Lichtenstadt22, R. Longo25,26, V.E. Lyubovitskij27,m, A. Maggiora26, A. Magnon28, N. Makins28, N. Makke24,c, G.K. Mallot9, S.A. Mamon27, B. Marianski29, A. Martin23,24, J. Marzec31,
J. Matouˇsek23,24,17, H. Matsuda32, T. Matsuda13, G.V. Meshcheryakov7, M. Meyer28,20, W. Meyer2, Yu.V. Mikhailov19, M. Mikhasenko3, E. Mitrofanov7, N. Mitrofanov7, Y. Miyachi32, A. Moretti23,24, A. Nagaytsev7, F. Nerling12, D. Neyret20, J. Nov´y18,9, W.-D. Nowak12, G. Nukazuka32, A.S. Nunes11,#,
A.G. Olshevsky7, I. Orlov7, M. Ostrick12, D. Panzieri26,n, B. Parsamyan25,26, S. Paul15, J.-C. Peng28, F. Pereira1, M. Peˇsek17, M. Peˇskov´a17, D.V. Peshekhonov7, N. Pierre12,20, S. Platchkov20,
J. Pochodzalla12, V.A. Polyakov19, J. Pretz4,j, M. Quaresma11, C. Quintans11, S. Ramos11,a, C. Regali8,
G. Reicherz2, C. Riedl28, N.S. Rogacheva7, D.I. Ryabchikov19,15, A. Rybnikov7, A. Rychter31, R. Salac18, V.D. Samoylenko19, A. Sandacz29, C. Santos24, S. Sarkar6, I.A. Savin7,u, T. Sawada21, G. Sbrizzai23,24, P. Schiavon23,24, K. Schmidt8,p, H. Schmieden4, K. Sch¨onning9,o, E. Seder20, A. Selyunin7, L. Silva11, L. Sinha6, S. Sirtl8, M. Slunecka7, J. Smolik7, A. Srnka5, D. Steffen9,15, M. Stolarski11, O. Subrt9,18, M. Sulc10, H. Suzuki32,f, A. Szabelski23,24,29T. Szameitat8,p, P. Sznajder29, M. Tasevsky7, S. Tessaro24, F. Tessarotto24, A. Thiel3, J. Tomsa17, F. Tosello26, V. Tskhay14, S. Uhl15, B.I. Vasilishin27, A. Vauth9, J. Veloso1, A. Vidon20, M. Virius18, S. Wallner15, T. Weisrock12,
M. Wilfert12, J. ter Wolbeek8,p, K. Zaremba31, P. Zavada7, M. Zavertyaev14, E. Zemlyanichkina7,u, M. Ziembicki31
1University of Aveiro, Dept. of Physics, 3810-193 Aveiro, Portugal
2Universit¨at Bochum, Institut f¨ur Experimentalphysik, 44780 Bochum, Germanyq,r
3Universit¨at Bonn, Helmholtz-Institut f¨ur Strahlen- und Kernphysik, 53115 Bonn, Germanyq 4Universit¨at Bonn, Physikalisches Institut, 53115 Bonn, Germanyq
5Institute of Scientific Instruments, AS CR, 61264 Brno, Czech Republics
6Matrivani Institute of Experimental Research & Education, Calcutta-700 030, Indiat 7Joint Institute for Nuclear Research, 141980 Dubna, Moscow region, Russiau 8Universit¨at Freiburg, Physikalisches Institut, 79104 Freiburg, Germanyq,r 9CERN, 1211 Geneva 23, Switzerland
10Technical University in Liberec, 46117 Liberec, Czech Republics 11LIP, 1000-149 Lisbon, Portugalv
14Lebedev Physical Institute, 119991 Moscow, Russia
15Technische Universit¨at M¨unchen, Physik Dept., 85748 Garching, Germanyq,d 16Nagoya University, 464 Nagoya, Japanw
17Charles University in Prague, Faculty of Mathematics and Physics, 18000 Prague, Czech Republics 18Czech Technical University in Prague, 16636 Prague, Czech Republics
19State Scientific Center Institute for High Energy Physics of National Research Center ‘Kurchatov
Institute’, 142281 Protvino, Russia
20IRFU, CEA, Universit´e Paris-Saclay, 91191 Gif-sur-Yvette, Francer 21Academia Sinica, Institute of Physics, Taipei 11529, Taiwanx
22Tel Aviv University, School of Physics and Astronomy, 69978 Tel Aviv, Israely 23University of Trieste, Dept. of Physics, 34127 Trieste, Italy
24Trieste Section of INFN, 34127 Trieste, Italy
25University of Turin, Dept. of Physics, 10125 Turin, Italy 26Torino Section of INFN, 10125 Turin, Italy
27Tomsk Polytechnic University,634050 Tomsk, Russiaz
28University of Illinois at Urbana-Champaign, Dept. of Physics, Urbana, IL 61801-3080, USAaa 29National Centre for Nuclear Research, 00-681 Warsaw, Polandab
30University of Warsaw, Faculty of Physics, 02-093 Warsaw, Polandab
31Warsaw University of Technology, Institute of Radioelectronics, 00-665 Warsaw, Polandab 32Yamagata University, Yamagata 992-8510, Japanw
#Corresponding authors *Deceased
aAlso at Instituto Superior T´ecnico, Universidade de Lisboa, Lisbon, Portugal
bAlso at Dept. of Physics, Pusan National University, Busan 609-735, Republic of Korea and at
Physics Dept., Brookhaven National Laboratory, Upton, NY 11973, USA
cAlso at Abdus Salam ICTP, 34151 Trieste, Italy
dSupported by the DFG cluster of excellence ‘Origin and Structure of the Universe’
(www.universe-cluster.de) (Germany)
eSupported by the Laboratoire d’excellence P2IO (France) fAlso at Chubu University, Kasugai, Aichi 487-8501, Japanw
gAlso at Dept. of Physics, National Central University, 300 Jhongda Road, Jhongli 32001, Taiwan hAlso at KEK, 1-1 Oho, Tsukuba, Ibaraki 305-0801, Japan
iAlso at Moscow Institute of Physics and Technology, Moscow Region, 141700, Russia
jPresent address: RWTH Aachen University, III. Physikalisches Institut, 52056 Aachen, Germany kAlso at Yerevan Physics Institute, Alikhanian Br. Street, Yerevan, Armenia, 0036
lAlso at Dept. of Physics, National Kaohsiung Normal University, Kaohsiung County 824, Taiwan mAlso at Institut f¨ur Theoretische Physik, Universit¨at T¨ubingen, 72076 T¨ubingen, Germany
nAlso at University of Eastern Piedmont, 15100 Alessandria, Italy oPresent address: Uppsala University, Box 516, 75120 Uppsala, Sweden
pSupported by the DFG Research Training Group Programmes 1102 and 2044 (Germany) qSupported by BMBF - Bundesministerium f¨ur Bildung und Forschung (Germany)
rSupported by FP7, HadronPhysics3, Grant 283286 (European Union) sSupported by MEYS, Grant LG13031 (Czech Republic)
tSupported by SAIL (CSR) and B.Sen fund (India) uSupported by CERN-RFBR Grant 12-02-91500
vSupported by FCT - Fundac¸˜ao para a Ciˆencia e Tecnologia, COMPETE and QREN, Grants CERN/FP
wSupported by MEXT and JSPS, Grants 18002006, 20540299, 18540281 and 26247032, the Daiko
and Yamada Foundations (Japan)
xSupported by the Ministry of Science and Technology (Taiwan) ySupported by the Israel Academy of Sciences and Humanities (Israel)
zSupported by the Russian Federation program “Nauka” (Contract No. 0.1764.GZB.2017) (Russia) aaSupported by the National Science Foundation, Grant no. PHY-1506416 (USA)
1 Introduction
The spin-dependent structure function of the proton, gp1, has been extensively studied in the last few decades. Precise measurements of gp1(x, Q2) were realised in the deep inelastic regime of charged lepton nucleon scattering at photon virtualities Q2> 1 (GeV/c)2[1, 2] over a wide range of the Bjorken scaling
variable x. On the contrary, the behaviour of gp1at lower Q2is largely unknown. For fixed-target experi-ments, the values of Q2<∼ 1 (GeV/c)2imply small values of x. This low-Q2region is governed by ‘soft’ processes and the transition to the region of higher Q2is still not understood.
Quantum Chromodynamics (QCD) allows for a description of ‘hard’ interactions using a perturbative expansion that is known to be applicable for Q2values as low as about 1 (GeV/c)2. For lower values of Q2, soft interactions become relevant and ‘non-perturbative’ mechanisms dominate the reaction dynam-ics. In order to provide a suitable description of the non-perturbative region and also of the transition region between ‘soft’ and ‘hard’ physics, it is tried in phenomenological calculations to extrapolate ideas based on the parton model to the low-Q2 region and add mechanisms like (generalised) vector meson dominance, (G)VMD, supplemented by the Regge model (see Refs. [3–6]). New and precise data on gp1(x, Q2) in the low-Q2region are hence essential to improve and validate such calculations.
Measurements at low x and low Q2 are scarce as they put very high demands on event triggering and reconstruction. In spin-dependent leptoproduction they were performed only by the Spin Muon Col-laboration (SMC) using proton and deuteron targets [7] and by the COMPASS ColCol-laboration using a deuteron target [8]. The latter, very precise results do not reveal any spin effects in gd1over the whole measured interval of x. In this Letter, we present new results obtained on the longitudinal double-spin asymmetry Ap1 and the spin-dependent structure function gp1 for the proton, in the kinematic region 0.0062 (GeV/c)2< Q2< 1 (GeV/c)2 and 4 × 10⁻⁵< x < 4 × 10⁻². The data are analysed in four
2-dimensional grids of kinematic variables, i.e. (x, Q2), (ν, Q2), (x, ν) and (Q2, x), where ν denotes the virtual-photon energy in the target rest frame. Note that the last grid differs from the first one in the number of bins chosen per variable. The lower limit in x coincides with that used in the COMPASS low-Q2 deuteron analysis [8]. The low-Q2 results presented in this Letter complement our published proton measurements covering the high-Q2region [2, 9].
This Letter is organised as follows. We briefly describe the experimental set-up in Sec. 2, the event selection in Sec. 3 and the method of asymmetry calculation in Sec. 4. The results are presented in Sec. 5 and the summary is given in Sec. 6.
2 2 EXPERIMENTAL SET-UP
2 Experimental set-up
The measurements were performed using the COMPASS fixed-target set-up and positively charged muons provided by the M2 beam line of the CERN SPS. In 2007, the beam had a momentum of 160 GeV/c with 5 × 10⁷ µ+/s in 4.8 s long spills every 16.8 s and in 2011 a momentum of 200 GeV/c with 107µ+/s in 10 s long spills every 40 s. The beam had a momentum spread of 5%. It was naturally polarised with a polarisation Pbof about −0.8, which is known with a precision of 5%. Momentum and
trajectory of each incident muon were measured before the target by scintillator hodoscopes, scintillating fibre and silicon microstrip detectors.
A large solid-state target of ammonia (NH3) inside a large-aperture superconducting solenoid provided
longitudinally polarised protons. The proton polarisation was achieved by dynamic nuclear polarisation and reached an average value of |Pt|≈0.85. The dilution factor f , which accounts for the presence of
unpolarisable material in the target, is about 0.16 for ammonia. The target material was contained in three cylindrical cells of 4 cm diameter with 30 cm, 60 cm and 30 cm length, which were separated by 5 cm gaps and located along the beam one after the other. Neighbouring cells were polarised in opposite directions in order to use both target polarisations simultaneously during data taking. The polarisation directions were inverted on a regular basis by rotating the direction of the target magnetic field, thus com-pensating for acceptance differences between different cells and thereby minimising possible systematic effects. Once per year the direction of the polarisation with respect to the solenoid field was reverted by repolarisation in opposite direction keeping the solenoid field unchanged. Ten NMR coils surrounding the target material allowed for a measurement of Ptwith a precision of 2% in 2007 and 3.5% in 2011.
Momentum and angle of scattered muons and other produced particles were measured in a two-stage open forward spectrometer with large angle and momentum acceptance using two dipole magnets with tracking detectors upstream and downstream of the magnets. Scintillating fibre and micropattern gaseous detectors were employed in and close to the beam region, while multiwire proportional chambers, drift chambers and straw tube detectors covered the outer areas.
Scattered muons were identified by drift tube planes behind iron and concrete absorbers in both first and second stage of the spectrometer. Particle identification is not used in the current analysis. Two different types of triggers were employed. “Inclusive” triggers were based on coincidences of hodoscope signals produced by scattered muons. “Semi-inclusive” triggers required an energy deposit in one of the calorimeters with an optional coincidence with an inclusive trigger. The reader is referred to Ref. [10] for the detailed description of the muon beam, the three-cell polarised NH3 target and the COMPASS
3 Event selection
Events selected for the analysis are required to have a reconstructed incoming muon, a scattered muon and an interaction vertex. As scattering angles in the laboratory frame are very small for low-Q2events, at least one additional track attached to the vertex is required to improve the vertex resolution in beam direction. For the 2007 data, incoming muon momenta are required to range between 140 GeV/c and 160 GeV/c, and for the 2011 data between 185 GeV/c and 215 GeV/c. In order to equalise the beam flux through all target cells, the extrapolated track of the incoming muon is required to pass through all target cells. Interactions originating from the unpolarised material surrounding the target are rejected by imposing appropriate constraints on the position of the interaction vertex. The scattered muon is identified by requiring that it has passed more than 15 radiation lengths of material and it has to point back to the hodoscope that triggered the event. Kinematic constraints are applied on the photon virtuality, Q2< 1 (GeV/c)2, and on the Bjorken scaling variable, x > 4 × 10⁻⁵, as it was done in the analysis of the COMPASS deuteron data [8]. The latter constraint is used to avoid the region where x cannot be determined with sufficient accuracy. In addition, the fraction of the energy lost by the incoming muon has to fulfill the condition 0.1 < y < 0.9, where the lower limit removes badly reconstructed events and the upper limit removes events with large radiative corrections as well as low-momentum muons resulting from pion decay-in-flight. These kinematic constraints lead to a minimum value of about 5 GeV/c2for W, where W is the invariant mass of the γ∗psystem of virtual photon and proton.
For a given primary interaction vertex with incident and scattered muon, we require at least one additional (hadron candidate) track that has to carry a fraction z of the virtual photon energy with 0.1 < z < 1 and a momentum p < 140 GeV/c (2007) or p < 180 GeV/c (2011). Here, the condition on z rejects poorly reconstructed tracks and the condition on p removes beam halo muons. This “hadron method” [11] does not only improve the resolution of the primary interaction vertex but also allows the reduction of radiative background.
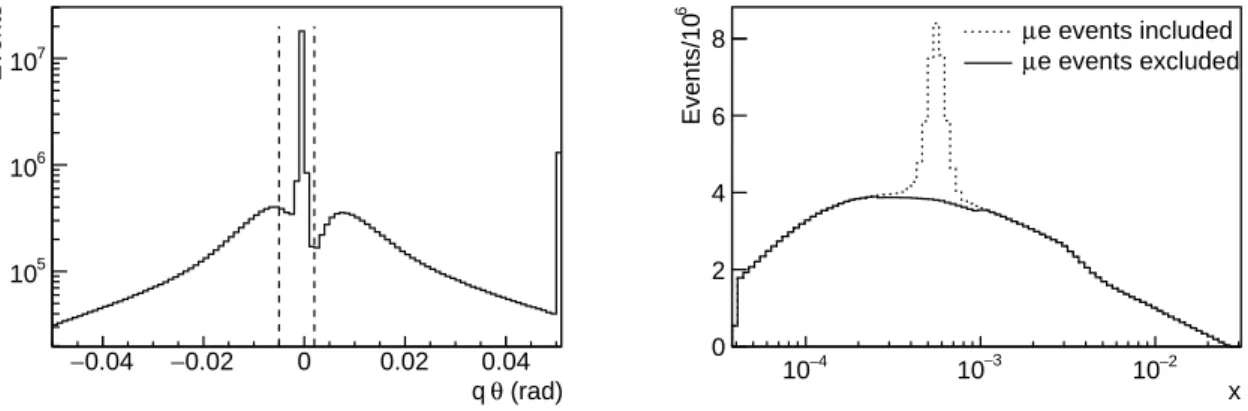
At the very low values of x studied in this analysis, there exists a contamination by events that originate from elastic scattering of muons off atomic electrons of the target material. These events show up in the x distribution as a prominent peak around the value xµ e= melectron/M = 5.45 × 10⁻⁴, where M is the proton
mass. We remove this contamination by imposing a constraint on the product qθ , where q = +1 (−1) is used if a particle of positive (negative) charge is associated to the track and θ is the angle between the hadron candidate track and the virtual-photon direction. In the range −3.6 < log10(x) < −3.0, events with one hadron candidate are rejected if −0.005 rad < qθ < 0.002 rad and events with two hadron candidates if −0.001 rad < qθ < 0 rad. For the former case and either hadron charge, the distribution of the product qθ is presented in Fig. 1 (left). In Fig. 1 (right), the x distributions of accepted events are shown without and with the constraint on qθ .
After having applied all selection criteria, 447 million events taken with a beam energy of 160 GeV and 229 million taken with 200 GeV remain for analysis.
4 3 EVENT SELECTION (rad) θ q 0.04 − −0.02 0 0.02 0.04 Events 5 10 6 10 7 10 x 4 − 10 10−3 10−2 6 Events/10 0 2 4 6 8 µe events included e events excluded µ
Figure 1: 200 GeV data. Left: Distribution of the variable qθ for events with one (positively or negatively charged) additional track outgoing from the primary interaction vertex. Events between vertical lines are removed from further analysis. Note the logarithmic scale on the vertical axis. Right: x distribution of accepted events without and with µe event rejection.
4 Asymmetry extraction
The longitudinal double-spin lepton-proton cross-section asymmetry is given by
ApLL=σ → ⇐− σ⇒→ σ → ⇐+ σ⇒→ = D(A p 1+ ηA p 2), (1)
where the arrows refer to the longitudinal spin orientations of incoming muon (→) and target proton (⇒). It can be decomposed into a longitudinal photon-nucleon asymmetry Ap1and a transverse photon-nucleon asymmetry Ap2, where the longitudinal asymmetry is defined in terms of the γ∗p cross sections as
Ap1=σ1/2− σ3/2
σ1/2+ σ3/2. (2)
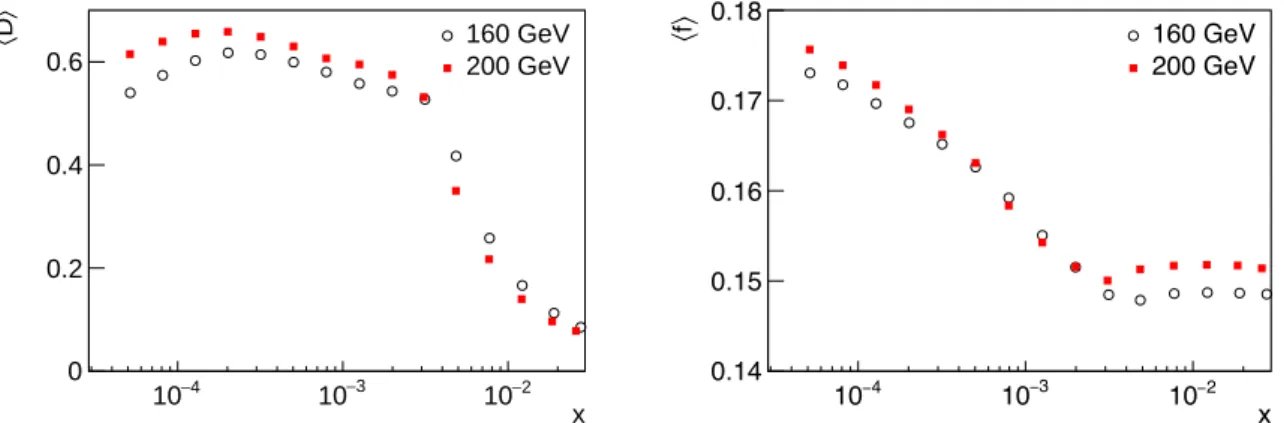
Here, the subscript refers to the total angular momentum of the γ∗p system. The factor D in Eq. (1) is the so-called depolarisation factor and η is a kinematic factor. Full expressions for D and η are given in Ref. [8]; the behaviour of D in the kinematic region of this analysis is shown in Fig. 2 (left). In the COMPASS kinematic range, the factor η is negligible, hence the term containing the transverse asymmetry Ap2is of negligible size and its possible contribution is included in the systematic uncertainty of Ap1.
The number of events originating from a given target cell with a given direction of the target polarisation can be expressed as
Ni= aiφiniσ (1 + P¯ bPtf DAp1), i = o1, c1, o2, c2. (3)
Here, aiis the acceptance, φithe beam flux, nithe number of target nuclei, ¯σ the spin-independent cross section and f the dilution factor. The four equations of Eq. (3) denoted by the subscript i are giving the numbers of events that originate from either the combined outer cells (o) or the central cell (c), each for the two directions of the solenoid field (1 or 2). They are combined into a second-order equation in Ap1 for the ratio (No1Nc2)/(No2Nc1), where the product aiφiniσ cancels provided that the ratio of acceptances¯
of the central cell c and the outer cells o is the same before and after field reversal. In order to minimise the statistical uncertainty of the asymmetry, the events are weighted by a factor w = Pbf D. The target
polarisation is not included in the weight because it is not constant over time and would hence generate false asymmetries. x 4 − 10 10−3 10−2 〉 D 〈 0 0.2 0.4 0.6 160 GeV 200 GeV x 4 − 10 10−3 10−2 〉f 〈 0.14 0.15 0.16 0.17 0.18 160 GeV 200 GeV
Figure 2:Mean depolarisation factor (left) and mean dilution factor (right) as a function of x.
The dilution factor f includes a correction factor ρ = σ1γp/σtotp [12] that accounts for radiative events originating from unpolarised target protons. This effective dilution factor depends only weakly on the in-cident energy, decreases with x and reaches a value of about 0.17 at x ∼ 10−4and about 0.15 at x ∼ 10−2. Its relative uncertainty amounts to 5%. The x dependence of the average dilution factor is shown in Fig. 2 (right). The beam polarisation is a function of the beam momentum and is taken from a parametrisation based on a Monte Carlo simulation of the beam line, which was validated by SMC [13].
6 4 ASYMMETRY EXTRACTION
The final value of Ap1 is obtained as weighted average of the values calculated for the two target-spin orientations. It is corrected for spin-dependent radiative effects [14] and for the polarisation of the14N nuclei present in the target. It was verified that the use of semi-inclusive triggers and the requirement of a reconstructed hadron do not bias the determination of Ap1[11, 15]. More details on the analysis can be found in Ref. [16].
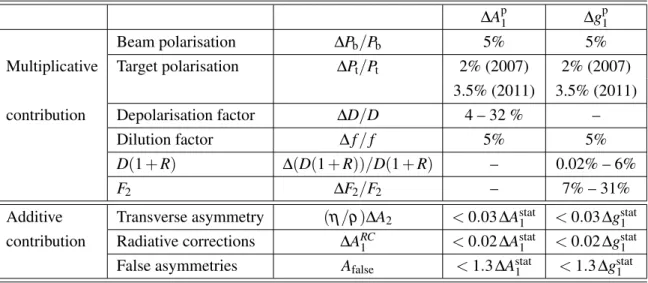
The additive and multiplicative systematic uncertainties of Ap1 are shown in Table 1. The largest multi-plicative contribution originates from the depolarisation factor D through its dependence on the poorly known function R = σL/σT, which is the ratio of the absorption cross sections of longitudinally and
transversely polarised virtual photons. The parameterisation of the function R described in detail in Ref. [8] takes into account all existing measurements together with an extension to very low values of Q2. As systematic uncertainty of R a constant value of 0.2 is taken for Q2< 0.2 (GeV/c)2. The largest additive
contribution originates from possible false asymmetries, which are estimated from time-dependent insta-bilities in the spectrometer as described in Ref. [16]. In certain kinematic regions, it can be larger than the statistical uncertainty.
Table 1:Systematic uncertainties of Ap1and gp1.
∆Ap1 ∆gp1
Beam polarisation ∆Pb/Pb 5% 5%
Multiplicative Target polarisation ∆Pt/Pt 2% (2007) 2% (2007)
3.5% (2011) 3.5% (2011)
contribution Depolarisation factor ∆D/D 4 – 32 % –
Dilution factor ∆ f / f 5% 5%
D(1 + R) ∆(D(1 + R))/D(1 + R) – 0.02% – 6%
F2 ∆F2/F2 – 7% – 31%
Additive Transverse asymmetry (η/ρ)∆A2 < 0.03 ∆Astat1 < 0.03 ∆gstat1
contribution Radiative corrections ∆ARC1 < 0.02 ∆Astat1 < 0.02 ∆gstat1 False asymmetries Afalse < 1.3 ∆Astat1 < 1.3 ∆gstat1
The spin-dependent structure function of the proton, gp1, is determined from the virtual-photon asymmetry Ap1neglecting Ap2: gp1= F p 2 2x(1 + R)A p 1. (4)
Here, F2p is the spin-independent structure function of the proton. For F2p we used the SMC parame-terisation [11] within its validity limits, i.e. x > 0.0009 and Q2> 0.2 (GeV/c)2. Outside these limits,
the values were calculated using the phenomenological model of Refs. [17, 18], which is based on the GVMD concept. Equation (4) can be written as
gp1= F p 2 2x D(1 + R)A p LL, (5)
so that the systematic uncertainty of gp1 can be obtained from the following three components: i) the systematic uncertainty of ApLL≡ Ap1/D, ii) the systematic uncertainty of F2p, and iii) the systematic uncer-tainty of the product D(1 + R). The systematic uncertainties of ALLand R were already discussed above.
The systematic uncertainty of F2pis estimated from the difference between the SMC parameterisation and the models of Refs. [17, 19, 20]. It is taken as half of the maximum of the absolute differences between
the used parameterisation or model and the remaining models. For Q2> 0.2 (GeV/c)2, this is always the absolute value of the difference between the SMC parameterization and the model of Refs. [17, 19]. When calculating gp1using Eq. (5) instead of Eq. (4), we benefit from the fact that D and R are correlated (see also Ref. [8]), which results in a reduced systematic uncertainty compared to the one of Ap1.
8 5 RESULTS
5 Results
We present here the results for the spin asymmetry Ap1and the spin structure function gp1measured in the kinematic range Q2< 1 (GeV/c)2and 4 × 10⁻⁵< x < 4 × 10⁻²using the two beam energies 160 GeV and 200 GeV. For each beam energy, the data are analysed in four two-dimensional grids: (x, Q2), (ν, Q2),
(x, ν) and (Q2, x), where the latter has a smaller number of x bins.
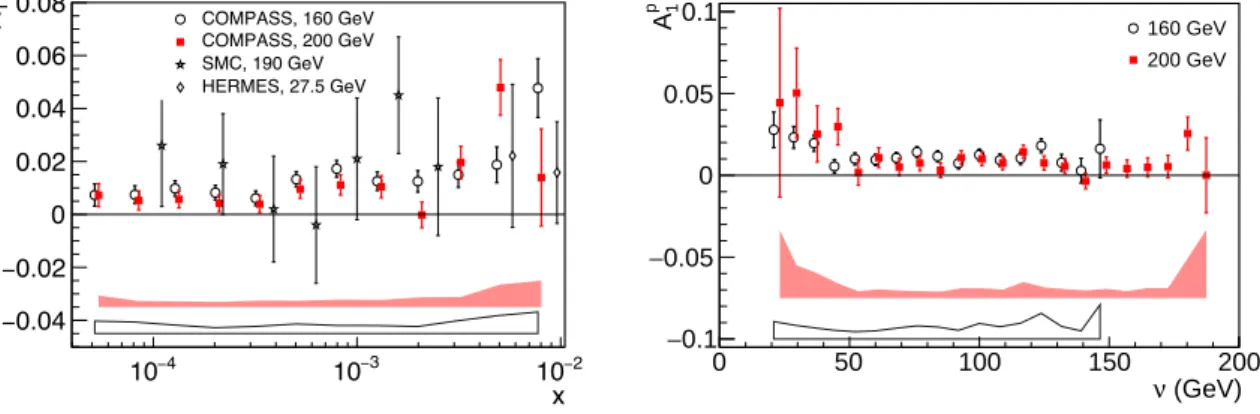
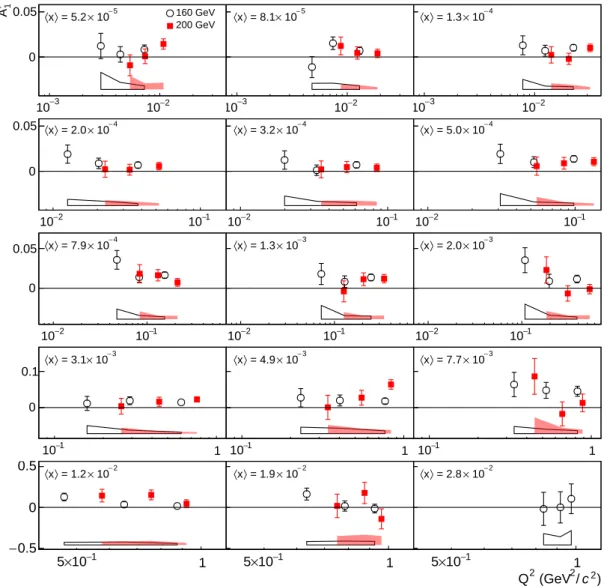
The x dependence of Ap1at the measured values of Q2is shown in Fig. 3 (left) for the two beam energies. A positive asymmetry is observed, which slightly rises with x. It amounts to about 0.01 at x < 10−3, indicating for the first time the existence of spin effects at such small values of x. Note that the COMPASS results for the deuteron [8] show an asymmetry Ad1compatible with zero. In Fig. 3 (left), also the results for Ap1from SMC [7, 11] and HERMES [21] are shown. Within the large statistical uncertainties, their results are consistent with our present results, but also with zero. Compared to the results from SMC, which is the only other experiment that covers the low-x region, we improve the statistics by a factor of about 150. In Fig. 3 (right), the ν-dependence of Ap1 is shown. A rather flat distribution is measured, apart from a slight enhancement for ν < 50 GeV that corresponds to higher values of Q2. In Fig. 4, the results for Ap1 are shown versus Q2for the 15 bins in x. The results obtained at 160 GeV and 200 GeV are consistent in the overlapping Q2region. From the figure, no conclusion on a possible Q2dependence can be drawn. x 4 − 10 10−3 10−2 p 1 A 0.04 − 0.02 − 0 0.02 0.04 0.06 0.08 COMPASS, 160 GeV COMPASS, 200 GeV SMC, 190 GeV HERMES, 27.5 GeV (GeV) ν 0 50 100 150 200 p 1 A 0.1 − 0.05 − 0 0.05 0.1 160 GeV 200 GeV 160 GeV 200 GeV
Figure 3: The asymmetry Ap1as a function of x at the measured Q2values for x < 0.01 (left) and as a function of ν (right). Error bars represent statistical and bands systematic uncertainties. On the left, results from other experiments [7, 11, 21] are also shown.
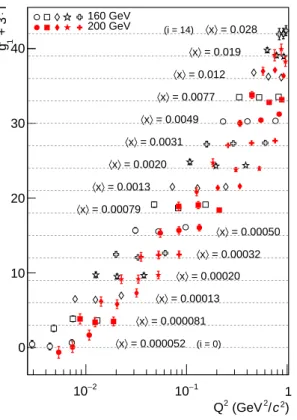
For the two beam energies, our results on gp1 are shown versus Q2 for the same 15 bins in x (Fig. 5) and versus x in 5 different bins in Q2 (Fig. 6). Down to the smallest value of x, i.e. 4 × 10⁻⁵, gp1 is positive within experimental uncertainties and does not show any trend to become negative or to grow with decreasing values of x.
All numerical values are available on HepData [22]. The numerical values for Ap1 and gp1 versus x, averaged over Q2, are given together with their statistical and systematic uncertainites in Table A.1
of the appendix for the two energies separately. The data for the two energies were combined and false asymmetries reevaluated for the merged data. The values for the combined results are given in Table A.2. In Fig. 7, the present results on gp1 are compared with the predictions of the phenomenological models of Refs. [5, 6]. The first model (BKZ) is based on GVMD ideas supplemented by the Regge formalism. The contribution of heavy vector mesons to gp1 was treated as an extrapolation of the QCD improved parton model to arbitrarily low values of Q2. The magnitude of the light vector meson contribution was fixed in the photoproduction limit by relating the first moment of gp1 to the static properties of the proton via the Drell-Hearn-Gerasimov sum rule [23], using the measurements in the region of baryonic
3 − 10 10−2 p 1 A 0 0.05 −5 10 × = 5.2 〉 x 〈 160 GeV 200 GeV 3 − 10 10−2 0 0.05 −5 10 × = 8.1 〉 x 〈 3 − 10 10−2 0 0.05 −4 10 × = 1.3 〉 x 〈 2 − 10 10−1 0 0.05 −4 10 × = 2.0 〉 x 〈 2 − 10 10−1 0 0.05 −4 10 × = 3.2 〉 x 〈 2 − 10 10−1 0 0.05 −4 10 × = 5.0 〉 x 〈 2 − 10 10−1 0 0.05 4 − 10 × = 7.9 〉 x 〈 2 − 10 10−1 0 0.05 3 − 10 × = 1.3 〉 x 〈 2 − 10 10−1 0 0.05 3 − 10 × = 2.0 〉 x 〈 1 − 10 1 0 0.1 3 − 10 × = 3.1 〉 x 〈 1 − 10 1 0 0.1 3 − 10 × = 4.9 〉 x 〈 1 − 10 1 0 0.1 3 − 10 × = 7.7 〉 x 〈 1 − 10 × 5 1 0.5 − 0 0.5 −2 10 × = 1.2 〉 x 〈 1 − 10 × 5 1 0.5 − 0 0.5 −2 10 × = 1.9 〉 x 〈 ) 2 c / 2 (GeV 2 Q 1 − 10 × 5 1 0.5 − 0 0.5 −2 10 × = 2.8 〉 x 〈
Figure 4:The asymmetry Ap1as a function of Q2in 15 bins of x for the two beam energies. The bands indicate the size of the systematic uncertainties.
resonances [24]. Both perturbative and non-perturbative contributions to gp1 are found to be present and substantial at all values of Q2. Reasonable agreement is observed between the BKZ model and our measurements in all four two-dimensional grids of kinematic variables. Figure 7 (left) shows a comparison of the x dependence of the BKZ model prediction with the results for gp1obtained combining the 160 GeV and 200 GeV results. In the model of Ref. [6] (ZR), the nonperturbative part of g1is also
parameterised using the vector meson dominance mechanism together with Regge predictions (albeit done differently than in Ref. [5]), while in the perturbative part QCD evolution is employed together with parton recombination corrections. The gp1 calculations of Ref. [6] are presented in Fig. 7 (right), where the broad bump at lowest values of x is almost entirely due to the VMD contribution.
10 5 RESULTS ) 2 c / 2 (GeV 2 Q 2 − 10 10−1 1 i ⋅ + 3 p 1 g 0 10 20 30 40 = 0.000052 〉 x 〈 = 0.000081 〉 x 〈 = 0.00013 〉 x 〈 = 0.00020 〉 x 〈 = 0.00032 〉 x 〈 = 0.00050 〉 x 〈 = 0.00079 〉 x 〈 = 0.0013 〉 x 〈 = 0.0020 〉 x 〈 = 0.0031 〉 x 〈 = 0.0049 〉 x 〈 = 0.0077 〉 x 〈 = 0.012 〉 x 〈 = 0.019 〉 x 〈 = 0.028 〉 x 〈 (i = 0) (i = 14) 160 GeV 200 GeV
Figure 5:The spin-dependent structure function gp1as a function of Q2in 15 bins of x, shifted vertically for clarity. Closed (open) symbols correspond to 160 GeV (200 GeV) data with error bars showing statistical uncertainties.
x 4 − 10 10−3 p 1 g 1.5 − 1 − 0.5 − 0 0.5 1 1.5 2 ) c = 0.0033 (GeV/ 〉 2 Q 〈 2 ) c = 0.010 (GeV/ 〉 2 Q 〈 2 ) c = 0.035 (GeV/ 〉 2 Q 〈 2 ) c = 0.13 (GeV/ 〉 2 Q 〈 2 ) c = 0.49 (GeV/ 〉 2 Q 〈
Figure 6: The spin-dependent structure function gp1as a function of x in 5 bins of Q2. Closed (open) symbols correspond to 160 GeV (200 GeV) data with error bars showing statistical uncertainties. Bands indicate the size of the systematic uncertainties. The data points of the first bin in Q2are slightly shifted to the left for better visibility.
x 4 − 10 10−3 10−2 p 1 g 3 − 2 − 1 − 0 1 2 3
160 GeV and 200 GeV data
BKZ x 4 − 10 10−3 10−2 p 1 g 3 − 2 − 1 − 0 1 2 3 160 GeV 200 GeV ZR 160 GeV ZR 200 GeV
Figure 7: Left: x dependence of combined gp1data. The curve shows results of the gp1calculations of BKZ. [5], where for the parameterisation of the perturbative part of gp1the DSSV [25] parton distributions at NLO accuracy. Right: Comparison of the x dependence of gp1at 160 GeV (open symbols) and 200 GeV (closed symbols) with the results of the calculations of ZR [6] at 160 and 200 GeV incident energy (solid and dotted lines). Error bars represent statistical and bands systematic uncertainties.
12 6 SUMMARY
6 Summary
New results are presented on the longitudinal double-spin asymmetry Ap1and the spin-dependent struc-ture function gp1 of the proton. In the kinematic domain of the measurement, 0.006 (GeV/c)2< Q2< 1 (GeV/c)2 and 4 × 10⁻⁵< x < 4 × 10⁻², these results improve the statistical precision by a factor of more than 10 compared to existing measurements.
The values of Ap1(x) and gp1(x) are found to be positive over the whole measured range of x, with a value of about 0.01 for the spin asymmetry for x < 10−3. While the earlier results obtained using a deuteron target were found to be consistent with zero, the present measurement shows for the first time non-zero spin effects at such small values of x. The data are compared to two phenomenological models of gp1 valid in the region of low x and low Q2[5, 6], which are based on vector meson dominance and partonic ideas suitably extrapolated to low values of Q2. These models describe the general trend in the data and indicate the existence of substantial perturbative and non-perturbative contributions to gp1 in the whole Q2range of the data.
Acknowledgments
We are grateful to J. Ruan and W. Zhu for discussions and supplying us with the gp1values and to R. Sassot and W. Vogelsang of DSSV for supplying as with the code to calculate their parton distributions and for their values of gp1. We gratefully acknowledge the support of the CERN management and staff and the skill and effort of the technicians of our collaborating institutes. This work was made possible by the financial support of our funding agencies.
A Appendix
The results for Ap1and gp1for 160 GeV and 200 GeV are given in Table A.1 and the combined results in Table A.2.
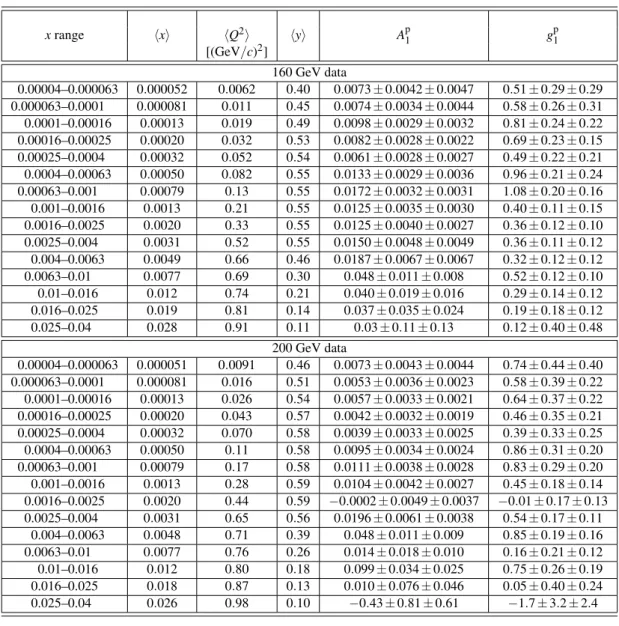
Table A.1: Values of Ap1 and gp1 with their statistical and systematic uncertainties as a function of x and the average values of x, Q2and y, for the 160 GeV and 200 GeV data. The maximum value of Q2used in the analysis is 1 (GeV/c)2. Bins in x are of equal width in log
10x.
xrange hxi hQ2i hyi Ap
1 g p 1 [(GeV/c)2] 160 GeV data 0.00004–0.000063 0.000052 0.0062 0.40 0.0073 ± 0.0042 ± 0.0047 0.51 ± 0.29 ± 0.29 0.000063–0.0001 0.000081 0.011 0.45 0.0074 ± 0.0034 ± 0.0044 0.58 ± 0.26 ± 0.31 0.0001–0.00016 0.00013 0.019 0.49 0.0098 ± 0.0029 ± 0.0032 0.81 ± 0.24 ± 0.22 0.00016–0.00025 0.00020 0.032 0.53 0.0082 ± 0.0028 ± 0.0022 0.69 ± 0.23 ± 0.15 0.00025–0.0004 0.00032 0.052 0.54 0.0061 ± 0.0028 ± 0.0027 0.49 ± 0.22 ± 0.21 0.0004–0.00063 0.00050 0.082 0.55 0.0133 ± 0.0029 ± 0.0036 0.96 ± 0.21 ± 0.24 0.00063–0.001 0.00079 0.13 0.55 0.0172 ± 0.0032 ± 0.0031 1.08 ± 0.20 ± 0.16 0.001–0.0016 0.0013 0.21 0.55 0.0125 ± 0.0035 ± 0.0030 0.40 ± 0.11 ± 0.15 0.0016–0.0025 0.0020 0.33 0.55 0.0125 ± 0.0040 ± 0.0027 0.36 ± 0.12 ± 0.10 0.0025–0.004 0.0031 0.52 0.55 0.0150 ± 0.0048 ± 0.0049 0.36 ± 0.11 ± 0.12 0.004–0.0063 0.0049 0.66 0.46 0.0187 ± 0.0067 ± 0.0067 0.32 ± 0.12 ± 0.12 0.0063–0.01 0.0077 0.69 0.30 0.048 ± 0.011 ± 0.008 0.52 ± 0.12 ± 0.10 0.01–0.016 0.012 0.74 0.21 0.040 ± 0.019 ± 0.016 0.29 ± 0.14 ± 0.12 0.016–0.025 0.019 0.81 0.14 0.037 ± 0.035 ± 0.024 0.19 ± 0.18 ± 0.12 0.025–0.04 0.028 0.91 0.11 0.03 ± 0.11 ± 0.13 0.12 ± 0.40 ± 0.48 200 GeV data 0.00004–0.000063 0.000051 0.0091 0.46 0.0073 ± 0.0043 ± 0.0044 0.74 ± 0.44 ± 0.40 0.000063–0.0001 0.000081 0.016 0.51 0.0053 ± 0.0036 ± 0.0023 0.58 ± 0.39 ± 0.22 0.0001–0.00016 0.00013 0.026 0.54 0.0057 ± 0.0033 ± 0.0021 0.64 ± 0.37 ± 0.22 0.00016–0.00025 0.00020 0.043 0.57 0.0042 ± 0.0032 ± 0.0019 0.46 ± 0.35 ± 0.21 0.00025–0.0004 0.00032 0.070 0.58 0.0039 ± 0.0033 ± 0.0025 0.39 ± 0.33 ± 0.25 0.0004–0.00063 0.00050 0.11 0.58 0.0095 ± 0.0034 ± 0.0024 0.86 ± 0.31 ± 0.20 0.00063–0.001 0.00079 0.17 0.58 0.0111 ± 0.0038 ± 0.0028 0.83 ± 0.29 ± 0.20 0.001–0.0016 0.0013 0.28 0.59 0.0104 ± 0.0042 ± 0.0027 0.45 ± 0.18 ± 0.14 0.0016–0.0025 0.0020 0.44 0.59 −0.0002 ± 0.0049 ± 0.0037 −0.01 ± 0.17 ± 0.13 0.0025–0.004 0.0031 0.65 0.56 0.0196 ± 0.0061 ± 0.0038 0.54 ± 0.17 ± 0.11 0.004–0.0063 0.0048 0.71 0.39 0.048 ± 0.011 ± 0.009 0.85 ± 0.19 ± 0.16 0.0063–0.01 0.0077 0.76 0.26 0.014 ± 0.018 ± 0.010 0.16 ± 0.21 ± 0.12 0.01–0.016 0.012 0.80 0.18 0.099 ± 0.034 ± 0.025 0.75 ± 0.26 ± 0.19 0.016–0.025 0.018 0.87 0.13 0.010 ± 0.076 ± 0.046 0.05 ± 0.40 ± 0.24 0.025–0.04 0.026 0.98 0.10 −0.43 ± 0.81 ± 0.61 −1.7 ± 3.2 ± 2.4
14 A APPENDIX
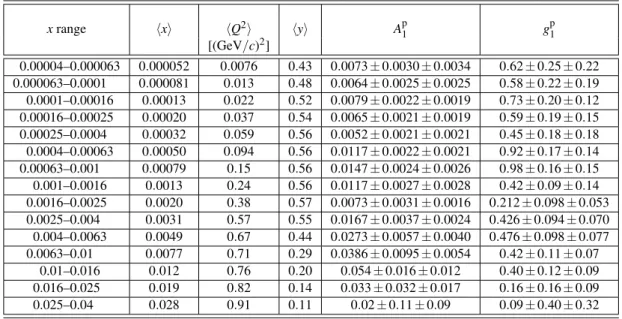
Table A.2:Values of Ap1and gp1with their statistical and systematic uncertainities as a function of x and the average values of x, Q2and y, shown for the combination of 160 GeV and 200 GeV data. The maximum value of Q2used in the analysis is 1 (GeV/c)2. Bins in x are of equal width in log10x.
xrange hxi hQ2i hyi Ap
1 g p 1 [(GeV/c)2] 0.00004–0.000063 0.000052 0.0076 0.43 0.0073 ± 0.0030 ± 0.0034 0.62 ± 0.25 ± 0.22 0.000063–0.0001 0.000081 0.013 0.48 0.0064 ± 0.0025 ± 0.0025 0.58 ± 0.22 ± 0.19 0.0001–0.00016 0.00013 0.022 0.52 0.0079 ± 0.0022 ± 0.0019 0.73 ± 0.20 ± 0.12 0.00016–0.00025 0.00020 0.037 0.54 0.0065 ± 0.0021 ± 0.0019 0.59 ± 0.19 ± 0.15 0.00025–0.0004 0.00032 0.059 0.56 0.0052 ± 0.0021 ± 0.0021 0.45 ± 0.18 ± 0.18 0.0004–0.00063 0.00050 0.094 0.56 0.0117 ± 0.0022 ± 0.0021 0.92 ± 0.17 ± 0.14 0.00063–0.001 0.00079 0.15 0.56 0.0147 ± 0.0024 ± 0.0026 0.98 ± 0.16 ± 0.15 0.001–0.0016 0.0013 0.24 0.56 0.0117 ± 0.0027 ± 0.0028 0.42 ± 0.09 ± 0.14 0.0016–0.0025 0.0020 0.38 0.57 0.0073 ± 0.0031 ± 0.0016 0.212 ± 0.098 ± 0.053 0.0025–0.004 0.0031 0.57 0.55 0.0167 ± 0.0037 ± 0.0024 0.426 ± 0.094 ± 0.070 0.004–0.0063 0.0049 0.67 0.44 0.0273 ± 0.0057 ± 0.0040 0.476 ± 0.098 ± 0.077 0.0063–0.01 0.0077 0.71 0.29 0.0386 ± 0.0095 ± 0.0054 0.42 ± 0.11 ± 0.07 0.01–0.016 0.012 0.76 0.20 0.054 ± 0.016 ± 0.012 0.40 ± 0.12 ± 0.09 0.016–0.025 0.019 0.82 0.14 0.033 ± 0.032 ± 0.017 0.16 ± 0.16 ± 0.09 0.025–0.04 0.028 0.91 0.11 0.02 ± 0.11 ± 0.09 0.09 ± 0.40 ± 0.32
References
[1] C.A. Aidala, S.D. Bass, D. Hasch, G.K. Mallot, Rev. Mod. Phys. 85 (2013) 655. [2] COMPASS Collaboration, C. Adolph, et al., Phys. Lett. B 753 (2016) 18.
[3] B.I. Ermolaev, M. Greco, S.I. Troyan, Eur. Phys. J. C 50 (2007) 823; ibid. C51 (2007) 859. [4] B. Badełek, J. Kwieci´nski, J. Kiryluk, Phys. Rev. D 61 (2000) 014009.
[5] B. Badełek, J. Kwieci´nski, B. Ziaja, Eur. Phys. J. C 26 (2002) 45 and private communication (2017).
[6] W. Zhu, J. Ruan, Int. J. Mod. Phys. E24 (2015) 1550077.
[7] SMC, B. Adeva, et al., Phys. Rev. D 60 (1999) 072004; erratum ibid., D 62 (2000) 079902. [8] COMPASS Collaboration, V.Yu. Alexakhin, et al., Phys. Lett. B 647 (2007) 330.
[9] COMPASS Collaboration, M.G. Alekseev, et al., Phys. Lett. B 690 (2010) 466. [10] COMPASS Collaboration, P. Abbon, et al., Nucl. Instr. Meth. A 577 (2007) 455. [11] SMC, B. Adeva, et al., Phys. Rev. D 58 (1998) 112001.
[12] A. A. Akhundov, et al., Fortsch. Phys. 44 (1996) 373. [13] SMC, B. Adeva, et al., Nucl. Instr. Meth. A 343 (1994) 363. [14] I. V. Akushevich, N. M. Shumeiko, J. Phys. G 20 (1994) 513. [15] M. Wilfert, PhD Thesis, Mainz University, 2017;
http://wwwcompass.cern.ch/compass/publications/welcome.html#theses. [16] A.S. Nunes, PhD Thesis, University of Lisbon, 2017;
http://wwwcompass.cern.ch/compass/publications/welcome.html#theses. [17] J. Kwieci´nski, B. Badełek, Z. Phys. C 43 (1989) 251.
[18] B. Badełek, J. Kwieci´nski, Phys. Lett. B 295 (1992) 263.
[19] J. Bartels, K. Golec-Biernat, H. Kowalski, Phys. Rev. D 66 (2002) 014001. [20] H. Abramowicz, A. Levy, DESY 97–251 and hep-ph/9712415.
[21] HERMES Collaboration, A. Airapetian, et al., Phys. Rev. D 75 (2007) 012007. [22] The Durham HepData Project, http://durpdg.dur.ac.uk/.
[23] S.D. Drell, A.C. Hearn, Phys. Rev. Lett. 16 (1966) 908; S.B. Gerasimov, Sov. J. Nucl. Phys. 2 (1966) 430; M. Hosoda, K. Yamamoto, Prog. Theor. Phys. Lett. 36 (1966) 425.
[24] GDH Collaboration, K. Helbing, et al., Nucl. Phys. Proc. Suppl. 105 (2002) 113.