Universidade de Aveiro
2017
Departamento de Ciências Médicas
Hélder Filipe
Fernandes Melro
Contribuições para decifrar a trajetória da Doença
Pulmonar Obstrutiva Crónica: associações entre
medidas genéticas e clínicas
Contributions for unravelling Chronic Obstructive
Pulmonary Disease trajectory: associations between
genetics and clinical measures
Dissertação apresentada à Universidade de Aveiro para cumprimento dos requisitos necessários à obtenção do grau de Mestre em Biomedicina Molecular, realizada sob a orientação científica da Doutora Alda Sofia Pires de Dias Marques, Professora Adjunta da Escola Superior de Saúde da Universidade de Aveiro e da Doutora Gabriela Maria Ferreira Ribeiro de Moura, Professora Auxiliar do Departamento de Ciências Médicas.
Financiado pelo Programa Operacional de Competitividade e
Internacionalização COMPETE, através do Fundo Europeu de Desenvolvimento Regional FEDER (POCI-01-0145-FEDER-016701), Fundação para Ciência e
Tecnologia (PTDC/DTPPIC/2284/2014) e através do projeto
UID/BIM/04501/2013
o júri
presidente Prof. Doutora Odete Abreu Beirão da Cruz e Silva
Professora Auxiliar com Agregação do Departamento de Ciências Médicas da Universidade de Aveiro
Prof. Doutor João Almeida Lopes Fonseca
Professor Auxiliar com Agregação da Faculdade de Medicina da Universidade do Porto
Prof. Doutora Alda Sofia Pires de Dias Marques
Professora Adjunta da Escola Superior de Saúde da Universidade de Aveiro
agradecimentos Ao finalizar esta dissertação de mestrado não posso deixar de agradecer: À minha orientadora, Professora Doutora Alda Marques, pela supervisão, apoio constante, pelos ensinamentos transmitidos e acima de tudo pela oportunidade de trabalhar com a sua equipa. Estarei eternamente grato.
À Professora Doutora Gabriela Moura pela co-orientação neste trabalho, pela disponibilidade constante e por todo o apoio.
A todas as instituições que colaboraram neste projeto, sem as quais este trabalho não se realizaria.
A todos os pacientes que participaram neste estudo, pela disponibilidade e compreensão. Vocês são sem dúvida o melhor exemplo de que não há nenhum problema que não se ultrapasse na vida!
A todos os meus amigos e colegas do mestrado. Foi uma longa e difícil caminhada, mas mostramos que caminhando lado a lado tudo é mais fácil! À equipa do Lab3R por todo a ajuda, profissionalismo, companhia dada ao longo deste ano e por provarem que a união de grupo torna sempre as coisas mais fáceis. Foi um prazer trabalhar com todos vocês.
À Ana Oliveira, à Filipa Machado e à Cristina Jácome, por me mostrarem que “existe sempre uma associação significativa entre o esforço e o resultado final de p<0.05”. Obrigado por toda a vossa ajuda.
À Sofia Varanda por toda a paciência, ensinamentos, apoio e constante boa disposição.
À Cláudia por acreditar em mim, por me relembrar do meu valor e nunca me deixar desistir, muito obrigado!
Aos meus pais, por todo o amor, apoio incondicional, motivação, confiança. A vocês, melhores do mundo, devo TUDO o que sou hoje.
palavras-chave doença pulmonar obstrutiva crónica, DPOC, gene, polimorfismo de nucleótido simples, medidas reportadas pelos pacientes, medidas clínicas.
resumo A Doença Pulmonar Obstrutiva Crónica (DPOC) é uma doença multifatorial e heterogénea que apresenta impactos diferentes em pacientes com estadios da doença semelhantes. Isto sugere que outros fatores para além da função pulmonar podem afetar a forma como o paciente experiencia a sua doença. As medidas reportadas pelo paciente (PROs) são um conjunto de variáveis que permitem avaliar a autoperceção e experiência dos doentes em relação à sua doença. Estudos recentes reportaram a existência de associações entre polimorfismos de nucleótidos simples (SNPs) e PROs, mas pouco ainda se sabe sobre estas associações e seu significado. Assim, este estudo teve como objetivo principal explorar possíveis associações entre variantes genéticas específicas e medidas clínicas, entre as quais PROs. Pretendeu também contribuir para a caracterização dos genótipos dos doentes com DPOC em Portugal.
Realizou-se um estudo transversal com 60 doentes com DPOC. As PROs avaliadas foram 1) frequência de exacerbações autoreportadas pelos doentes, 2) dispneia com a modified medical Research Council Scale e Borg, 3) fadiga com a Borg, 4) ansiedade e depressão através da escala de ansiedade e depressão hospitalar, 5) impacto da doença com o teste de avaliação da DPOC e 6) qualidade de vida relacionada com a saúde (QVRS) com questionário do hospital de St. George na doença respiratória. Adicionalmente, outras medidas clínicas também foram avaliadas, i. é., função pulmonar, força muscular periférica com dinamometria digital, força dos músculos respiratórios com a medição das pressões respiratórias e capacidade funcional através do teste de levantar e sentar cinco vezes e 1 minuto. Zaragatoas orofaríngeas e amostras de saliva foram recolhidas de todos os pacientes para genotipagem.
Foram encontradas associações significativas entre variantes genéticas e dispneia (rs1143634, rs1042717, rs1138272 e rs12504628), fadiga (rs1042714 e rs1138272), ansiedade (rs1051303, rs1800450 e rs1131620), impacto da doença (rs10461985 e rs1172113) e QVRS (rs11172113, rs1042713, rs1138272 e rs12504628). Também foram encontradas variantes significativamente associadas à função pulmonar (rs1042713, rs1042717 e rs5030737), força dos músculos respiratórios (rs1130866), força muscular periférica (rs1042713, rs1042717, rs11172113 e rs11556218) e capacidade funcional (rs12899618, rs11046966 e rs1138272).
Este foi um estudo exploratório e mais investigações são necessárias para confirmar os resultados obtidos e para explorar mais profundamente a associação e interpretação entre a genética e a trajetória da DPOC.
keywords chronic obstructive pulmonary disease, COPD, gene, single nucleotide polymorphism, patient-reported outcomes, clinical outcomes.
abstract Chronic Obstructive Pulmonary Disease (COPD) is a multifactorial and heterogeneous disease which impacts differently on patients with similar grades. This suggests that factor others than lung function may affect patients experience of the disease. Patient-reported outcomes (PROs) are a set of measures that allow to assess patients’ self-perception and experience of the disease. Recent studies have reported associations between specific single nucleotide polymorphisms (SNPs) and PROs, however not much is known about these associations and their meanings. Thus, this study had as main objective to explore possible associations between specific genetic variants and clinical measures, including PROs. It also sought to contribute for a characterization of the genotypes from patients with COPD in Portugal.
A cross-sectional study was conducted in a total number of 60 patients with COPD. The PROs assessed were: 1) self-reported frequency of exacerbations, 2) dyspnoea with modified Medical Research Council and Borg scales , 3) fatigue with Borg scale, 4) anxiety and depression with Hospital Anxiety and Depression scale; 5) impact of the disease with COPD Assessment Test and 6) health-related quality of life (HRQOL) with St. George Respiratory questionnaire; Additionally, several surrogate outcomes were also assessed i. e., lung function, peripheral muscle strength with digital dynamometer, respiratory muscle strength with the respiratory pressure assessment and functional capacity through the 1 minute and 5 time sit-to-stand. Both oropharyngeal swabs and saliva samples were collected from the patients for genotyping.
Significant associations were found between genetic variants and dyspnoea (rs1143634, rs1042717, rs1138272 and rs12504628), fatigue (rs1042714, rs1138272), anxiety (rs1051303, rs1800450 and rs1131620), impact of the disease (rs10461985 and rs11172113) and HRQOL (rs11172113, rs1042713, rs1138272 and rs12504628). Significant associations were also found between genetic variants and lung function (rs1042713, rs1042717, rs5030737), respiratory muscle strength (rs1130866), peripheral muscle strength (rs1042713, rs1042717, rs11172113, rs11556218) and functional capacity (rs12899618, rs11046966 and rs1138272).
This was an exploratory study and more investigations are necessary to confirm the results obtained and to explore deeply the associations and interpretations between genetics and COPD trajectory.
i
Table of contents
1. INTRODUCTION ... 1
2. STATE OF THE ART ... 5
2.1. Brief overview ... 72.2. Risk Factors ... 7
2.3. Chronic Obstructive Pulmonary Disease and its clinical manifestations ... 9
2.4. Disease classification ... 9
2.5. Patient-reported outcomes ... 10
2.6. Genetics of Chronic Obstructive Pulmonary Disease ... 12
2.7. Patient-reported outcomes and genetics ... 13
2.8. Objectives ... 13
3. METHODS ... 15
3.1. Ethics ... 173.2. Design and Participants ... 17
3.3. Measures ... 18
3.4. Procedures ... 20
3.5. Data analysis ... 23
3.5.1. Sample analysis ... 23
3.5.1.1 DNA extraction ... 23 3.5.1.2. DNA quantification ... 23 3.5.1.3. DNA integrity ... 24 3.5.1.4. DNA samples SpeedVac ... 25 3.5.1.5. Array genotyping ... 25 3.5.2. Statistical analysis ... 26
4. RESULTS ... 29
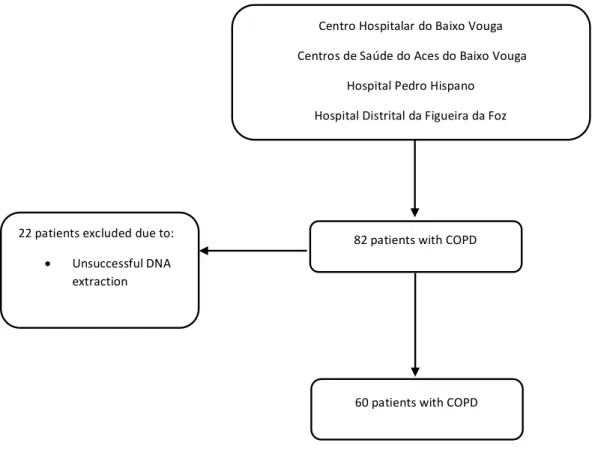
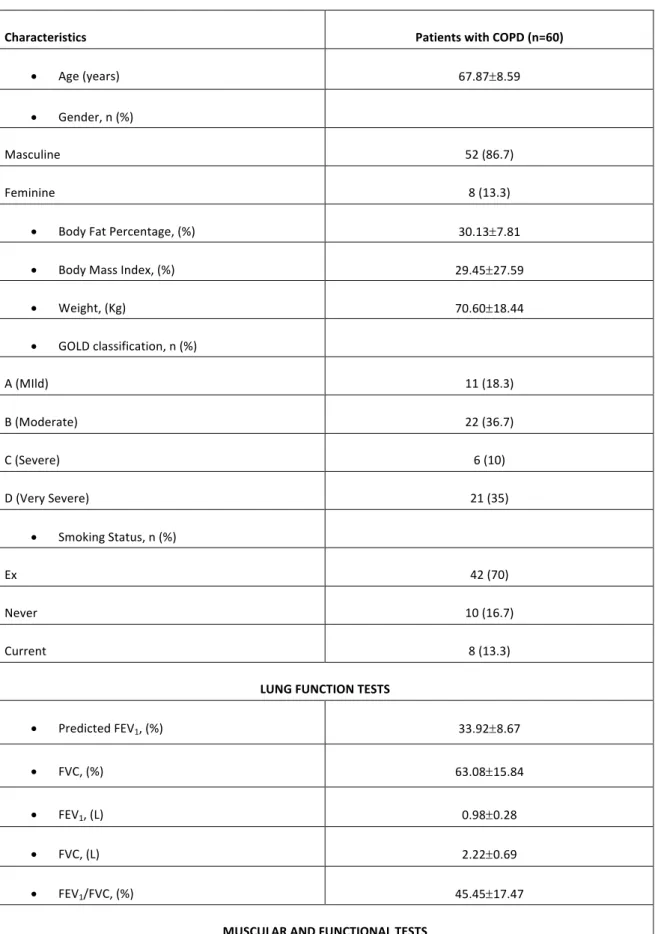
4.1. Sample recruitment ... 314.2. Sample characterization ... 31
4.3. Samples quality ... 34
4.3.1. Buccal cell samples from Oropharyngeal Swabs ... 34
4.3.2. Saliva ... 34
4.4. DNA quantification ... 34
4.5. DNA integrity ... 35
4.6. DNA samples SpeedVac ... 35
4.7. COPD-related genotyping targets ... 36
4.7.1. Significant associations between Patient-reported outcomes and genetic variants ... 38
4.7.1.1 Dyspnoea ... 38 4.7.1.2. Dyspnoea and fatigue ... 38 4.7.1.3 Anxiety and depression ... 39 4.7.1.4 Impact of COPD ... 40 4.7.1.5 Health-related quality of life ... 41 4.7.2. Significant associations between Surrogate Outcomes and genetic variants ... 45
4.7.2.1 Lung function ... 45
ii 4.7.2.2 Respiratory muscle strength ... 47 4.7.2.3 Peripheral muscle strength ... 47 4.7.2.4 Functional capacity ... 48
5. DISCUSSION ... 51
5.1. Overview ... 535.2. Samples quality and quantity ... 53
5.3. Microarray genotyping ... 54
5.3.1. Associations between Patient-reported Outcomes and genetic variants ... 54
5.3.2. Associations between Surrogate Outcomes and genetic variants ... 55
5.3.3. Limitations ... 57
6. CONCLUSIONS AND FUTURE RESEARCH ... 59
REFERENCES ... 63
Annex I – Ethics’ approval ... 73
Appendix I: Publication I (under review at PLOS One-PONE-D-17-33441)- Genetic profile
and patient-reported outcomes(PROs) in Chronic Obstructive Pulmonary Disease: a
systematic review. ... 79
Appendix II: Targeted gene sequencing panel ... 113
Appendix III: Characteristics of the total 60 DNA samples selected for genotyping ... 141
Appendix IV: Poster discussion (PA4713) at 2017 European Respiratory Society (ERS) .. 145
Appendix V: Associations between SNPs and PROS/clinical outcomes (Results) ... 149
Appendix VI: Participant information sheet ... 191
Appendix VII: Informed consent ... 197
Appendix VIII: Data collection protocol ... 201
iii
List of figures
Figure 1- Risk factors for developing Chronic Obstructive Pulmonary Disease………8 Figure 2- The Global Initiative for Chronic Obstructive Lung Diseases ABCD assessment. Adapted from [1]. ………10 Figure 3- Commonly used patient-reported outcomes measures in Chronic Obstructive Pulmonary Disease and other patient-reported outcomes used. Adapted from [25]. ……….11 Figure 4- Test of quadriceps muscle strength using hand-held dynamometer. ……….….21 Figure 5- Initial position of the maximal inspiratory/expiratory pressure. ……….22 Figure 6-Sample recruitment process. ………...31 Figure 7- Saliva samples with visible impurities. Sample A-sample with normal appearance; Sample B- agglomerate of food particles and other impurities; Sample C- brown coloration from a smoker patient; Sample D- sample with sputum; Sample E- red coloration from lipstick. ……….34 Figure 8 - Agarose gel of four samples to detect degradation...………...35Figure 9- Genetic variants associated with patient-reported outcomes in chronic obstructive pulmonary disease (Adapted from poster (PA4713) at European Respiratory Society (ERS) 2017-AppendixIV).………..36
Figure 10- Process conducted to obtain the 32 SNPs analysed in this dissertation……….. 37
Figure 11-Significant differences obtained between GG and AA genotypes from rs1143634 SNP and dyspnoea scores registered with Modified medical research council. Horizontal lines in the box plot represents the medians, the limits of the box plot represent the 25th and 75th percentiles and the vertical lines (whiskers) are the minimum and maximum values. *p<0.05 (Mann-Whitney U test with Bonferroni correction)……….38
Figure 12-Significant differences obtained between genotypes of rs1042717, rs1138272 and rs12504628 SNPs and dyspnoea scores registered with Borg scale. Horizontal lines in the box plot represent the medians, the limits of the box plot represent the 25th and 75th percentiles and the vertical lines (whiskers) are the minimum and maximum values. *p<0.05 (Mann-Whitney U test with Bonferroni correction). ……….……39
Figure 13-Significant differences obtained between genotypes of rs1042714 and rs1138272 SNPs and fatigue scores registered with Borg scale. Horizontal lines in the box plot represents the medians, the limits of the box plot represent the 25th and 75th percentiles and the vertical lines (whiskers) are the minimum and maximum values. *p<0.05 (Mann-Whitney U test with Bonferroni correction). ………39
Figure 14-Significant differences obtained between genotypes from rs1051303, rs1800450 and rs1131620 SNPs and anxiety scores registered with Hospital Anxiety and Depression scale. Horizontal lines in the box plot represents the medians, the limits of the box plot represent the 25th and 75th percentiles and the vertical lines (whiskers) are the minimum and maximum values. *p<0.05 (Mann-Whitney U test with Bonferroni correction)………40
iv Figure 15-Significant differences obtained between genotypes from rs10461985 and rs1172113 SNPs and health-related quality of life scores registered with Chronic Obstructive Pulmonary Disease Assessment Test. Horizontal lines in the box plot represents the medians, the limits of the box plot represent the 25th and 75th percentiles and the vertical lines (whiskers) are the minimum
and maximum values. *p<0.05 (Mann-Whitney U test with Bonferroni correction)……….41 Figure 16- Significant differences obtained between AA and AG genotypes from rs11172113 SNP and health-related quality of life assessed with St. George Respiratory Questionnaire (symptoms score). Horizontal lines in the box plot represents the medians, the limits of the box plot represent the 25th and 75th percentiles and the vertical lines (whiskers) are the minimum and maximum
values. *p<0.05 (One-way ANOVA test with Bonferroni correction)………..42 Figure 17- Significant differences obtained between genotypes from rs1042713, rs11172113 and rs1138272 SNPs and health-related quality of life assessed with St. George Respiratory Questionnaire (activity score). Horizontal lines in the box plot represents the medians, the limits of the box plot represent the 25th and 75th percentiles and the vertical lines (whiskers) are the
minimum and maximum values. *p<0.05 (One-way ANOVA test with Bonferroni correction)……….42 Figure 18- Significant differences obtained between genotypes and rs1138272 and rs12504628 SNPs and health-related quality of life assessed with St. George Respiratory questionnaire (impact score). Horizontal lines in the box plot represents the medians, the limits of the box plot represent the 25th and 75th percentiles and the vertical lines (whiskers) are the minimum and maximum
values. *p<0.05 (One-way ANOVA with Bonferroni correction)……….43 Figure 19- Significant differences obtained between genotypes and rs1138272 and rs11172113 SNP and health-related quality of life assessed with St. George Respiratory questionnaire (total score). Horizontal lines in the box plot represents the medians, the limits of the box plot represent the 25th
and 75th percentiles and the vertical lines (whiskers) are the minimum and maximum values.
*p<0.05 (One-way ANOVA with Bonferroni correction)………..43 Figure 20- Summary of the associations between single nucleotide polymorphisms, patient-reported outcomes and patient-reported outcomes measures……….44 Figure 21-Significant differences obtained between CC and CT genotypes from rs1042713 SNP and FEV1pp. Horizontal lines in the box plot represents the medians, the limits of the box plot represent the 25th and 75th percentiles and the vertical lines (whiskers) are the minimum and maximum
values. *p<0.05 (One-way ANOVA with Bonferroni correction)……….46 Figure 22-Significant differences obtained between genotypes from rs1042717 and rs5030737 SNPs and FVCpp. Horizontal lines in the box plot represents the medians, the limits of the box plot represent the 25th and 75th percentiles and the vertical lines (whiskers) are the minimum and maximum values. *p<0.05 (One-way ANOVA with Bonferroni correction)………46 Figure 23-Significant differences obtained between GG and GA genotypes from rs5030737 SNP and FEV1/FVC ratio. Horizontal lines in the box plot represents the medians, the limits of the box plot represent the 25th and 75th percentiles and the vertical lines (whiskers) are the minimum and
maximum values. *p<0.05 (One-way ANOVA with Bonferroni correction)………46 Figure 24-Significant differences obtained between TC and CC genotypes from rs1130666 SNP and maximum expiratory pressure. Horizontal lines in the box plot represents the medians, the limits of
v the box plot represent the 25th and 75th percentiles and the vertical lines (whiskers) are the
minimum and maximum values. *p<0.05 (One-way ANOVA with Bonferroni correction)……….47 Figure 25-Significant differences obtained between genotypes from rs1042713 and rs1042717 SNP and quadriceps muscle strength assessed with dynamometer. Horizontal lines in the box plot represents the medians, the limits of the box plot represent the 25th and 75th percentiles and the
vertical lines (whiskers) are the minimum and maximum values. *p<0.05 (One-way ANOVA with Bonferroni correction)………48 Figure 26- Significant differences obtained between genotypes from rs11172113 and rs11556218 SNP and handgrip test. Horizontal lines in the box plot represents the medians, the limits of the box plot represent the 25th and 75th percentiles and the vertical lines (whiskers) are the minimum and
maximum values. *p<0.05 (One-way ANOVA with Bonferroni correction)………..48 Figure 27-Significant differences obtained between genotypes from rs12899618 SNP and 5 time sit-to-stand test scores. Horizontal lines in the box plot represents the medians, the limits of the box plot represent the 25th and 75th percentiles and the vertical lines (whiskers) are the minimum and
maximum values. *p<0.05 (One-way ANOVA with Bonferroni correction)………..49 Figure 28-Significant differences obtained between genotypes from rs11046966 and rs1138272 SNPs and 1 minute sit-to-stand test scores. Horizontal lines in the box plot represents the medians, the limits of the box plot represent the 25th and 75th percentiles and the vertical lines (whiskers) are
the minimum and maximum values. *p<0.05 (One-way ANOVA with Bonferroni correction)………..49 Figure 29- Summary of the associations between single nucleotide polymorphisms and surrogate outcomes and outcome measures……….50
vi
List of tables
Table 1-Global Initiative for Chronic Obstructive Pulmonary Disease classification of airflow limitation severity. Adapted from [1] ... 9Table 2-Sample characterisation. ... 32
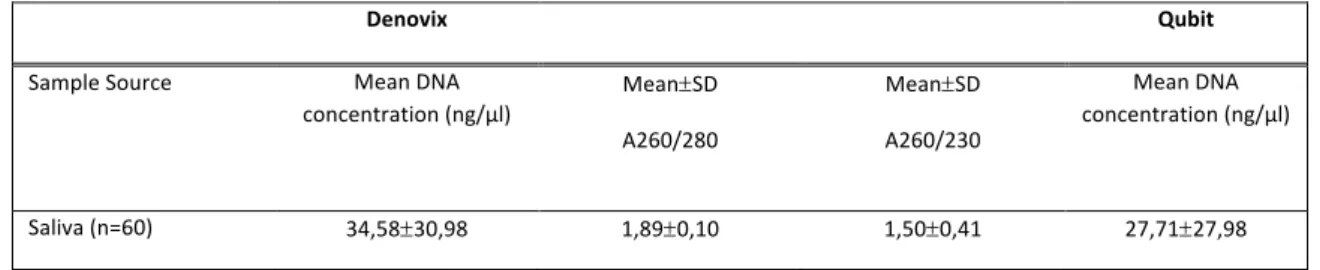
Table 3-Characteristics of the 60 saliva DNA samples that were selected for genotyping analysis. Data for individual samples can be consulted in Appendix III ... 35
Table 4-Characteristics of the 60 saliva DNA samples selected for genotyping after speed vacuum concentration. ... 36
Table S 1- Targeted gene sequencing panel for microarray genotyping ... 115
Table S 2-Characteristics (DNA concentration and ratios from Denovix and DNA concentration from Qubit) of the 60 samples selected for microarray genotyping ... 143
Table S 3-Associations between modified medical research council and genetic variants ... 151
Table S 4-Associations between frequency of exacerbations and genetic variants ... 153
Table S 5-Associations between Borg scale (Dyspnoea) and genetic variants ... 155
Table S 6-Associations between Borg scale (fatigue) and genetic variants ... 157
Table S 7-Associations between Chronic Obstructive Pulmonary Disease Assessment Test and genetic variants ... 159
Table S 8-Associations between Hospital Anxiety and Depression scale (Anxiety score) and genetic variants ... 161
Table S 9-Associations between Hospital Anxiety and Depression scale (Depression score) and genetic variants ... 163
Table S 10-Associations between St. George Respiratory Questionnaire (Symptoms score) and genetic variants ... 165
Table S 11-Associations between St. George Respiratory Questionnaire (Activity score) and genetic variants ... 167
Table S 12-Associations between St. George Respiratory Questionnaire (Impact Score) and genetic variants ... 169
Table S 13-Associations between St. George Respiratory Questionnaire (Total Score) and genetic variants ... 171
Table S 14-Associations between Fev1pp and genetic variants ... 173
Table S 15-Associations between FVCpp and genetic variants ... 175
Table S 16-Associations between FEV1/FVC ratio and genetic variants ... 177
Table S 17-Associations between maximum inspiratory pressure and genetic variants ... 179
Table S 18-Associations between maximum expiratory pressure and genetic variants ... 181
Table S 19-Associations between quadriceps muscle strength (dynamometer) and genetic variants ... 183
Table S 20-Associations between handgrip and genetic variants ... 185
Table S 21-Associations between five time sit-to-stand test and genetic variants ... 187
Table S 22-Associations between one minute sit-to-stand test and genetic variants ... 189
vii
List of abbreviations
5STS Five time seat to stand AAT Alpha 1 antitrypsin ADRB2 Beta 2-adrenergic receptor BMI Body Max Index CAT Chronic Obstructive Pulmonary Disease Test COPD Chronic Obstructive Pulmonary Disease ESSUA Escola Superior de Saúde da Universidade de Aveiro FEV1pp Forced expiratory volume in one second percent predicted FVCpp Forced vital capacity percent predicted GOLD Global Initiative for Chronic Obstructive Pulmonary Disease IBIMED Instituto de Biomedicina da Universidade de Aveiro LRP1 LDL receptor related protein1 LTBP4 Latent transforming growth factor beta binding protein 4 MBL2 Mannose binding lectine 2 MEP Maximum expiratory pressure MIP Maximum inspiratory pressure mMRC Modified Medical Research Council PROM Patient-reported outcome measure PROs Patient-reported outcomes SFTPB Surfactant Protein Bviii SNPs Single nucleotide polymorphisms SpO2% Peripheral oxygen saturation STS Sit to stand USA United States of America
1. INTRODUCTION
_______________________________________
3 Chronic obstructive Pulmonary Disease (COPD) is a major public health problem (1) known to affect 210 million people worldwide(2) and 800.000 in Portugal (3). By 2020 it will be the 3rd
leading cause of mortality accounting already for 3.2 million deaths in 2015(4). Given the substantial and growing economic costs, ascending a more than 38.6 billion of Euros in Europe and 49.9 billion in the USA(5), but also the social burden, significant research efforts have been made in the last decade to enhance our understanding of COPD development, diagnosis, impact and management.
The risk of developing COPD is usually associated to an interaction between genetics and environmental factors(1). Genetic factors have been associated with risk for COPD such as the deficiency of a1-antytripsine (AAT)(6). Nevertheless, this deficiency only affects 1/3 of all COPD cases, thus there has been successive efforts to find other candidate genes that may also be a risk for COPD(7). In the last years, hundreds of studies were conducted in an attempt to find genetic variants in candidate genes associated to the disease pathogenesis, susceptibility and progression. However, these studies have mainly focus on associating these variants with lung function (main criteria for establishing COPD diagnosis), neglecting the impact of this condition on patients. Patient-reported outcomes (PROs) are a set of measures about patients’ health status which are directly reported by the patient. They provide the real perception of the impact of the disease on patients’ life and guide meaningful interventions(8). Nevertheless, associations between genetic variants and PROs have been poorly investigated, as demonstrated in our systematic review conducted within the scope of this dissertation and currently under consideration in PLOSone (Appendix I). If this patient-centered information was to be integrated, a significant knowledge advance would certainly be achieved on our understanding of COPD development, diagnosis and management.
Although significant number of international studies have been conducted to characterise the genetic of these patients, in Portugal, the genetics of COPD is a theme yet to be decoded. Nevertheless, one study has been conducted in Madeira Island to assess the prevalence of the AAT genotypes in young males between 18 and 23 years old and consequently risk for COPD(9).
Therefore, this study aimed to explore associations between specific genetic variants and several clinical measures, some of which PROs of COPD. Additionally, it was also aimed to contribute with an exploratory study for the genotype characterisation of patients with COPD in Portugal.
4
Here, the introduction of this dissertation is presented (chapter 1). Chapter 2 provides a deeper knowledge to the state of the art and is followed by chapter 3 which describes the settings where patients with COPD were contacted and recruited as well as all measures collected and the laboratorial and clinical procedures carried out. Chapter 4 presents the results obtained in the clinical and genetic fields. Finally, chapter 5 presents the discussion about the results obtained and chapter 6 the conclusions and future implications.
2. STATE OF THE ART
_______________________________________________________
7
2.1. Brief overview
Chronic obstructive pulmonary disease (COPD) is one of the deadliest pathologies worldwide. Defined by the Global Initiative for Chronic Obstructive Lung Disease (GOLD) as “common, preventable and treatable disease that is characterized by persistent respiratory symptoms and airflow limitation”(1), COPD accounts for 3.2 million deaths in 2015, which represents an increase of 12% since 1990 (4). It is currently estimated that the observed increase in risk factors such as, aging of the populations (10), and emissions of air pollutants(11), may increase the mortality numbers to 6 millions deaths by 2020(12). In Portugal this disease has a known prevalence of 14%(13), and killed 2365 people in 2013 which corresponded to 20,04% of all deaths caused by respiratory diseases in Portugal(14).
The high prevalence, mortality and morbidity of COPD, makes this disease a major health, economic and social burden. Worldwide between one and thirty thousand dollars are spent every year per patient(15). A substantial portion of these expenses are due to exacerbations, i.e.,” acute worsening of respiratory symptoms that results in additional therapy”(1) . Therefore, early identification of those at risk of developing COPD is nowadays, together with COPD diagnosis and management, a top priority for research.
2.2. Risk Factors
The risk of developing COPD is usually associated to an interaction between genetics and environmental factors(1). Smoking is considered the environmental risk factor most commonly associated with COPD(1). In fact, it has been shown that cigarette smokers usually present more airflow limitations and other abnormalities than non or ex-smokers(16). However, only a small fraction (20%) of smokers develop the disease(7), which suggests that other factors may be involved and contribute to the risk of developing COPD.
Genetic factors have also been considered as a risk for COPD such as the deficiency of a1-antytripsine (AAT)(6). This serine protease plays an important role in the inhibition of the functions of neutrophil elastase in the lungs, but polymorphisms responsible for decreasing the concentrations of AAT in plasma when combined with risk factors may lead to emphysema(17). Nevertheless, this deficiency only affects 1-3% of all COPD cases, thus there has been successive efforts to find other candidate genetic variants with relevance for COPD(7).
Exposure to outdoor and indoor air pollution is also a risk factor to develop COPD(7). It has been shown that exposure to toxicity of particles from outdoor air may play a heavy role in
8
increasing the number of exacerbations in patients with COPD(18). Moreover, the fact that most people spend more hours indoors, makes indoor pollution (vapours, fireplaces) a higher risk factor to develop COPD(1, 7, 19).
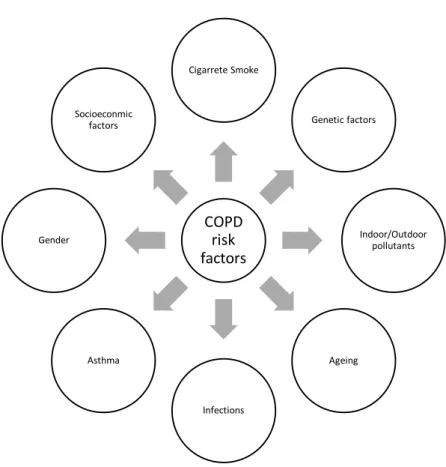
Other risk factors that have been associated to COPD are ageing and gender, asthma, infections in early life, and socioeconomic problems(7). Figure 1 summarises the identified risk factors for developing COPD.
COPD risk factors Cigarrete Smoke Genetic factors Indoor/Outdoor pollutants Ageing Infections Asthma Gender Socioeconmic factors Figure 1- Risk factors for developing Chronic Obstructive Pulmonary. Disease.
9
2.3. Chronic Obstructive Pulmonary Disease and its clinical manifestations
Patients with COPD usually present symptoms as cough, dyspnoea, increased sputum production and wheezing(20). Cough may be the only symptom present in patients and also may be more prominent in the morning. Furthermore, cough is usually accompanied by sputum that usually vary in amount(21). Dyspnoea, which refers to the sensation of breathlessness, is one of the most important and commonly observed symptoms in patients with COPD(22). This symptoms is usually associated with limited physical activity, which may lead to anxious and depressive behaviours(22). Wheezing, is usually described as a noisy breathing and vary between days(21). Additionally, since COPD shares risk factors with other pathologies may lead to a coexistence of this disease with other comorbidities as cardiovascular diseases, obstructive sleep apnoea, diabetes, cachexia or osteoporosis, which may lead to onset of other symptoms (23).
2.4. Disease classification
According to GOLD guidelines(1), diagnosis and assessment of the disease is based on a lung function test, usually performed with spirometry which assesses forced expiratory volume in 1 second (FEV1) and forced vital capacity (FVC). In conjunction with patients’ clinical history, symptoms and exposure to risk factors history assessment, a post-bronchodilator FEV1/FVC inferiorto 0.70 may represent a diagnosis of COPD(20).
In previous versions of GOLD (1), some cut-of values from spirometry test were used as a method to assess the severity of airflow obstruction, which has been divided in four categories (Table 1). Table 1-Global Initiative for Chronic Obstructive Pulmonary Disease classification of airflow limitation severity. Adapted from [1]
GOLD 1 Mild FEV1³80 predicted
GOLD 2 Moderate 50% £FEV1<80% predicted
GOLD 3 Severe 30% £FEV1<50% predicted
10
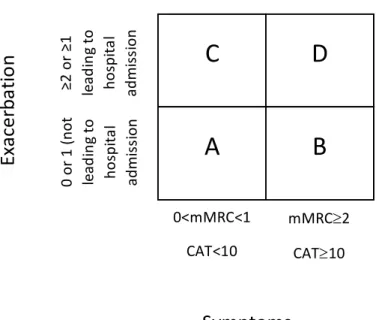
Recently, a new classification for COPD severity was proposed. In addition to the GOLD classification of airflow severity previously referred (GOLD 1,2,3,4), this new classification also takes into account patients-reported outcomes (PROs), i.e., the modified Medical Research Council Dyspnoea Scale (mMRC) and COPD Assessment test (CAT). Thus, four new categories were created: A (patients with mMRC between 0 and 1, CAT score <10 and 0 or 1 exacerbation that not lead to hospital admission), B (patients with mMRC³2, CAT³10 and 0 or 1 exacerbation that not lead to hospital admission), C (patients with mMRC between 0 and 1, CAT<10 and ³2 or ³1 exacerbation that leads to hospital admission) and D (patients with mMRC³2, CAT³10 and ³2 or ³1 exacerbation that leads to hospital admission) (Figure 2)(1).
2.5. Patient-reported outcomes
PROs are a set of measures about patients’ health status which are directly reported by the patient(8). Since the insertion of the new ABCD disease classification based on PROs, a new attention and importance has been given to these outcomes. COPD is a heterogeneous disease, that impacts not only at a pulmonary level, but also at a extrapulmonary level (e.g., muscle strength, balance, quality of life, emotional well-being, among many others)(24). FEV1 is one of the most common lungfunction parameters to assess disease progression and to evaluate treatments, however FEV1 does
C
D
A
B
0<mMRC<1 CAT<10 mMRC³2 CAT³10 0 or 1 (n ot le ad in g to ho spi ta l ad m is si on ≥2 or ≥1 le ad in g to ho spi ta l ad m is si on
Symptoms
Ex
ac
er
ba
tio
n
hi
sto
ry
Figure 2-The Global Initiative for Chronic Obstructive Lung Diseases ABCD assessment. Adapted from (1).
11 not correlate with changes in symptoms, COPD comorbidities or respective consequences that may lead to a decline in the quality of life (24, 25). Additionally, patients with similar FEV1 values may
have different experiences of the disease(25). Thus, the inclusion of PROs measures (PROM) is fundamental to assess patient’s perception and progression of the disease adequately and consequently adapt treatments according to their specific needs.
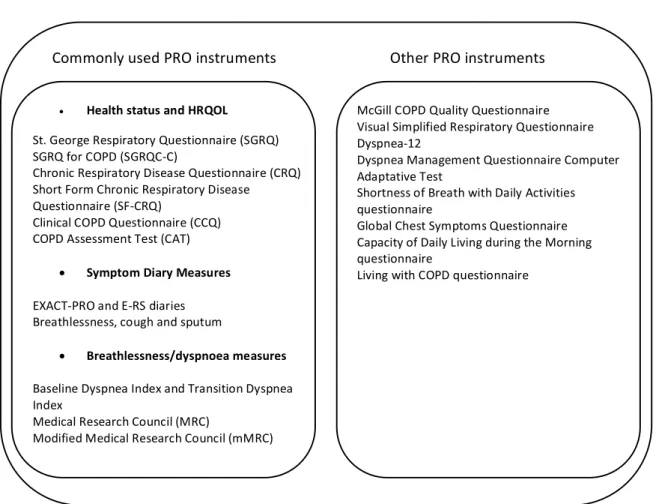
There are already a significant number of valid, reliable and responsive PROM used to assess outcomes of interest as health-related quality of life (HRQOL), self-reported exercise capacity and frequency of exacerbations among others. Additionally, other PROs are being proposed under the scope of COPD which, although some have not yet been validated, do show the increased awareness for this type of measurements to better assess patients with this disease (Figure 3)(24, 25). Figure 3-Commonly used patient-reported outcomes measures in Chronic Obstructive Pulmonary Disease and other patient-reported outcomes used. Adapted from (25).
Commonly used PRO instruments Other PRO instruments • Health status and HRQOL St. George Respiratory Questionnaire (SGRQ) SGRQ for COPD (SGRQC-C) Chronic Respiratory Disease Questionnaire (CRQ) Short Form Chronic Respiratory Disease Questionnaire (SF-CRQ) Clinical COPD Questionnaire (CCQ) COPD Assessment Test (CAT) • Symptom Diary Measures EXACT-PRO and E-RS diaries Breathlessness, cough and sputum • Breathlessness/dyspnoea measures Baseline Dyspnea Index and Transition Dyspnea Index Medical Research Council (MRC) Modified Medical Research Council (mMRC) McGill COPD Quality Questionnaire Visual Simplified Respiratory Questionnaire Dyspnea-12 Dyspnea Management Questionnaire Computer Adaptative Test Shortness of Breath with Daily Activities questionnaire Global Chest Symptoms Questionnaire Capacity of Daily Living during the Morning questionnaire Living with COPD questionnaire
12
2.6. Genetics of Chronic Obstructive Pulmonary Disease
COPD is a multifactorial disease, caused by an association of alleles found in multiple genes, environmental factors and interactions between these two factors. Since the discovery of AAT variants (more than 57 years ago) as a risk factor for COPD, the role of genetics has gained a new attention to understand the onset and evolution of this disease(26). In the last years, hundreds of studies were performed in an attempt to find genetic variants in candidate genes associated to the disease pathogenesis, susceptibility and progression. Single nucleotide polymorphisms (SNPs) are the exchange of single bases at specific positions and are one of the genetic variants most common and studied relative to any pathology. In fact, more than four hundred SNPs in two hundred genes were already associated with COPD in the literature, in different genome-wide association studies (GWAS) (for further information, see genetic variants table in Appendix II). Additionally, with the appearance of DNA genotyping arrays, these genetic variants may be measured more economically and in greater quantity. An array is a container object that may be composed of thousands of specific short fragments of DNA (oligonucleotides) which hybridize with sequences of target DNA being analysed, allowing to genotype thousands of SNPs simultaneously in different patients(27).
Despite all this progress, there are still several problems associated with the genetics of this disease. First, controversial results were being obtained among studies investigating the same specific genetic variant(28). This may be explained by the different populations from different ethnicities being studied, use of small sample sizes or different environments among populations (29, 30). Second, all the efforts of the genetic studies have been concentrated on finding associations between specific genetic variants with lung function or with smoking to enhance our understanding of the susceptibility to the disease(6). However, the association between genetic variants and other important outcomes such as PROs, which provide the real impact and progression of the disease via patients’ perception have been poorly investigated. This has been the theme of our systematic review currently under consideration in PLOSone, which demonstrates the exiguity of data relating genetic factors with PROs in COPD (Appendix I). Therefore, research is needed at a worldwide level to integrate all the important information provided and to enhance our understanding on COPD development, diagnosis and management. In Portugal, the genetics of COPD is a theme yet to be decoded, since only one study was conducted in Madeira Island to assess the prevalence of the AAT genotypes in young males between 18 and 23 years old and consequently risk for COPD(9).
13
2.7. Patient-reported outcomes and genetics
COPD is without doubts a complex and heterogeneous disease, with different morphological manifestations, different comorbidities, that may impact differently on patients at similar grades and may have implications for disease progression and management(31). Thus, personalized and tailored interventions are needed for these patients based not only on patients attributes, but also on biomarkers and other variables(32). In the last years, it has become more evident that there is a strong association between PROs and genetics at different fields(33, 34). PROs are important mainly to assess conditions that only patients may report as pain, fatigue, depression or anxiety however, they are also important to understand the biological pathways associated with this condition(32). In the respiratory field, more precisely in lung cancer, associations between PROs and specific genetic variations have already been demonstrated (35). Thus, by knowing which genetic variant is associated with each PRO, professionals will be able to identify patients genotype that makes them more susceptible to a PRO. With this information, tailored intervention may be applied, which can contribute positively for increasing patients’ quality of life and behavioural changes, resulting in a significant reduction in health care system expenditures (32).2.8. Objectives
The main goal of this masters’ dissertation was to explore associations between specific genetic variants and several clinical measures some of which PROs in patients with COPD. This will allow a better understanding of the susceptibility of these patients to the PROs deficits, predict the disease progression and later inform the development of tailored interventions. Additionally, this dissertation also aimed to contribute for the genetic characterisation of patients with COPD in Portugal, since this theme is still poorly explored.
3. METHODS
________________________________________
17 This study is part of a larger study entitle “GENIAL – Marcadores genéticos e clínicos na trajetória
da DPOC”, funded by Programa Operacional de Competitividade e Internacionalização - COMPETE,
through Fundo Europeu de Desenvolvimento Regional - FEDER (POCI-01-0145-FEDER-016701), Fundação para a Ciência e Tecnologia (PTDC/DTPPIC/2284/2014) and under the project UID/BIM/04501/2013.
3.1. Ethics
Ethical approval was previously obtained from Administração Regional de Saúde Centro (ARS-Centro) (64/2016), from Centro Hospitalar do Baixo Vouga (CHBV) (08-03-17), Hospital Pedro Hispano (10/CE/JAS) and Hospital Distrital da Figueira da Foz. Documents may be consulted at Annex I. Prior to any data collection, written informed consents were collected from patients.
3.2. Design and Participants
A cross-sectional study was conducted in the north and center region of Portugal. Hospitals and Primary Care Centres of Baixo Vouga and Baixo Mondego, Hospital Pedro Hispano and Hospital Distrital da Figueira da Foz were contacted, from which three hospitals and two primary care centres accepted to participate. Patients were eligible if i) diagnosed with COPD according to GOLD criteria(1) ii) presented in a stable state, i.e., no acute exacerbations in the previous month, iii) were able to give informed consent. Exclusion criteria were the presence of severe cardiac, musculoskeletal or neuromuscular diseases, cognitive impairment or a history of neoplasia or immune disease that would interfere with patients’ collaboration in data collection or interpretation. Patients with COPD were recruited from the emergency and internal medicine services of the Centro Hospitalar do Baixo Vouga, Hospital Pedro Hispano, Hospital Distrital da Figueira da Foz or by contacting patients previously informed by the referred institutions. In the hospital services, the physician informed each potential participant about the study. Only patients that showed interest to participate were approached by the researcher to provide more information about the study and ask about their willingness to participate. Patients recruited through telephone calls were informed about the study and if they agreed to participate, they were integrated as stable patients with COPD (stCOPD).
18
3.3. Measures
A structured questionnaire was first used to collect socio-demographic (name, gender, date of birth, address, academic qualifications, marital status and occupation), anthropometric (height, weight, percentage of body fat and body mass index [BMI]) and clinical (smoking habits, comorbidities, medication, home oxygen or ventilation supplies, dyspnoea, hospital admission in the past 3 months/year, exacerbations in the past year and physical activity levels) data in order to characterise the population. This questionnaire was followed by several other measures that are described below.
Dyspnoea. This parameter was assessed using mMRC, a reliable, valid and responsive questionnaire to assess activity limitations due to dyspnoea in patients with chronic respiratory diseases, namely COPD(36, 37). It is composed of 5 statements on a scale from 0 to 4, with higher scores indicating higher respiratory limitation(38).
Dyspnoea and fatigue. The modified Borg scale is a valid, reliable(39) and commonly used tool to assess dyspnoea and fatigue at rest in patients with COPD(40, 41). This is a 0 to 10 rated scale, where the patient points his/her perception of dyspnoea/fatigue(42). The modified Borg scale allows a score interpretation, in which 0 corresponds to an absence of dyspnoea or fatigue and 10 corresponds to patient’s maximum sensation of dyspnoea/fatigue, existing also intermediate options according to patients’ perception of the symptoms(43).
Anxiety and depression. These parameters were assessed using the Portuguese version of the Hospital Anxiety and Depression Scale (HADS)(44). This is reported as a valid and reliable instrument and is commonly used in patients with COPD(45, 46). This scale contains 14 questions, seven questions measuring symptoms of anxiety (HADS-A) and 7 measuring symptoms of depression (HADS-D). Each question has four possible answers ranged from 0 to 3, so the possible scores ranged from 0 (patient has no depression or anxiety) to 21 (maximum depression/anxiety reported by the patient). Scores inferior to 8 were considered “normal values”, between 8 and 10 were interpreted as “mild values”, between 11 and 14 as “moderate values” and between 15 and 21 as “severe values” of anxiety and depression symptoms(44). Impact of COPD. To assess the disease impact on well-being and daily life of participants, the CAT was used(47). This is a simple, reliable, responsiveness and validated test in COPD(47, 48). This scale is composed of 8 questions with 6 options each numbered from 0 to 5 with a maximum score of 40, that intends to explore the impact of COPD on patient’s health status, mainly daily symptoms
19 and other manifestations of the disease(49). Higher scores indicate higher impact of the disease on patients’ life.
Health-related Quality of life. St. George Respiratory Questionnaire (SGRQ)(50) was used to assess health-related quality of life in patients with COPD. This tool is validated and has been consistently used in patients with COPD (51-53). It is composed of 76 items divided in three domains, which measure symptoms, the impact of disease and the activity limitations. The score ranges from 0 to 100, with higher scores indicating poor health-related quality of life (54). Vital signs and oxygen saturation. In order to establish a baseline and monitor the patient, both vital signs and oxygen saturation (SpO2%) were initially assessed. Blood pressure was verified using a portable automatic sphygmomanometer which also provided the heart rate (Medel Elite, S.Polo di Torrile, Italy), SpO2% was monitored using a pulse oximeter (Konica Minolta, Pulsox-300i, United Kingdom), and the respiratory rate was assessed using a stopwatch to monitor the number of respiratory cycles taken in one minute.
Lung function. This was assessed by spirometry (MicroLab 3500, CareFusion, Kent, United Kingdom), a simple and non-invasive test that may identify the presence of obstructive respiratory abnormalities(55). It is valid, reliable and commonly used in the COPD population(56). It was performed according to the current guidelines(57).
Peripheral muscle strength. Muscle dysfunction and poor exercise capacity is one of the biggest concerns in COPD(58). For that reason, quadriceps muscle strength was assessed with a hand-held dynamometer (Hoggan MicroFET2 Muscle Tester, Model 7477, Pro Med Products, Atlanta, GA). This test, previously used in patient with COPD (59), is valid and reliable(60) to assess lower-extremity muscle strength in older adults, similar to the study population. Additionally, the isometric handgrip force was measured with a hydraulic-hand dynamometer (Model 12-0241 Lite, Fabrication Enterprises Inc., White Plains, NY, USA). This is a valid measurement of mobility and quality of life in patients(61).
Respiratory muscle strength. Measurement of static maximum inspiratory pressure (MIP) and maximum expiratory (MEP) pressures are commonly performed in patients with COPD (62, 63) to assess inspiratory/expiratory muscle strength, since respiratory (specially inspiratory) muscle function is frequently altered in these patients(62). MIP and MEP were assessed using respiratory pressure gauge (MicroRPM, CareFusion, Kent, United Kingdom).
20
Functional capacity. Five times sit-to-stand test (5STS) and 1-minute sit-to-stand (STS) were used to assess functional capacity. 5STS and STS test are a reliable, valid and responsive test in patients with COPD. Both tests are commonly used in COPD patients to determine functional state with less stress for the patient comparing with other tests as the 6 minutes walking test for example(64).
Genetic. Oropharyngeal swabs and falcons were used to collect buccal detached cells and saliva respectively.
3.4. Procedures
Assessment sessions took place at the School of Health Sciences, University of Aveiro (ESSUA) in the Respiratory Research and Rehabilitation Laboratory (Lab3R),
participating hospitals or at patient’s home. Initially, a brief description of the study purpose was provided by the researcher and time was given for the participant to read the information sheet, clarify any doubts and sign the informed consent. Then, a code was assigned to each participant, to guarantee the confidentiality of the participation, and socio-demographic, anthropometric and clinical data were collected to characterise the population. Sequentially, questionnaires were completed according to the guidelines and always under supervision of the researcher. Vital signs and SpO2 were measured and dyspnoea/fatigue were quantified using modified Borg scale and mMRC. Participant’s lung function was then assessed (57), and the most frequently measurements considered in spirometry: FVC, FEV1 and FEV1/FVC ratio were registered(55).
Quadriceps muscle strength was assessed based on O’shea protocol (59), where patients were asked to sit on a chair with the knee flexed 70°. The hand-held dynamometer was placed in the anterior tibia region, 5 cm above the lateral malleolus from the dominant lower limb and the patient was instructed to stretch the knee over a 4-second period against the resistance applied (Figure 4). This process was repeated 3 times with a recovery period of 30 seconds to avoid fatigue and the best result was recorded(59).
21
Additionally, the isometric handgrip force was also assessed according to international recommendations(65).Strength was assessed at the dominant hand with the elbow 90º flexion. Three attempts were performed and the highest value was taken.
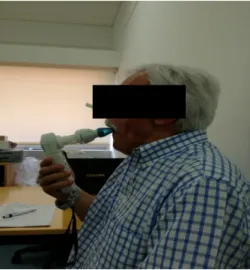
Respiratory muscle strength assessment was performed as previously described (62), with some minor alterations. In a first step, all the procedure was demonstrated to the patient using a spare mouthpiece. Starting with MIP, firstly patients were instructed to sit on a chair in the upright position. Then a nasal clip was placed in patients’ nose to guarantee that there was no air lost through the nasal passages. After this, with the mouth out of the rubber buccal, patients were asked to expire as slowly as possible and when there was no more air to expire, patients were instructed to put their mouth in the buccal and inspire as fast and intense as possible. MEP was exactly the reverse process. Once again with a nasal clip in patients’ nose, they were asked to inspire in a slow and relaxed way with the mouth outside of the buccal. When there was no more air to inspire, patients were instructed to put the buccal in the mouth and to expire as fast as possible (Figure 5). For both cases, three trials were performed with rest periods of 30 seconds between trials. The best MIP and MEP values from the three trials were registered.
Figure 4- Test of quadriceps muscle strength using
22 Functional muscle strength was then assessed with the 5STS and 1 minute STS (66). Patients were asked to sit on a chair (floor to seat height 48 cm) well stabilized against the wall and with upper limbs across the chest and knees and hips flexed to 90°. Then patients were asked to stand up and sit down 5 times as fast as possible with the arms crossed on their chest. The duration of each test was timed with a stopwatch, that started on the command “go”, and stopped at the fifth sit-to-stand repetition. 1 minute STS was performed as reported for 5STS but with the arms along the body, and in this test the stopwatch started on the command “go”, the patient performed the manoeuvre sit-to-stand-to-sit as fast as possible for 1 minute. Time for rest was provided between repetitions and tests to restore basal vital signs, SpO2%, dyspnoea and fatigue values according to participant’s need in both tests. Oropharyngeal swabs and falcons with saliva were collected from each participant in order to extract DNA for genetic analysis. For both cases, specific precautions were taken during this procedure to avoid contamination of the samples. Patients were advised to avoid ingestion of any acidic substances, aliments rich in sugar or in caffeine, before data collection since these can cause changes in the saliva pH and lead to increased bacterial development. Patients were also advised to mouthwash with water 10 minutes before the sample collection to minimise the presence of food particles and any modification in saliva pH(67). Additional care was taken to avoid the swab touching in any other surface other than the patient’s mouth, to prevent any contamination. Swabs were scrapped inside the participant’s mouth during 30 seconds with rotational movements, taking into account the care referred above(67) and patients were asked to spit several times into the Figure 5- Initial position of the maximal inspiratory/expiratory pressure.
23 falcons during the entire protocol. Once finished the collection, the swabs and falcons were properly labelled, transported in portable freezers to the Institute for Research in Biomedicine (iBiMED) where were preserved in freezers at -80ºC.
3.5. Data analysis
3.5.1. Sample analysis3.5.1.1 DNA extraction
Prior to manipulation, samples were unfrozen at room temperature. Total DNA was extracted using QIAamp DNA mini kit (Qiagen, Hilden, Germany) following the manufacturer’s instructions, with slight modifications.
Before the beginning of the extraction, all samples and reagents were at room temperature. First, 20 μl of Qiagen proteinase K was pipetted into two 1.5 ml microtubes. Then 200 μl of saliva was added followed by 200 μl of buffer AL to lysis cells. To ensure an efficient lysis, both microtubes with the samples and buffer AL were mixed by vortexing for 30 seconds and incubated at 56 °C for 10 minutes. After incubation, samples were briefly spinned to remove drops produced by the condensation. In order to precipitate DNA, 200 μl of 100% ethanol were added to both microtubes followed by a 15 seconds vortexing and spinning to remove droplets. Afterwards, the mixture of both microtubes was carefully applied in a QIAamp Mini spin column. The column was washed with both washing buffers: AW1 and AW2. Finally, the DNA was eluted with 200 μl of milli Q water, incubated at room temperature (15-25 °C) for 10 minutes to assure a efficient elution and the final extract was obtained by centrifugation at 6000 g for 1 minute. All samples were stored at -20 °C. 3.5.1.2. DNA quantification The concentration of DNA samples was measured by two methods, absorbance and a fluorimetric method. Absorbance measurements were performed using Denovix DS-11 FX+ spectrophotometer. 1 μl of mili Q water was used as a blank. The same volume of sample used to obtain concentration and absorbance ratios values (A260/A280 and A260/A230).
24
To ensure an accurate quantification process, the amount of recovered DNA was quantified by using a Qubit dsDNA BR assay kit (Life technologies), a fluorimetric method, according to the manufacturer’s instructions (Life technologies Cat# Q32850, Q32853). First, to obtain the optimal performance of the reagents, these were placed at room temperature before the beginning of the process. Qubit working solution was prepared by diluting 1 μl of Qubit dsDNA BR reagent in 199 μl of Qubit dsDNA BR buffer for each sample/standard. Each standard and sample requires 190 μl and 199 μl of Qubit working solution respectively so, enough Qubit working solution must be prepared for 2 standards and the number of samples to be analysed. To prepare the two standards, 190 μl of Qubit working solution was added to each tube. Then 10 μl of each Qubit standard was added to both tubes followed by a vortex during 3 seconds. This process was carefully conducted to prevent the creation of bubbles that may influence the process.
Each sample was prepared adding 199 μl of Qubit working solution and 1 μl of the previously vortexed sample. Both tubes (samples) were vortexed by 3 seconds, and then were incubated at room temperature for 2 minutes to allow the Qubit assay to reach optimal fluorescence. The Broad Range Assay programme was chosen and reading process started with Qubit fluorometer calibration. In this phase standard 1 and standard 2 were read and a line corresponding to the curve-fitting algorithm was constructed. Then, each sample was read and the corresponding yields values were registered. 3.5.1.3. DNA integrity In order to assess the DNA samples integrity and degradation, a 1% agarose gel was conducted based on Lee et al(68). In a first step 0.5 g of agarose was placed in a flask containing 50 ml of TAE 1× running buffer. Then, to dissolve the mixture was heated until the agarose was totally dissolved. To detect nucleic acids in the agarose gel, 3 μl of GreenSafe Premium was added to mixture. This nucleic acid stain emits green fluorescence(68) when bounded to DNA. Finally, the agarose gel was placed to cool during 10 minutes before being placed in the gel tray previously levelled. In order to allow a visual tracking of DNA migration during electrophoresis, loading dye 6× was added to the samples. Running buffer TAE 1× was added until the surface of the gel was
25 covered and the loading process was ready to be started. The first well was carefully loaded with GeneRuler 1kb DNA Ladder, which is composed of DNA fragments ranging from 250 to 10 000 bp to allow for DNA sizing. Samples were slowly loaded in the other wells. With the sample loading process completed, the lid was closed and the leads of the gel box were attached to the power supply programmed with a voltage of 120 V and the gel was run for 30 minutes.
Images of the final gel were obtained using a GelDoc XR+ Imaging System (Bio-Rad Laboratories, Hercules, CA).
3.5.1.4. DNA samples SpeedVac
DNA samples extracted were concentrated in a speed vacuum (ScanSpeed MaxiVac,
Labogene, Denmark),in order to achieve the concentration values requested for the genotyping analysis institute (minimum sample concentration of 60 ng/μl; A260/280 ratio between 1.8 and 2; A260/230 ratio between 1.7 and 2). Each sample was placed on the speed vacuum rotor in counter balanced positions with the lid open. Then, the rotor was programmed for 30 minutes. Temperature and rotation led to water evaporation resulting in a less diluted DNA. However, to avoid sample degradation, at the end of 30 minutes, samples were placed on ice for 10 minutes, and then the process was repeated. Finally, DNA concentration and A260/280; A260/230 ratios were measured using DenoVix D-11. 3.5.1.5. Array genotyping
To provide a comprehensive understanding of which specific genetic variants were significantly associated with PROs, a systematic review was conducted (Appendix I). Additionally, it was important to find all the genetic variants associated with COPD in the literature and whether of these may also be associated with PROs . Thus, a targeted gene sequencing panel (Appendix II) was constructed based on a databases review. Since the DNA microarray technology is not yet available at iBiMED, we decided to use the Infinium Global Screening Array-24 v1.0 from Illumina (Illumina, San Diego, CA, USA). This is an array mainly used for population studies where genotyping is required and, therefore, is expected to produce a good genetic stratification of our patients, that can be later connected to COPD
26 outcomes. To run these samples, we have chosen the laboratory of Life & Brain GmbH institute, Germany. This laboratory has plenty experience on the array and has been recommended by the Illumina dealer in Portugal (ILC, Portugal). According to the respective literature, Infinium Global Screening array was based on Illumina Infinium HTS Assay protocol, which is composed of nine steps: 1) DNA amplification; 2) DNA incubation; 3) DNA fragmentation; 4) DNA precipitation; 5) DNA resuspension; 6) Hybridiation to BeadChip; 7) BeadChip washing; 8) Extend and stain the BeadChip and 9) Image BeadChip. In the first stage, samples were denaturated with sodium hydroxide and neutralized with the reagent “Multi-amplification 2 mix”, followed by an incubation (step 2) with a time range of 20/24 hours at 37ºC. In this step, genomic DNA was amplified, resulting in a sufficient quantity of DNA to the entire process. Then, an enzymatic-based fragmentation occurred using a fragmentation solution. To avoid an excess of fragmentation, an end-point was used. DNA was then precipitated with isopropanol. DNA is less soluble in solutions with isopropanol, facilitating the precipitation process(69). Finally, samples were resuspended in hybridization and washing buffer (step 6), genomic DNA was dispensed onto BeadChips. The loaded BeadChip was incubated overnight until efficient annealing. In the next phase, the BeadChip was washed to remove non-connected or unhybridized primers (step 7) and was prepared to be stained and extended (step 8). In this last step, detectable labels were incorporated on the BeadChip. Finally, with the micro-array Hi-scan, a laser was used to excite the fluorophore, and to read the different colours, according to the probe. All information was provided as files from the GenomeStudio software (Illumina, San Diego, CA, USA), which included all the basic information about the genotyping conditions (replication errors, call frequencies) and the genotypes and genotypes frequencies for each SNP for all the population. 3.5.2. Statistical analysis A code was attributed to each participant and data was analyzed anonymously. Data was analyzed using IBM Statistics version 23 (SPSS Inc., Chicago, Illinois, IL). Descriptive statistics was used to describe socio-demographic and clinical outcomes. Continuous data (age, spirometry test, MIP/MEP, quadriceps muscle strength, handgrip, and 5STS) was described as mean ± standard deviation, ordinal data (frequency of exacerbations, mMRC, dyspnoea and fatigue scores from Borg scale, anxiety and depression scores from HADS, CAT scores and 1 minute STS results)
27 was described as median and interquartile range and categorical data (gender, Gold classification and smoking status) was described as percentages and frequencies.
One-way ANOVA test was used to compare mean values of continuous measures (spirometry, SGRQ, MIP, MEP, quadriceps muscle strength, handgrip muscle strength, 5STS) between genotypes of each SNP assessed. When significant differences were obtained, Bonferroni correction test was used for multiple comparisons with a level of significance of p<0.05.
Kruskal Wallis non-parametric test was used to compare ordinal/categorical non-normally distributed data among groups (frequency of exacerbations, mMRC, Borg scale, HADS, CAT and 1 minute STS). When significant differences were verified, Mann-Whitney U test was used for multiple comparisons. Bonferroni corrections were applied for the number of comparisons performed per SNP (i.e., 3 comparisons) between outcomes. Thus, the level of significance was set at 0.017.
Genotypes characteristics (genotype frequencies, call frequencies and number of calls) were assessed using GenomeStudio software (Illumina, San Diego, CA, USA) and graphs were plotted in GraphPad Prism 5 (GraphPad Software, La Jolla, CA, USA).
4. RESULTS
________________________________________
31