Copyright © 2018 (Jorge Martins Rosa, Janna Joceli Omena, Daniel Cardoso). Licensed under the Creative Commons Attribution-NonCommercial
Generic (cc by-nc). Available at http://obs.obercom.pt.
Watchdogs in the Social Network: A Polarized Perception?
Jorge Martins Rosa*, Janna Joceli Omena**, Daniel Cardoso*** *Assistant Professor, ICNOVA, NOVA FCSH
**Doctoral candidate in Digital Media, iNova Media Lab/ICNOVA, NOVA FCSH ***Assistant Professor, CICANT, ECATI-ULHT and NOVA FCSH
Abstract
Created in the end of 2015 and currently approaching the mark of 200 thousand followers, the Facebook page “Os Truques da Imprensa Portuguesa” [The Tricks of the Portuguese Press] posts critical remarks on the news of national media and their supposed editorial criteria. The page has often generated heated debates on the platform, either being praised for its role as a watchdog, or discredited as allegedly serving as the spokesperson for a hidden political agenda. Until recently, the anonymity of their writers was one of the arguments for this accusation, but when the identity of one of the admins was disclosed, promptly followed by the self-disclosure of both, this premise was rebutted.
This paper is focused on the reactions to the post on July 9th 2017 in which the admins revealed their names. Our goal is to evaluate the debate generated by this post, in particular concerning the polarization of positions and arguments among those that engaged with the post. To this end, we conduct a mostly exploratory research supported by visual network analysis and textual analysis. We first provide a global characterization of the page, and subsequently present some insights on the revealing post advanced by visual network analysis. Lastly, we look into textual content considering the “global mindset” of the discussion (topics, subtopics, and positionings for and against the page or the post), looking for eventual differences between the subsets of more active and less active commenters. We conclude that the engagement with the post (especially comments) was less polarized than expected, although with one notable exception, and that the relevance of the post rested more in its potential to fuel the debate around contemporary changes and practices in journalism and its multiple dimensions than in the positionings themselves.
Keywords: Facebook Pages, Engagement, Visual Network Analysis, Textual Analysis, Journalism
“Os Truques da Imprensa Portuguesa” [The Tricks of the Portuguese Press; hereafter, also TIP] is a Facebook page that posts critical remarks on several news published by national media, drawing attention to the way the news piece is presented and to what the contributors assume as the editorial criteria behind it1. Created in the end of 2015 and currently approaching 200 thousand followers2, the page has often generated heated debates on the platform, either being praised for its role as a watchdog, or discredited as allegedly serving as the spokesperson for a hidden political agenda. Until recently, the anonymity of their writers was one of the strongest arguments for this accusation, but when the identity of one of the admins was disclosed, promptly followed by the self-disclosure of both while the page kept its activity, the premise was apparently rebutted.
Its “no man’s land” status as neither an official organization with clear goals nor (at least from the audience’s point of view) a mere individual and idiosyncratic crusade, allied with the fast growth of their potential
1 In their “About” section, we can read: “Esta é uma página comunitária que visa denunciar os truques da imprensa
portuguesa. Não fazemos generalizações!” [“This is a community page aimed at informing against the tricks of the
Portuguese press. We do not make generalizations!”] Cf.
https://www.facebook.com/pg/ostruques/about/?ref=page_internal
audience3 and with a perceived predominance of politically charged issues4, makes “Os Truques da Imprensa Portuguesa” a particularly relevant case study on how online social networking platforms – or at least Facebook5 – are able to engage their users into the discussion of current themes in the news agenda. That relevance is also reinforced by the page’s focus on the topical contemporary debate on the decline of journalism in the networked society. Our presupposition, to be confirmed below, is that the role of the page is materialized by the diverse ways to interact with it, from less committed engagement in the form of likes or other reactions to a more dialogical involvement, and as such it can be measured and analyzed. With this paper, our goal is to evaluate, through a mostly exploratory research supported by visual network analysis and textual analysis, the debate generated by the post on July 9th 2017 in which the admins revealed their names. Our focus will be on the polarization of positions and arguments between supporters and detractors (of the page and/or of that specific post). Of particular interest will be also the assessment of eventual differences between the subsets of more active and less active commenters. After a description of the page’s activity, this study will analyze the reactions to that post. Contrary to the authors initial expectations, the reactions were less polarized than expected, although with one exception, relevant because it concerns the criticism about the TIP page itself and its role in the media ecosystem.
State of the art
With the consolidation of the Internet as an omnipresent technology, the epistemic and operative relevance of the concept of network is also experiencing a renewed interest as “a mode of inquiry”, as Bruno Latour, himself critical of purely quantitative approaches, has underlined (Latour, 2011, p. 799). This interest has been highly potentiated in the last decade, with the emergence and increasing popularity (to say the least) of online platforms for communication and exchange, such as Facebook or Twitter, structured themselves as networks (primarily of people) inside the physical and informational networks of the Internet and the World Wide Web. While commonly known as “social network sites” [SNS] (cf. boyd & Ellison, 2007 for the most consensual and most quoted definition), more recent proposals (e.g., Gillespie, 2010; Helmond, 2015) prefer to designate them as “platforms”, a name that brings to the fore features such as their role as mediators, both for interaction and for research, their programmability (e.g. through APIs) and interoperability, and the fact that they lack neutrality. Such will also be our favored term.
While we may skip, due to their wider scope, contributions such as Manuel Castells’ concept of “networked society” or the formal approach of mathematicians as Barabási, one particular offspring of this “network turn”, Digital Methods, proposed by Richard Rogers (2013), is of primary interest for our purposes, as it enables the usage of platform data and the medium itself for social and cultural research within the Internet, in this case to be enriched with more classical tools such as Computer Assisted Qualitative Data AnalysiS (CAQDAS).
3 Expressed as the number of likes or followers. Potential because those numbers do not necessarily translate into actual
readers; our characterization of the page’s activity, below, will address this issue.
4 Or sometimes a political interpretation of issues not primarily framed as such.
5 TIP also has a Twitter page, at https://twitter.com/ostruques and with the handle @ostruques, that mostly replicates
the Facebook posts. Though it also generates some debate, the authors have considered it beyond the scope of this paper.
Abstracting for a moment from strict network analysis, the bulk of academic work on SNS published so far deals with the presentation of the self, along with related issues such as privacy (cf. Wilson et al., 2012) or with how effective those platforms can be as marketing tools (e.g. Watts & Dodds, 2007). Some relevant literature can however be found regarding their potential for the expression and discussion of political issues. On this matter, the reports of the Pew Research Center (e.g. 2011, 2016) are indispensable for an understanding of the dynamics between the citizens and their representatives, mediated or not by these platforms, while accounts of the now popular notions of “echo chambers” or “filter bubbles” can be found as early as 2007 (Dahlberg, 2007). Focused solely on the dominant platform that is Facebook, Williams & Gulati (2012) looked at its adoption by candidates in the congressional elections of 2006 and 2008. Even more relevant for our purposes are studies dedicated to the usage of these platforms as levers for political discussion, participation, and even outright activism. On this regard, Tufekci (2014) and Zuckerman (2014), inspired by a previous taxonomy by Charles Tilly (2004), propose a useful opposition between “thin” and “thick” engagement. The former may be roughly identified with the public display of a commitment with a political or social cause, with the latter implying more substantial forms of action, such as petitions, public protests, etc. (cf. on this regard, Tufekci & Wilson, 2012).
But while the usage of social media corresponds most of the time to merely a “thin” engagement, that must not be disregarded as a weaker form of participation, even less if we consider that web platforms do not exist solely for promoting “offline” events and recruiting users to attend them6. They are, most of all, vehicles of communication, enabling the expression of opinions, the debate (be it purely rational or tainted by emotions or prejudices), and, from a research perspective, the identification of more general trends (which is precisely our epistemic and methodological placement in this study) eventually leading to the understanding of their role as technocultural constructs – which falls outside the scope of this paper. The proposal of visual network analysis, led by Tommaso Venturini and colleagues (2015; 2017), offers “an exploratory expedition – where meanings and findings are progressively and hermeneutically generated” (2017, p. 5). Visual network analysis has little relation with the adoption of statistical metrics, but is rooted in the visual affordances of the network, such as node position, size and hue. The position of nodes and edges within the network, tightly connected with the choice of force-driven algorithms, is a “reliable proxy of the mathematical structure of the graph” (Venturini et al., 2017, p. 3)7. In these family of algorithms “spatial distance becomes meaningful”8 for the scrutiny of networks, conducting thus more intuitive spatial metaphors, and less computational and statistical metrics (Venturini et al., 2017).
As an illustration of how visual network analysis, along with other related approaches from Digital Methods, can bring distinct insights from more established methodologies such as content analysis, a comparison
6 The 2015 protests in Brazil have been analyzed from this perspective. Cf., for example, Omena & Rosa, 2017. 7 In order to understand the “force-directed spatialization” that we adopt in this article, and proposed by Venturini and
colleagues (Venturini et al., 2017), the authors suggest that we should know better how space is defined in traditional geographical representation and Cartesian diagram (e.g. scatterplots). In both cases “the space is defined a priori by the way the horizontal and vertical axes are constructed. Points are projected in such pre-existing space according to a set of rules that assign a univocal position to a pair of coordinates” (2017, p. 3) . Meanwhile, “the space of networks is relative rather than absolute (it can be rotated or mirrored without distortion of information”, in other words, the space is thus “a consequence and not a condition of element positioning” (idem).
8The force driven algorithms not only minimize edge crossing, but mainly work under the logic of repulsive and attractive
forces – the position of each node will depend on the position of the other nodes and the density of their connections (see Fruchterman & Reingold, 1991; Jacomy et al., 2014). For instance, in a user-post network of Facebook, the node position of those users who have interacted more with a particular post will be closer to the node that represents that post. Below, in the analysis section, this feature will be illustrated.
between “How the Facebook Arabic Page ‘We Are All Khaled Said’ Helped Promote the Egyptian Revolution” (Alaimo, 2015) and “Data Critique and Analytical Opportunities for Very Large Facebook Pages: Lessons Learned from Exploring ‘We are all Khaled Said’” (Rieder et al., 2015) is revealing. As the latter paper warns, “For many projects studying online activity, in particular those following a classic waterfall-type research protocol where the inquiry starts with a precise research question and methods are designed in accordance, data collection through APIs will thus not be a workable option, or at least not without additional data gathered through other means such as questionnaires.
This is one of the reasons why social media data analysis at this stage often deviates from what statistician John Tukey called ‘confirmatory data analysis’, or basically hypothesis testing, to engage in ‘exploratory data analysis’.” (Rieder et al., 2015, p. 9) Being aware of those limitations, but above all of the affordances allowed by the technique of visual network exploration, we intend to shed light on the ways the users of the page “Os Truques da Imprensa Portuguesa” respond to the posts; to be more specific, allowing a more robust understanding of the way they interacted with the post we have selected for analysis (cf. below for justification).
The complementary method for our research is content analysis, or to be more precise Computer Assisted Qualitative Data AnalysiS [CAQDAS], as described in manuals as the one by Silverman & Marvasti (2008). We deployed NVivo 11 to run the analysis, approaching the dataset inductively. This means that codes were derived from an initial approach to the existing material, rather than from pre-defined categories. This allows for the emergent topics to become manifest in the coding, and prevents the established theoretical knowledge from opening up the analysis to new data.
Data collection protocol and methodology
The data collection process took place between August and September 2017. Through the Netvizz application (cf. Rieder, 2013) we were able to access detailed information on the page activity (e.g. engagement metrics, image URL, post type, comments), the user-post bipartite graph, and all image URLs from the page’s “Timeline Photos” album. The composition of our final dataset was thus afforded by three Netvizz modules: “Page Data”, “Page Like Network”, and “Page Timeline Images”9. The data was cumulatively gathered as the authors acknowledged, while the research evolved, the need for more diverse raw data or data structured in distinct forms10. Gephi, an open-source desktop application, was used to conduct the technique of visual network exploration.
9 It is important to mention that with the closure of the Facebook API in May 2018, more precisely after the Cambridge
Analytica scandal, the platform imposed restrictions in a series of data points. Additionally, apps’ developers had to respond to Facebook Request for Information (a questionnaire concerning the development of applications, and the use and sharing of Facebook data). That is to say, part of the page data collected for the purpose of this article is no longer available. For instance, users can no longer be distinguished in comments files, and the visualization of the user-post bipartite graph is no longer available.
10 While this may lead to slight discrepancies in some metrics – e.g., added or deleted likes and comments – it is our
belief that those are residual both in the quantitative and in the qualitative sense, and therefore do not alter in any way the main insights, results and trends.
To obtain the timeline photos, we resorted to “DownThemAll!”, a Firefox extension that downloads batches of online images given their URL (which we had from the corresponding Netvizz module), and these were then fed into Image Sorter, a desktop application that allows their sorting by color, among other criteria (e.g. date, name, and size). For text analysis we relied on NVivo 11, which made content coding easier to perform, analyze, correlate and visualize, but also on the Textanalysis tool11, which provides statistics on emojis and bigram frequencies. We first did an overview of the comments to create a few raw codings, which were then organized into themes and subthemes. The thematic tree was created by discussing the codes and the comments associated to them iteratively, until consensus was reached. Codes that were redundant were merged and rechecked. By using the data from Netvizz about which users constituted the center of the network, and running that through a Python script that compared the anonymized unique IDs of those users against the list of users who had posted on the thread, comments on NVivo were classified into “center” and “periphery”, so that differences in commenting themes could be verified. Due to the amount of comments involved in the analyzed thread (see more details in section ”Looking at the outlier”), only about half of the comments collected were content coded, as data saturation had been reached before that, which was established by assessing the changes in results as each batch of 100 comments was coded and noting that there were no significant changes.
Global characterization of the page
The page had, at the time of data collection, 170916 followers12, a relevant amount considering the size of the Portuguese population and that its content, as we will confirm below, targets Portuguese citizens (living in the country or abroad) and other people living in the country. As a comparison, official pages of communications providers (NOS, Vodafone, Meo) have between 1 million and 1.4 million followers; main generalist TV channels (RTP, SIC, TVI) have between half a million and 1 million followers; main daily newspapers (Diário de Notícias, Público, Correio da Manhã, Jornal de Notícias) have between 1 and 2 million, while weekly newspapers (Expresso, Visão, Jornal Económico) have approximately half of these followers. The dataset indicates that 154889 of the 170916 followers are from Portugal. Right after this (predictable) lead, a still significant amount of followers (i.e. between 1000 and 3000) come from Portuguese-speaking countries (Brazil and Angola) or from European countries commonly associated with Portuguese emigration (Switzerland, France, Great Britain). We can thus safely claim that not only it is a page aimed at a national audience but, effectively, that is their audience.
Page-like network
Although Facebook does not enforce and barely stimulates13 the connectivity between pages, the fact that it allows this specific type of connection (i.e., besides the individual profiles, a page can be liked by any
11 Developed by Bernhard Rieder and released in 2018. It is available at http://labs.polsys.net/tools/textanalysis/ 12 Number of likes and number of followers are different metrics, but in this global characterization accurate numbers are
not needed; only a general feeling of scale.
13 In recent times, Facebook has been suggesting to the creators of groups that these may be connected to other groups,
other page) is a good – even if not highly reliable – indicator of the interests of the page administrators, or, to be more precise, of how they may use that affordance as an additional way to build the page’s identity. In the case of “Os Truques da Imprensa Portuguesa”, what can be observed with the Netvizz module that renders the page-like network14 is predictable: given that their goal is to comment on national news media, those constitute the bulk of the network. TIP follows the institutional pages of eight of the main national-wide news media – Correio da Manhã, Observador, Expresso, Público, Diário de Notícias, RTP (but also RTP1, one of the channels) and SIC Notícias – though it does fail to follow many others (e.g., TVI, Visão,
Jornal de Notícias are remarkable gaps). The exceptions to this rule are a program of another national TV channel (RTP3) about photography and called “Fotobox” (actually the most unexpected of all items), a political humor page that also comments on events and their media coverage, “Jovem Conservador de Direita” [Young Right-Wing Conservative], and “Mulher Não Entra” [Women not Allowed15], a feminist activist page that draws attention to all kinds of public situations where an uneven gender distribution can be found.
In the case of news media, it is hardly a surprise that none of their official pages follows TIP back. More striking (though not particularly relevant for our study) is the fact that they do not follow each other, except when part of the same media group (Expresso and SIC Notícias, both from Impresa; RTP and RTP1, the former being the group page itself – the national public funded radio and television – and the latter the main TV channel16).
What and how does the TIP page post? Post types: Screenshots as the basic tenet
Also deserving a close observation is the modus operandi of the page concerning the frequency and the typology of their posts. Given the types of posts allowed by Facebook – status (text only, with or without additional formatting), photo (i.e., all kinds of images), video and link17 – a scroll through TIP’s timeline reveals that they make almost only status posts and, even more frequently, image posts.
The total amount of images, 1861, is impressive, and more so if we compute the daily average. Between October 8th 2015 (date of the first posted image) and August 8th 2017 (date of retrieval) we have 671 days, averaging 2.77 image posts per day, a number to be cross-checked below with the average daily number of total posts (regardless of type).
14 The page like network (or a depiction of Page Community) is a graph representing the connections among Facebook
pages, which is only possible through the act of like. Netvizz offers three levels of crawl depth: (0) connections only between the seeds (one or more selected pages); (1) connections made by the seed(s), and (2) the pages liked by seed(s).
15 Or “The Fellers”, given the inspiration on Tubby Tompkins’ boys-only club on Little Lulu’s comics.
16 While Netvizz allows, besides a "depth 1" network (pages who like or are liked by page X), an additional depth, that
would have in this case led us to irrelevant results. There are two reasons for that, being one of them the fact that Portuguese news media pages rarely follow each other. Besides, as our preliminary tests have shown, the amount and the diversity of pages that do follow news media verges on the border of entropy.
17 “Link” is somewhat misleading, because it includes also URL pointers to YouTube or Vimeo videos, or to animated GIF
sharing sites. These are not considered by Facebook as “true” videos or images, which are only those that must be uploaded to the platform by the user.
What images are these, and what can they tell us? Rich insights into TIP´s visual representation can be provided by the plotting of images according to their features. As mentioned in the “Data collection protocol” section, these images were organized with the help of ImageSorter. By applying the criterion of color patterns18, we were able to understand the visual dynamic of TIP´s publications, their visual aesthetic imprinted over time and, as we will see in a moment, their preference for screenshots.
Images 1, 2 and 3: The imagery of “Os Truques da Imprensa Portuguesa”: plotting Facebook Page
timeline images to detect TIP’s visual representation
The found patterns are revealing, due to their coherence. Images with a predominance of red and blue are mostly screenshots of TV news programs; red and white areas reveal a prevalence of screenshots of online editions of Público, Correio da Manhã and the sports newspaper Record (which have these colors in their palette); blue and white are screenshots of Expresso, Jornal de Notícias, Observador, and RTP; white areas
tend to be of their own Facebook posts. Covers of newspapers and magazines occupy a small but recognizable area. There is also a large area of images with portraits of public figures (mostly politicians, celebrities, and football players), in the same case illustrating online news pieces. While this is not an exhaustive description – there is, for example, a grey and white area with images created by the page (grey background, white text, occasionally their logo) – a global pattern quickly emerges. What we have is
18 Though this property may be considered a less sophisticated way to classify images than, for example, face recognition,
the arrangement by hue, to which we must add the affordance of zooming, enabled an easy human identification of global visual patterns. While there are other image classification tools, such as Google Cloud Vision API, its features were beyond what was intended for our purposes.
predominantly screenshots of individual news pieces (title, lead, legend, protagonist, etc.) that the textual part of the post tries to “deconstruct”, thus fulfilling the page’s self-declared mission as watchdog of the Portuguese media19.
One hypothetical explanation for this behavior is as follows. The contents of a webpage change frequently, URLs occasionally become “dead”, TV programs are something even more ephemeral, most of the times lacking an online version for asynchronous replay. A screenshot, on the other hand, is something in control of those that capture it, making it easier to be in charge of what is published and to show (and allegedly prove) what is being deconstructed, despite the fact that copyright claims and requests for removal can still be made.
Global posting and engagement trends: comments as a rule
Our first data collection with the module for page data gathered the page’s activity during a year; to be more precise, covering the period from August 1st 2016 (roughly 11 months prior to that post) to July 31st 2017.
1908 items were posted during this period, with a remarkable regularity – only 5 days with zero posts, and no consecutive days without posts – and averaging 5.23 posts per day. A monthly breakdown reveals that nevertheless that this was not uniform: January (with an average of 6.67 daily posts) and February (with 6.14) were the months with more activity; October (averaging 3.54 daily posts) and June (3.87) were the less active ones, but still keeping a regular activity. That regularity in spite of high variation can be confirmed by changing the scale from monthly average to daily posts, where the amplitude ranges from zero posts (5 days) to a peak of 14 in only one day (May 17th, 2017). Being outside the scope of this research, the authors do not propose any explanatory hypothesis for the monthly variability of posts.
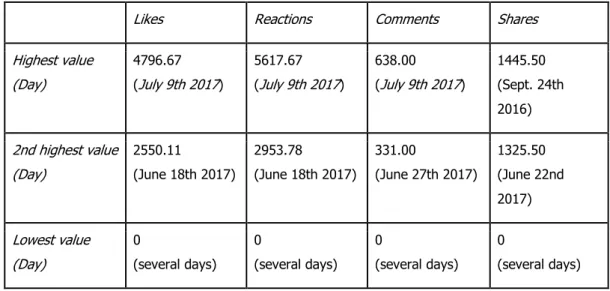
The same cannot be said about the reactions of the followers, where a high deviation is the rule. Being easier, in this specific case, to work with the Netvizz-generated TAB file that outputs daily metrics instead of the more granular one with with all metrics by post20, and as a quick way to standardize engagement metrics between days with more and with less activity from the page, the following table presents averages by post by day.
19 Cf. note 1.
Table 1: Highest and lowest values of engagement with TIP’s page between August 1st 2016 and July
31st 2017. Averages by post by day
Likes Reactions Comments Shares Highest value (Day) 4796.67 (July 9th 2017) 5617.67 (July 9th 2017) 638.00 (July 9th 2017) 1445.50 (Sept. 24th 2016) 2nd highest value (Day) 2550.11 (June 18th 2017) 2953.78 (June 18th 2017) 331.00 (June 27th 2017) 1325.50 (June 22nd 2017) Lowest value (Day) 0 (several days) 0 (several days) 0 (several days) 0 (several days)
Image 4: The users reactions overtime according to the total number of comments
As Table 1 clearly shows and the graphic (Image 4) confirms, July 9th 2017 was an outlier for “likes”, “reactions” and “comments”, roughly doubling these metrics’ engagement when compared with the day with the second highest value. The only exception is the average of “shares”, in which case this day comes only in fifth place (with an average of 615.00). Thus, and for the moment admitting that the post of that very same day in which the page admins disclose their names may not be the responsible for this anomalous engagement, we have at least “locked our targets”.
The outlier
As an intermediate step approaching that atypical day that was July 9th, we zoom in to a more detailed analysis of the page’s activity between July 8th and July 12th, i.e., the day immediately before, and those of the aftermath.
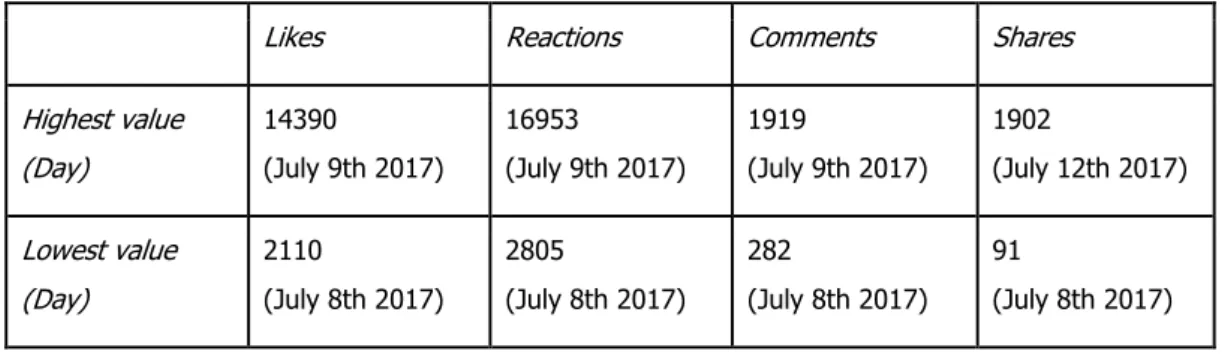
During that period, the page oscillated between 2 and 3 posts per day, an activity that, while consistent with the description above for a year, is below the average. Also consistent is the variation of engagement, as Table 2 resumes. Please note that, unlike the previous table, this one presents not averages but absolute daily values.
Table 2: Highest and lowest values of engagement with TIP’s page between July 8th and July 12th 2017.
Daily values.
Likes Reactions Comments Shares Highest value (Day) 14390 (July 9th 2017) 16953 (July 9th 2017) 1919 (July 9th 2017) 1902 (July 12th 2017) Lowest value (Day) 2110 (July 8th 2017) 2805 (July 8th 2017) 282 (July 8th 2017) 91 (July 8th 2017)
As expected, July 9th is confirmed as an outlier – and, again, for all metrics except the number of shares21. It still remains the question, which is however out of the scope of this paper, concerning such a discrepancy of engagement among posts; to be more accurate, whether there is at all a set of predictors for higher engagement. A mere observation of the page’s activity without a closer inspection of the content of the posts is not enough to help us in this apparent randomness, a task that must be postponed to future research.
Looking at the outlier A different kind of post
As we will see in a moment, in July 9th there were two posts, but our focus will be on the most intensely commented and engaged with. As our descriptive part of the analysis has demonstrated above, this post is a clear outlier, thus demonstrating its importance to the page’s dynamics. Even more important, the topic of the post itself and the story behind it are fundamental to analyze the page’s identity.
21 In second place, by a small difference (1109 shares) in absolute values. In July 12th there were however 3 posts, and
This post – henceforth, labeled as “self-disclosure” – comes as an immediate response to a previous post, in the same day at 6:33pm, in the profile page of Diogo Queiroz de Andrade22 (at the time the vice-director of Público), itself a response to a previous TIP publication. At 2:55pm, TIP published a very short post23 with a screenshot of a TV news program, with only “¯\_(ツ)_/¯” as text. According to one version of the story, “Baluarte Dragão” [Dragon Stronghold], a Facebook page dedicated to football and supporting the team Futebol Clube do Porto, published by mistake, through its Twitter account, a copy of that Facebook post by TIP, but at 2:57pm, Baluarte Dragão’s mistaken tweet was already deleted, and replaced by an identical one in TIP’s Twitter feed. According to another version, stated by the page owners repeatedly as a comment to that first post, there was no such tweet by “Baluarte Dragão”; rather, the screenshot was photoshopped. In any case, Pedro Bragança Ribeiro, administrator of that football related page, had already been surmised as one of TIP’s authors, and thus the deleted (or photoshopped) tweet served to strengthen (or to confirm) the suspicion that he was one of the authors of TIP. Or perhaps it served just as a bait to lure him to come out of anonymity. Without a way to verify if that tweet by “Baluarte Dragão” ever existed, we are left with these unproven hypotheses.
Diogo Queiroz de Andrade’s post, drawing on that assumption as something beyond doubt, was assertive enough to call for a reply by TIP24, a reply that came at 10:03pm, in the form of the self-disclosure post25. Faced by the events, the editors of TIP came forward and revealed their own side of the story, arguing for their work, their anonymity, and the relevance of the page itself, as well as charging the journalists involved in their forced revelation as breaking journalism’s ethical code of conduct. In short, in this post the identity of the page, its reason for being, and the kinds of journalistic actions that give it meaning all come into play. It is paradigmatic in that it is a meta-post of sorts, it is self-referential: more than being from TIP, it is about
TIP, and as such one where the comments are most likely to show how their audience sees the page, its usefulness, and their stance in relation both to the page and to mainstream journalistic practices.
Some details on engagement
July 9th was, as we mentioned above, an outlier in terms of engagement. This post, in particular, was far removed from all others: it had a total of 1682 comments by 1394 users, 12819 reactions on the self-disclosure post, compared with 1571 reactions on “¯\_(ツ)_/¯”; even the comments reached themselves an unusual amount of reactions, one peaking at 1770 reactions.
Taken as a whole, the comments total about 46000 words (an average of about 27 words per comment), even though several comments are far above that average. This also shows that engagement with this post took some time and effort from commenters, rather than it being just a few quick remarks, done in passing. It also provided very rich material for the analysis, as we will see; likewise, and as stated above, this also
22
https://www.facebook.com/photo.php?fbid=1602614483082675&set=a.148340225176782.28987.100000024162109&t ype=3&theater
23 https://www.facebook.com/410931902437437/posts/651940925003199
24 While making disparaging remarks about the page’s editors, Diogo Queiroz de Andrade also challenged them to a
non-anonymous interview for Público.
meant that many of the comments were highly redundant in relation to each other, to the point that data saturation was reached even before all of the comments were analyzed.
Even though the contents of this post are not representative of what the page usually posts, and in fact forces the page’s editors to “break character”, the responses allow participants to position themselves in a more focused way about what they think of the page, and about what they think of the news media targeted by the page in its critiques.
Center and periphery: An insight from visual network analysis
A visual network exploration of the activity in this day will give us a better grasp of the different ways the users engaged with the posts, and actually serve as guide to the content analysis. What follows is the reactions of users on TIP’s publication on 9 July 2017 represented by a user-post bipartite graph, which also corresponds to the particular properties that were offered by Facebook Graph API in the period of data gathering.
Image 5: Reactions of users on TIP’s publication: User-post bipartite graph of July 9th activity (all users)
Images 5 and 6 are user-post bipartite graphs of TIP page, in July 9th 2017. Force-directed spacialization was applied for a better interpretation of the network. In both graphs the small white, blue, gray and pink nodes are users, and the labeled nodes represent the page’s publications. Node colors relate to different types of reactions: likes or shares, and comments. In a single day, the content of TIP’s posts engaged more than 16200 users.
The network on the top (Image 5) displays the classical responses afforded by Facebook posts, i.e., reactions, likes, comments, and shares. The outer ring shows a large amount of users, 14824 to be more
precise (91.39%), who mainly reacted with likes or shares. These were removed in the bottom network (Image 6): only the users who made comments are visible (a total of 1394 users, with 1659 comments). The inner rings in blue and gray, closer to the self-disclosure post, depict stronger reactions, in particular comments and replies. Those depicted in blue commented only once; those in gray made more than one comment (including replies to comments), in a range between 2 to 9. Finally, the page-user itself, in pink, commented 15 times. In both networks, nodes that were closer to the page posts represent a highly engaged group of users. These will be hereafter, in the content analysis sections, denoted as “the center”, and the remaining ones (that also commented) as “the periphery”.
Image 6: Reactions of users on TIP’s publication: User-post bipartite graph of July 9th activity (users that
commented)
Main topics and sub-topics
Six main topics can be identified: a) Authorship and Anonymity (pertaining to evaluations about the editors of the page, their work, and the importance – or lack thereof – of anonymity to the page’s objectives); b) Critique of Specific News Actors (pertaining to criticism around the disclosure of the page’s editors); c) Comments on the Media Ecosystem (having to do with how commenters see the media, how they see issues around ethics, credibility, and the effects of the journalistic attention given to the page, among other issues);
d) Ambiguous/Offtopic (having to do with the clubistic preferences of one of the editors, and with mentions of the Panama Papers); e) Overarching Explanations (attempts at systematic explanations for current media tendencies, or connection to international events); and f) Incitement to Hate (accusations against other commenters, against the page or against the detractors of the page).
Main results from the content analysis
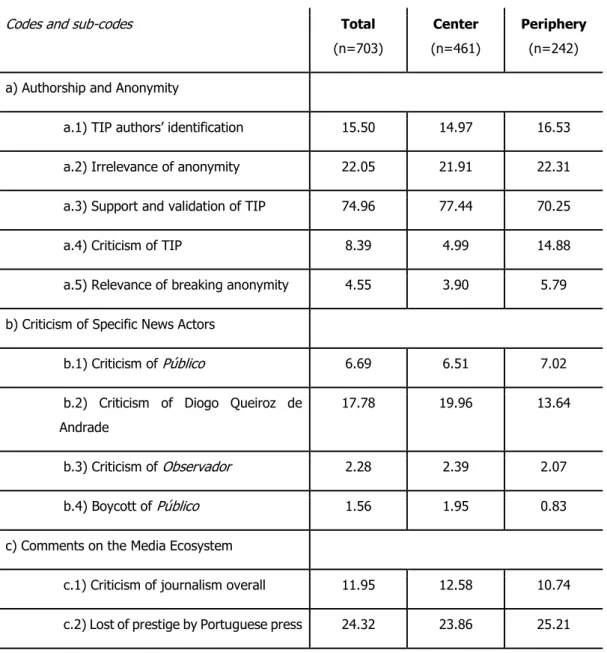
Space does not permit a full exploration of all the details of content analysis, but Table 3 has its general results, and then the same results separated by whether the commenter belonged to the center or the periphery sets, so a comparison could be drawn between the two groups.
Even though 800 comments were considered, not all of them had relevant content that justified them being coded. Of these 800 comments, 703 were coded, which represents 87.88% of the total. In this subset, 242 (34.42%) were made by commenters from the periphery, and 461 (65.58%) were made by commenters from the center of the network. The following percentages will relate to the comments actually coded, rather than to the 800 comments. This distribution is similar to the overall distribution of comments on that thread, where 40% of comments were made from periphery users, and 60% from center users.
Table 3: Comments’ content coding results
Codes and sub-codes Total
(n=703)
Center
(n=461)
Periphery
(n=242)
a) Authorship and Anonymity
a.1) TIP authors’ identification 15.50 14.97 16.53
a.2) Irrelevance of anonymity 22.05 21.91 22.31
a.3) Support and validation of TIP 74.96 77.44 70.25
a.4) Criticism of TIP 8.39 4.99 14.88
a.5) Relevance of breaking anonymity 4.55 3.90 5.79
b) Criticism of Specific News Actors
b.1) Criticism of Público 6.69 6.51 7.02
b.2) Criticism of Diogo Queiroz de Andrade
17.78 19.96 13.64
b.3) Criticism of Observador 2.28 2.39 2.07
b.4) Boycott of Público 1.56 1.95 0.83
c) Comments on the Media Ecosystem
c.1) Criticism of journalism overall 11.95 12.58 10.74 c.2) Lost of prestige by Portuguese press 24.32 23.86 25.21
c.3) Criticism of ERC 0.28 0.22 0.41 c.4) Crisis of journalistic ethics 27.45 29.50 23.55 c.5) TIP as having intrinsic value 10.10 10.20 9.92 c.6) TIP as a new journalistic medium 4.84 5.21 4.13
c.7) Streisand Effect and TIP 1.56 1.74 1.24
d) Ambiguous/Offtopic
d.1) TIP authors and football 14.22 12.36 17.77
d.2) Panama Papers 1.14 0.87 1.65
e) Overarching Explanations
e.1) Fake News 0.43 0.43 0.41
e.2) Donald Trump’s election 0.28 0.22 0.41
f) Incitement to Hate 0.43 0.22 0.83
As is clear by the general results, a great deal of comments serves to validate the work done by TIP, and to show support and even congratulate the authors and editors of the page for the work they had been performing. A vast majority of comments is supportive of TIP, and over 10% of comments were constituted by considerations about the intrinsically relevant nature of TIP’s work, beyond and above the specific things the page does. Even so, about 8% of comments were also critical of TIP, with accusations of partiality and unstated ideological – if not outright political – affiliations; some comments included both aspects (praise and criticism) together. This shows that the comments section for TIP is far more nuanced concerning its users than a dualistic pro/con approach to the page, and that users who invest time into commenting on it will often comment on the topics at hand without necessarily or overwhelmingly being either for or against the page in an explicit manner.
The matter at hand in the post specifically – the identification of the editors of the page – was also discussed in several comments, both by stating how irrelevant the information was, thus downplaying what the journalists had done as being in the best interest of the public, and by reinforcing the importance of knowing. The numbers show, however, that those two things are not at the same level, since only about 4.5% of the comments pertain to the disclosure being relevant (and even among those, some of them claim that the relevance is because this way the page can continue its work without being attacked on irrelevant aspects, such as the authors’ identity). Associated with the reveal about the authors comes the connection between one of them and the already mentioned football-related blog which is seen as being heavy on “tricks” of the same nature that TIP exposes. There is a great deal of intersection between criticism about the (alleged) political bias of TIP and the (fully assumed) clubistic sports bias – about 59.3% of the comments criticizing TIP also talk about the connection with the football blog. It seems, then, that the offline and legal identity
of the authors is less important for commenters than it is for them to know that the same internet persona serves two functions in two distinct outlets, in a much more virtualized approach to identity management and visibility.
The commenters also dedicate considerably more attention to the current state of journalism. Criticism to declining journalistic ethics, to specific journalists and media involved in divulging the identity of the authors are some of the most prominent. This is often rhetorically used to, once again, justify the existence of TIP, validate its work, or consider TIP as either an example of a paradigmatic function of the new media (particularly online socially oriented platforms), or as a news medium unto itself. This was mentioned in 4.8% of the comments coded, and it opens up an interesting possibility, which is the idea that “journalism” is becoming less a professional activity, and more a series of results and checks and balances that can be equally obtained outside of a newsroom, or even outside an entrepreneurial and formally validated structure. In this sense, just as journalism is seen as failing its own ethical standards, it is also seen as responsible for the appearance of a form of meta-journalism that fulfills or replaces altogether the social functions of journalism. This is perhaps the clearest when commenters note that journalists created a “Streisand Effect” with TIP by giving it so much attention, or compared the coverage of TIP with the (lack of) coverage around the Panama Papers, and that this, in turn, constitutes for them evidence that there are interests at stake for mainstream media.
The supposed denunciation of TIP by the Portuguese press generated some harsh comments from people concerned more with criticizing the current state of the press than with defending TIP, and Diogo Queiroz de Andrade was a prime recipient of these remarks, being considered a paradigmatic example, of sorts, of the failures of Portuguese journalism. We can see how criticism of him in particular is higher than criticism of journalism overall, and almost at the level of criticism aimed at the Portuguese press. There is here, as is common in contemporary understandings of media representations, and of the political process, a personalization of institutions and social processes, in this case fueled by the chronology of events, as described in a previous section.
Unlike what was first assumed by the research team, center and periphery respondents were overall pretty similar in the content of their comments. There is one notable exception, which pertains to criticism about TIP. Even though the amount of praise is similar, the criticism sees a sharp increase from center to periphery (cf. line a.4 in Table 3). Against the uniformity of most of the rest of categories, this falls into the hypothesised pattern, as frequent followers of the page would, in principle, be less derisive or critical of its role and positioning in a situation where the page is seen as being under attack by many commenters. Other, more sparse, comments, tried to connect the events around this post with more general changes in the media, and even remarked that there is a post-Trump era in journalism, and that “fake news” are the new enemies of journalism.
Beyond words: the usage of emojis
A final and complementary remark concerns a non-traditional form of text analysis, the usage of emojis in the comments. To achieve that goal, we relied on Textanalysis, a tool that, as mentioned above, provides statistics on emojis and bigram frequencies. Just like for the content analysis with NVivo, the set of
comments was considered as a whole and as composed by two non-overlapping parts, the “center” and the “periphery”.
While it is less easy to identify a trend, or even a remarkable difference between center and periphery concerning emojis, the following table (Image 7) shows that in the “center” these tend to be less common, perhaps denoting an intention to stick with a more rational approach, and a readiness to engage in a dialogical thread in which the usage of these symbols might have been taken for irony, or at least a less serious stance, and as such a risk for the commenter to be self-deprecating his own participation.
Even if such is the case, there are no other visible signs of differences between center and periphery, or between any of the parts and the whole. Emojis with a positive meaning (clapping hands, thumbs up, face with tears of joy, etc.) are remarkably more common than negative ones (thumbs down, grinning face), thus confirming what has been identified in the previous section, but both are equally distributed across the network.
Image 7: Text analysis according to the use of emojis: the reactions on the self-disclosure post
Perhaps more important than the results on our proposed subject, this very short and quick experience with text analysis according to the use of emojis shows how specific affordances of the Facebook platform can be appropriated as new forms of content analysis. Emojis, but also images (static or animated GIFs) and links are part of its vocabulary, and as such any tool that facilitates a structured gathering of this kind of data should be considered in the researcher’s arsenal.
Conclusions
In this paper we conducted a mixed exploratory research of a popular Facebook page, “Os Truques da Imprensa Portuguesa”, zooming in from a global characterization of the its activity to a close-up of a particular post that revealed to be a clear outlier regarding user engagement, with the added relevance of being central, content wise, to the identity of the page itself.
The gathering of data paved the way not only to an early description of the page’s usual activity (how frequently it posts and how those posts are generally received) but also allowed an accurate identification
of the communication strategy of the page’s authors and how it contributes to their role as watchdogs of the Portuguese media: recurring mostly to screenshots of news-related content that complement the textual part of the posts as a defensive strategy against the ephemerality of newspaper, TV and web-based news. Moreover, the digital methods approach was also fundamental to identify as an outlier the post in which the authors made a self-disclosure of their offline identities, thus leading the research to a closer look, both through visual network analysis and through content analysis. The first led to a clear differentiation between two subsets of users, according to their reactions to the self-disclosure post: the “center” and the “periphery”. This latter depicts a group of users who, even when commenting besides recurring to Facebook’s variations of “like”, did not commit to a true dialog, while the “center” users were strongly committed to opine and mark their impressions through comments and replies.
The content analysis (complemented by the usage of emojis) showed that “center” and “periphery” were nevertheless very similar in the topics they brought to the discussion, i.e., the polarization that emerges from the network itself does not translate into a polarization of the way the users engaged with the post, of the type of arguments used, or of the positive/negative opinion of the page, thus reinforcing the usefulness of a mixed methods approach to avoid “blind spots” in the analysis. Actually, the positioning of the commenters is far more nuanced than this dualistic pro/con approach: sometimes even the same comment can present both arguments for and against the page and its behavior. The only exception to that indifferentiation concerns the criticism about TIP, in which there was a sharp increase from center to periphery.
The relevance of the post must then be attributed more to its self-referentiality; i.e., the fact that, instead of being only from TIP as the overwhelming majority of its posts, it is about TIP, and, of course, about their authors, thus putting into play their alleged “mission” in a journalistic landscape experiencing profound changes. It is thus somehow distressing to observe that the end of the anonymity of the authors did not coincide with a boost of the activity of the page. Quite the contrary: a final and quick data retrieval of its activity after the disclosure of the identities26 showed a reduction of the frequency of publications, with the average falling from 3 to 5 daily posts to about 0.89 posts per day, and many days without a single post. Has the novelty faded? Was anonymity a catalyzer for the authors or for the followers? Has the landscape changed in such a short span of time? Did anything in the lives of the authors change – professionally or personally – that might have contributed to it? Those are questions that have to remain unanswered for now, but the data at least raises the possibility that such an aggressive stance by the media against TIP might have had a chilling effect on the page’s activity, one that is seen by many as necessary to at least complement the functions of journalism.
26 Between July 10th 2017 and July 9th 2018, in order to cover a complete year, as in the section on “Global posting and
References
Alaimo, K. (2015). How the Facebook Arabic Page “We Are All Khaled Said” Helped Promote the Egyptian Revolution. Social Media + Society 1(2), pp. 1-10. https://doi.org/10.1177/2056305115604854 boyd, d. m. & Ellison, N. B. (2007). Social Network Sites: Definition, History, and Scholarship. Journal of
Computer-Mediated Communication 13(1), pp. 210-230. https://doi.org/10.1111/j.1083-6101.2007.00393.x
Dahlberg, L. (2007). Rethinking the Fragmentation of the Cyberpublic: from Consensus to Contestation. New Media & Society 9(5), pp. 827-847. https://doi.org/10.1177/1461444807081228
Fruchterman, T. M. J. & Reingold, E. M. (1991). Graph Drawing by Force Directed Placement. Journal of Software: Practice and Experience, 21(11), pp. 1129-1164. https://doi.org/10.1002/spe.4380211102
Gillespie, T. (2010). The Politics of ‘Platforms’. New Media & Society 12(3): 347-364. https://doi.org/10.1177/1461444809342738
Helmond, A. (2015). The Platformization of the Web: Making Web Data Platform Ready. Social Media + Society 1(2), pp. 1-11. https://doi.org/10.1177/2056305115603080
Jacomy, M., Venturini, T., Heymann, S., & Bastian, M. (2014). ForceAtlas2, a Continuous Graph Layout Algorithm for Handy Network Visualization Designed for the Gephi Software. PLoS ONE 9(6): e98679. https://doi.org/10.1371/journal.pone.0098679
Latour, B. (2011). Networks, Societies, Spheres: Reflections of an Actor-Network Theorist. International Journal of Communication 5, pp. 796-810. http://ijoc.org/index.php/ijoc/article/viewFile/1094/558 Omena, J. J. & Rosa, J. M. (2017). “O Brasil foi pra Rua” – De Novo! Estudos dos protestos nas redes sociais. In Camponez, C., Araújo, B. et al. (eds.), Comunicação e Transformações Sociais, Vol II: Comunicação Política, Comunicação Organizacional e Institucional e Cultura Visual (Atas do IX Congresso da SopCom), , pp. 51-74. Coimbra, SopCom: Associação Portuguesa de Ciências da Comunicação.
Pew Research Center (2011). The Internet and Campaign 2010. http://www.pewinternet.org/files/old-media//Files/Reports/2011/Internet%20and%20Campaign%202010.pdf
Pew Research Center (2016). Social Media Update 2016. http://assets.pewresearch.org/wp-content/uploads/sites/14/2016/11/10132827/PI_2016.11.11_Social-Media-Update_FINAL.pdf Rieder, B. (2013). Studying Facebook via Data Extraction: The Netvizz Application. WebSci '13 Proceedings
of the 5th Annual ACM Web Science Conference, pp. 346-355. https://doi.org/10.1145/2464464.2464475
Rieder, B., Abdulla, R., Poell, T., Woltering, R., & Zack, L. (2015). Data Critique and Analytical Opportunities for Very Large Facebook Pages: Lessons Learned from Exploring "We Are all Khaled Said". Big Data & Society, 2(2). https://doi.org/10.1177/2053951715614980
Rogers, R. (2013). Digital Methods: Cambridge, MA: The MIT Press.
Silverman, D. & Marvasti, A. (2008). Doing Qualitative Research: A Comprehensive Guide. Los Angeles: SAGE Publications.
Tufekci, Z. (2014). The Medium and the Movement: Digital Tools, Social Movement Politics, and the End of the Free Rider Problem. Policy & Internet 6(2), pp. 202-208. https://doi.org/10.1002/1944-2866.POI362
Tufekci, Z. & Wilson, C. (2012). Social Media and the Decision to Participate in Political Protest: Observations from Tahrir Square. Journal of Communication 62, pp. 363-379. https://doi.org/10.1111/j.1460-2466.2012.01629.x
Venturini, T., Jacomy, M. & Pereira, D. (2015). Visual Network Analysis. SciencesPo Media Lab working paper. http://www.tommasoventurini.it/wp/wp-content/uploads/2014/08/Venturini-Jacomy_Visual-Network-Analysis_WorkingPaper.pdf
Venturini, T., Jacomy, M., Bounegru, L. & Gray, J. (2017). Visual Network Exploration for Data Journalists. Forthcoming in Eldridge II, S. & Franklin, B. (eds.), The Routledge Handbook to Developments in Digital Journalism Studies. Abingdon: Routledge. https://ssrn.com/abstract=3043912
Watts, D. & Dodds, P. S. (2007). Influentials, Networks, and Public Opinion Formation. Journal of Consumer Research 34(4), pp. 441-458. https://doi.org/10.1086/518527
Williams, C. B. & Gulati, G. J. (2012). Social Networks in Political Campaigns: Facebook and the Congressional Elections of 2006 and 2008. New Media & Society 15(1), pp. 52-71. https://doi.org/10.1177/1461444812457332
Wilson, R. E., Gosling, S. D., & Graham, L. T. (2012). A Review of Facebook Research in the Social Sciences.
Perspectives on Psychological Science 7(3), pp. 203-220. https://doi.org/10.1177/1745691612442904
Zuckerman, E. (2014). New Media, New Civics?. Policy & Internet 6(2), pp. 151-168. https://doi.org/10.1002/1944-2866.POI360