IMPACT OF Clethra arborea AITON (CLETHRACEAE) IN A SPECIAL
PROTECTION AREA OF SÃO MIGUEL ISLAND, AZORES
JOÃO MONIZ & LUÍS SILVA
MONIZ,J.&L.SILVA. Impact of Clethra arborea Aiton (Clethraceae) in a Special
Protection Area of São Miguel Island, Azores. Arquipélago. Life and Marine Sciences. 20A: 37-46.
Clethra arborea Aiton (Clethraceae) is a tree endemic to Madeira Island, and a recent
introduction to São Miguel Island at Tronqueira/Pico da Vara, a Special Protection Area (SPA) included in Natura 2000, habitat of the endemic bird Pyrrhula murina Godman (Aves: Fringillidae). In this work the impact of C. arborea on the native vegetation was evaluated. Microhabitats associated with C. arborea and with native trees, and areas with different degrees of infestation by C. arborea were compared for soil pH, soil conductivity, soil macronutrient availability, leaf litter production, number of seedlings and vegetation structure. There were no clear differences in soil pH, conductivity and macronutrient availability, either between micro-habitats associated with C. arborea and with native trees, or between areas with different degrees of infestation by C. arborea. Leaf litter production was significantly higher in micro-habitats associated with C. arborea and higher still in areas with high levels of infestation. The number of seedlings and the percentage of endemic seedlings differed significantly between microhabitats associated with C. arborea and those associated with endemic trees. Invasion by C. arborea modified vegetation structure, especially biovolume, which was much higher in invaded areas. By considerably decreasing the proportion of biovolume allocated to native trees, C. arborea infestations may have a negative impact on the conservation efforts at the SPA.
João Moniz & Luís Silva (e-mail: lsilva@notes.uac.pt), CIRN, Departamento de Biologia, Universidade dos Açores, Apartado 1422, PT - 9501-855 Ponta Delgada, Portugal.
INTRODUCTION
The increase of biological invasions caused by human activities is a global phenomenon but of greatest significance in isolated islands and archipelagos (LOOPE & MUELLER-DOMBOIS
1989). Invasive plants can alter several community properties, including diversity, primary productivity, species interactions, community stability and ecological successions (VITOUSEK &WALKER 1989).
Non-indigenous plants are an important component of the Azorean vascular plant flora. Among 1002 taxa cited for the archipelago, 69 % are considered as introduced (SILVA et al. 2000,
SILVA 2001).
Clethra arborea Aiton (Clethraceae) is a tree endemic to Madeira Island, where it is found in
the Clethro-Laurion alliance (SJÖGREN 1972). It is a recent introduction to São Miguel Island (Azores), where it was first recorded in 1960 (FRANCO 1984). Later, it was found invading high
altitude native vegetation in conservation areas (LE GRAND 1982, BIBBY & CHARLTON 1991).
Pyrrhula murina Godman (Aves: Fringillidae), the Azorean bullfinch, is an endemic bird, largely confined to the native vegetation found in the eastern part of São Miguel Island (Tronqueira/Pico da Vara Special Protection Area of Natura 2000). This habitat has been considerably altered by the expansion of non-indigenous plants, especially C. arborea (RAMOS
1995; SILVA 2001). According to SJÖGREN
(1973), the vegetation at Tronqueira belongs to the Juniperion brevifolii alliance, with the potential to form three vegetation layers,
including 13 differential species when fully developed. This forest remains, if fully preserved, would correspond to typical Azorean Mesic or Humid Laurel Forests (DIAS 1996).
Early work with C. arborea, suggested the possibility of impacts on the vegetation structure of the invaded communities (SILVA 2001). In this
work, the impact of C. arborea in high altitude native vegetation at Tronqueira was evaluated. In particular, three areas with different C. arborea abundances, on one hand, and microhabitats associated to C. arborea, Laurus azorica Seub. (Franco) (Lauraceae) and Ilex perado Aiton ssp. azorica (Loesener.) Tutin (Aquifoliaceae), on the other hand, were compared. We tested the following hypotheses: i) soil parameters are different in areas with different levels of infestation by C. arborea; ii) leaf litter production is highest in invaded areas; iii) the pool of seedlings differs between microhabitats; and iv) vegetation structure differs between areas with different infestation levels.
MATERIAL AND METHODS Microhabitats
Native and introduced trees: Microhabitats associated with C. arborea and two native species, L. azorica and I. perado ssp. azorica were compared. In September 2000, 30 trees of each species were marked. Under the canopy of each tree, soil, seedlings, and leaf litter were sampled in three different seasons: Winter (December 2000), Spring (April 2001) and Summer (June 2001).
Soil: Under the canopy of each tree and for each sampling season, three soil cores (5 cm diameter by 15 cm deep) were collected and pooled. Soil pH, conductivity and macronutrient availability (K, P, Ammonia and Nitrate) were estimated using LAMOTTE Soil Analysis Lab (LAMOTTE
1996).
Leaf litter: Leaf litter was collected under the canopy of each marked tree using a 50 x 50 cm metal frame. Litter was dried at 70ºC up to a constant dry weight. The accumulation of leaf
litter per square metre was calculated (WILLIAMS
-LINERA & TOLOME 1996).
Seedlings: Seedlings were sampled within a one metre radius circle, around the tree trunk. Species diversity and equitability were calculated according to GREIG-SMITH (1983).
Invaded areas
Selection of the areas: Three areas were selected which by visual inspection appeared to have different degrees of infestation by C. arborea. This included an area with a high degree of infestation in which C. arborea greatly outnumbered other trees (HIGH), a partially invaded area (MEDIUM) and one with only a few, scattered individuals of C. arborea (LOW). All the areas were located in the Tronqueira region in the eastern part of São Miguel, and were only about 500 m apart. Three rounds of sampling were performed at each area (February, May and July 2001).
Soil and leaf litter: At each of 30 random points selected for the study of vegetation structure, soil and leaf litter were sampled as previously.
Vegetation structure: A distance method was used (T-Square Sampling) to evaluate vegetation structure, with thirty random points per area (KREBS 1989). According to this method, the distances from a random point to the nearest tree and from this to its nearest neighbour were measured. Tree species was recorded as well as upper and lower canopy limits, canopy diameter, and basal diameter of the trunk. Tree density was calculated using the two measured distances (KREBS 1989). Projected biovolume (Bp) was
calculated according to DIAS (1996), based on
canopy height (c) and mean canopy diameter (d), such that: Bp= cπ(d/2)2.
Statistical analysis: Data analysis followed ZAR
(1996), using SPSS 10.0. All variables were checked for normality with the Kolmogorov-Smirnov test. For normal soil data (conductivity) and leaf litter dry weight, one factor ANOVA was used, followed by the HSD Tukey test, when
three determinations were made, or a t test when only two determinations were available (ammonia, nitrate, phosphorus and potassium). Non-normal data were transformed using log(x). When transformation was insufficient to normalize data (soil pH), the Kruskal-Wallis test followed by the Nemenyi test (when three determinations were made) or the Mann-Whitney test (when two determinations were made) were used. For seedlings, the mean number of species was calculated, as well as diversity, equitability and percentage of endemic seedlings. The Friedman test was used for comparisons between microhabitats. Regarding vegetation structure, one factor ANOVA followed by the HSD Tukey test were used for normal data and the Kruskal-Wallis test followed by the Nemenyi test were used for non-normal data.
RESULTS Microhabitats
Soil ph: Values of soil pH varied from 5.4 to 5.6 (Table 1). Significant differences were found between microhabitats and sampling occasions (Table 2). In particular, significant differences were found between I. perado ssp. azorica and the other trees and between winter and the other two seasons (Table 3).
Soil conductivity: This parameter varied considerably, from about 25 up to 79 ppm (Table 1). The effect of sampling season was clearly more significant than the effect of the microhabitat (Tables 2 and 3), with conductivity levels in Spring greatly exceeding those in the other seasons.
Soil nutrients: Phosphorus concentration varied from about 0.9 up to 2.1 kg/ha (Table 1). Phosphorus concentration showed significant differences between microhabitats (Table 2), with lower values for Ilex (Table 3), but not between sampling seasons (Table 2). Potassium concentration varied from 168 to 253 kg/ha (Table 1) and was significantly different between sample seasons but not between microhabitats (Table 2). Ammonia concentration varied between 36 and 65 kg/ha (Table 1), with
significant differences only between microhabitats (Table 2), namely between Ilex and the other species (Table 3). For nitrate, although concentration varied from 5 to 7 kg/ha (Table 1), no significant differences were found for either factor (Table 2).
Table 1
Soil pH and conductivity (ppm), phosphorus, potassium, nitrate and ammonia concentrations in soil (kg/ha), for samples collected under Clethra arborea,
Ilex perado ssp. azorica and Laurus azorica trees at
Tronqueira (São Miguel Island, Azores), in different sampling seasons. (Mean ± SE).
Variable Season pH Winter 5.58 ± 0.04 5.49 ± 0.04 5.59 ± 0.05 Spring 5.49 ± 0.05 5.41 ± 0.04 5.58 ± 0.05 Summer 5.41 ± 0.04 5.39 ± 0.04 5.42 ± 0.06 Conductivity Winter 39.83 ± 2.43 46.30 ± 4.05 43.01 ± 3.65 Spring 55.70 ± 3.65 79.14 ± 2.65 76.14 ± 3.01 Summer 26.22 ± 0.88 25.34 ± 1.25 29.38 ± 1.02 Ammonia Winter 36.03 ± 6.00 39.58 ± 8.23 49.07 ± 10.93 Spring 35.70 ± 3.38 40.72 ± 3.52 65.12 ± 11.14 Nitrate Winter 6.17 ± 1.00 6.92 ± 1.00 5.47 ± 0.88 Spring 5.90 ± 0.38 4.85 ± 0.55 7.23 ± 0.67 Phosphorus Winter 1.77 ± 0.79 0.86 ± 0.13 0.86 ± 0.26 Spring 2.10 ± 0.43 1.33 ± 0.41 1.18 ± 0.35 Potassium Winter 170.37 ± 11.32 168.33 ± 7.69 179.13 ± 26.02 Spring 185.03 ± 11.01 252.50 ± 31.88 215.72 ± 24.92
Clethra arborea Laurus azorica Ilex perado
Microhabitat
Table 2
Comparison of pH, conductivity, phosphorus, potassium, nitrate and ammonia concentrations in soil samples collected under Clethra arborea, Ilex perado ssp. azorica and Laurus azorica trees at Tronqueira (São Miguel Island, Azores). Effect of microhabitat and
sampling season. Kruskal-Wallis test (χ2, test statistic; p, probability; n, number of soil samples); Mann-Whitney test (U, test statistic); one factor ANOVA (F,
test statistic); t - test (t, test statistic).
Variable χ2 p n χ2 p n pH 9.90 0.0071 180 17.92 0.0001 180 Condutivity 6.52 0.0384 180 113.65 <0.0001 180 χ2 p n U p Potassium 1.57 0.4546 120 1286.5 0.0007 120 Phosporous 8.51 0.0142 120 1765.0 0.8496 120 F p n t p Nitrate 0.20 0.8153 120 0.40 0.6900 120 Ammonia 7.70 0.0007 120 -0.48 0.6340 120 Microhabitat Season n n
Table 3
Comparison of soil conductivity (ppm), pH, phosphorus, potassium, nitrate and ammonia concentrations (kg/ha) in soil samples collected under
Clethra arborea, Ilex perado ssp. azorica and Laurus azorica trees at Tronqueira (São Miguel Island,
Azores). Only for those variables which showed significant differences in ANOVA or Kruskal-Wallis
test (Table 2). Different letters indicate significant differences (Nemenyi test for soil conductivity, pH and
phosphorus concentration; Tukey HSD test for ammonia concentration; α= 0.05). (Mean ± SE).
Variable Factor
Winter Spring Summer
Soil conductivity 43.05 ± 3.38 a 70.33 ± 3.10 b 26.98 ± 1.05 c
Soil pH 5.55 ± 0.04 a 5.49 ± 0.04 b 5.41 ± 0.04 b
Clethra Ilex Laurus
Soil conductivity 40.58 ± 2.32 a 49.51 ± 2.56 a 50.26 ± 1.98 a Soil pH 5.49 ± 0.04 a 5.53 ± 0.05 b 5.43 ± 0.04 a Phosphorus 1.29 ± 0.61 a 1.02 ± 0.31 b 1.10 ± 0.27 a Ammonia 35.87 ± 20.19 a 42.10 ± 11.04 b 40.15 ± 5.88 a Season Microhabitat
Leaf litter: Leaf litter accumulated in different microhabitats varied considerably, from 29 up to 163 g/m2 (Table 4). There were significant differences between microhabitats (ANOVA: F=29.41; p<0.0001; n=180) and between sampling seasons (ANOVA: F=30.41; p<0.0001; n=180). In particular, significant differences were found between C. arborea and the other trees, and between winter and the other seasons (Table 5).
Table 4
Leaf litter (dry weight in g/m2) accumulated under
Clethra arborea, Ilex perado ssp. azorica and Laurus azorica trees at Tronqueira (São Miguel Island,
Azores), during three sampling seasons. (Mean ± SE).
Winter 162.96 ± 14.11 107.23 ± 15.90 92.98 ± 10.07 Spring 87.19 ± 10.70 38.92 ± 6.03 29.96 ± 6.76 Summer 80.34 ± 4.32 46.22 ± 5.12 28.73 ± 3.39
Season Microhabitat
Clethra arborea Laurus azorica Ilex perado
Seedlings: Five species were more frequent in the three microhabitats: C. arborea, Myrsine africana L. (Myrsinaceae), Viburnum tinus L. ssp. subcordatum P. Silva (Caprifoliaceae), I. perado ssp. azorica and L. azorica. Less frequent species included Pittosporum undulatum Ventenat (Pittosporaceae), Erica azorica Hochst. ex Seub.
(Ericaceae) and Juniperus brevifolia (Seub.) Antoine (Cupressaceae). Regarding the number of taxa, this averaged one or two species (Table 6), and there were no significant differences between sampling seasons (Friedman test: χ2=3.68; p=0.159). Regarding microhabitats, the differences were not clear (Table 7), since they were not confirmed by Nemenyi test (Table 8). The number of seedlings varied between about two and nine per sample (Table 6), and differed between seasons (Friedman test: χ2=7.11; p=0.028). In winter and spring significant differences were found between C. arborea and the other trees (Tables 7 and 8). The percentage of native seedlings varied from 40 up to 83%, but did not differ significantly between sampling seasons (Friedman test: χ2=2.44; p=0.295). C. arborea microhabitats showed a significantly lower percentage of native seedlings (Tables 7 and 8). Although with some variation (Table 6), no significant differences were found for species diversity between sampling seasons (Friedman test: χ2=4.53; p=0.104). Differences between microhabitats were not clear, since they were not confirmed by the Nemenyi test (Tables 7 and 8). Regarding equitability, no significant differences were found between sampling seasons (Friedman test: χ2=5.50; p=0.0640), but significant differences were found between microhabitats (Table 7 and 8).
Table 5
Leaf litter (dry weight in g/m2) accumulated under
Clethra arborea, Ilex perado ssp. azorica and Laurus azorica trees at Tronqueira (São Miguel Island,
Azores). Different letters indicate significant differences (Tukey HSD test; α= 0.05) between species
(Microhabitat) or between sampling seasons (Season). (Mean ± SE).
Factor Leaf litter Microhabitat C. arborea 110.16 ± 9.71 a I. perado 64.12 ± 9.01 b L. azorica 50.55 ± 6.74 b Season Winter 121.05 ± 13.36 a Spring 52.02 ± 7.83 b Summer 51.76 ± 4.28 b
Table 6
Seedlings growing under Clethra arborea, Ilex perado ssp. azorica and Laurus azorica trees at Tronqueira
(São Miguel Island, Azores), during three sampling seasons. (Mean ± SE).
Variable Season Number of taxa Winter 2.00 ± 0.14 1.67 ± 0.21 2.27 ± 0.27 Spring 1.40 ± 0.15 2.40 ± 0.29 2.20 ± 0.32 Summer 1.40 ± 0.13 1.87 ± 0.34 1.20 ± 0.35 Number of seedlings Winter 3.47 ± 0.28 8.00 ± 2.87 8.07 ± 1.50 Spring 2.46 ± 0.34 8.93 ± 2.60 5.86 ± 1.12 Summer 2.73 ± 0.32 4.33 ± 1.19 3.13 ± 1.08 % of native taxa Winter 57.00 ± 6.60 72.00 ± 9.89 66.00 ± 8.48 Spring 56.00 ± 8.18 61.00 ± 8.10 83.00 ± 4.91 Summer 40.00 ± 7.93 75.00 ± 9.24 70.00 ± 9.46 Diversity Winter 0.58 ± 0.06 0.37 ± 0.08 0.61 ± 0.10 Spring 0.30 ± 0.07 0.68 ± 0.11 0.81 ± 0.12 Summer 0.26 ± 0.07 0.58 ± 0.12 0.33 ± 0.11 Equitability Winter 0.89 ± 0.02 0.80 ± 0.07 0.82 ± 0.05 Spring 0.96 ± 0.02 0.81 ± 0.07 0.90 ± 0.03 Summer 0.96 ± 0.02 0.89 ± 0.03 0.81 ± 0.09 Microhabitat
Clethra arborea Ilex perado Laurus azorica
Table 7
Seedlings growing under Clethra arborea, Ilex perado ssp. azorica and Laurus azorica trees at Tronqueira
(São Miguel Island, Azores), during three sampling seasons. Kruskal-Wallis test (χ2, test statistic; p, probability; n, number of soil samples). For the number
of seedlings, each season was analysed separately, since Freedman test showed significant differences
between sampling seasons (see text).
Variable χ2 p n Sample
Number of seedlings 8.36 0.0150 60 Winter Number of seedlings 16.33 0.0003 60 Spring Number of seedlings 0.94 0.6265 60 Summer
Number of taxa 6.41 0.0405 180 All
% of native taxa 8.87 0.0119 180 All
Diversity 6.43 0.0402 180 All
Equitability 7.89 0.0194 180 All
s
Invaded areas
Soil pH: The values for pH varied between 5.3 and 5.6 (Table 9) although with no significant differences both between areas and sampling seasons (Table 10).
Soil conductivity: This parameter varied from 27
up to 52 ppm (Table 9), with significant differences between sampling seasons but not between areas (Tables 10 and 11).
Table 8
Seedlings growing under Clethra arborea, Ilex perado ssp. azorica and Laurus azorica trees at Tronqueira (São Miguel Island, Azores). Different letters indicate significant differences between species (Nemenyi test; α= 0.05). Only for those variables showing significant differences according to the Kruskal-Wallis test (Table
7). (Mean ± SE).
Clethra Ilex Laurus
Number of taxa 1.60 ± 0.27 a 1.98 ± 0.28 a 1.89 ± 0.46 a
Number of seedlings (winter) 3.47 ± 1.05 a 8.00 ± 2.97 b 8.07 ± 2.97 b Number of seedlings (spring) 2.46 ± 0.81 a 8.93 ± 3.63 b 5.86 ± 1.45 b
% of native taxa 51.00 ± 7.33 a 69.33 ± 5.56 b 73.00 ± 6.67 b Diversity 0.38 ± 0.13 a 0.54 ± 0.12 a 0.58 ± 0.17 a Equitability 0.94 ± 0.06 a 0.83 ± 0.04 b 0.84 ± 0.04 b Microhabitat Variable Table 9
Soil pH, conductivity (ppm), phosphorus, potassium, nitrate and ammonia concentrations (kg/ha) in soil samples collected in different seasons and in areas with
different degrees of infestation (High, Medium, Low) by Clethra arborea at Tronqueira (São Miguel Island,
Azores). (Mean ± SE).
Variable Season pH Winter 5.49 ± 0.07 5.26 ± 0.06 5.49 ± 0.09 Spring 5.57 ± 0.06 5.36 ± 0.07 5.51 ± 0.08 Summer 5.52 ± 0.06 5.40 ± 0.06 5.35 ± 0.04 Conductivity Winter 33.60 ± 5.64 29.89 ± 2.51 30.52 ± 2.54 Spring 32.13 ± 2.80 52.27 ± 6.02 46.90 ± 5.66 Summer 29.12 ± 2.11 28.00 ± 1.51 27.44 ± 1.01 Ammonia Winter 108.10 ± 18.41 65.10 ± 19.18 79.95 ± 16.45 Spring 42.90 ± 5.46 90.30 ± 14.21 57.40 ± 11.24 Nitrate Winter 5.70 ± 1.01 3.20 ± 0.51 4.70 ± 0.71 Spring 5.90 ± 0.56 3.50 ± 0.63 6.30 ± 1.14 Phosphorus Winter 0.73 ± 0.24 0.50 ± 0.16 0.51 ± 0.16 Spring 6.73 ± 0.22 0.94 ± 0.34 0.78 ± 0.08 Potassium Winter 139.11 ± 9.81 189.80 ± 17.80 174.50 ± 29.46 Spring 130.26 ± 13.83 166.29 ± 10.04 178.07 ± 22.78 Area
HIGH MEDIUM LOW
Soil nutrients: Phosphorus concentration oscillated between 0.5 and 0.9 kg/ha (Table 9) but without significant differences both between areas or seasons (Table 10). On the other hand,
potassium concentration ranged from 130 up to 190 kg/ha (Table 9), with significant differences between areas, but not between seasons (Table 10). Area HIGH showed a lower potassium concentration (Table 11). Nitrate concentration varied between about 3 and 6 kg/ha (Table 9), with significant differences between areas, but not between seasons (Table 10 and 11). Ammonia concentration varied from 43 up to 108 kg/ha (Table 9), however, without significant differences both between areas or seasons (Table 10).
Table 10
Comparison of soil pH and conductivity, phosphorus, potassium, nitrate and ammonia concentrations in soil samples collected in different seasons and in areas with
different degrees of infestation by Clethra arborea at Tronqueira (São Miguel Island, Azores). Effect of area
and sampling season. Kruskal-Wallis test (χ2, test statistic; p, probability; N, number of soil samples);
Mann-Whitney test (U, test statistic); one factor ANOVA (F, test statistic); t - test (t, test statistic).
Variable Season χ2 p n χ2 p n pH 10.30 0.0580 90 1.50 0.4720 90 Conductivity 2.05 0.3577 90 19.18 0.0001 90 χ2 p n U p Potassium 5.03 0.0097 60 0.69 0.4930 60 Phosphorus 2.53 0.2817 60 448.50 0.9485 60 F p n t p Nitrate 9.37 0.0092 60 388.50 0.3540 60 Ammonia 0.01 0.9861 60 0.66 0.5150 60 Area n n
Leaf litter: Leaf litter accumulated in different areas varied considerably (Table 12). Significant differences were found between areas with different infestation levels (ANOVA: F=4.68; p=0.012) but not between sampling seasons (ANOVA: F=1.17; p=0.316). Significant differences were found between HIGH (91.9 ± 15.64) and MEDIUM (91.4 ± 16.27) relative to LOW (59.43 ± 11.97).
Vegetation structure: As expected, C. arborea was the most frequent tree in HIGH and MEDIUM, followed by L. azorica (Fig. 1). E. azorica was the most frequent tree in LOW, followed by L. azorica, I. perado ssp. azorica and C. arborea. Global tree densities were estimated at 9061, 5533 and 15741 per hectare for HIGH,
MEDIUM and LOW, respectively. As expected, C. arborea showed a high density at HIGH while, at LOW, this was true for E. azorica (Fig. 2).
Table 11
Comparison of soil conductivity (ppm) and pH, phosphorus, potassium, nitrate and ammonia concentrations (kg/ha) in soil samples collected in different seasons and in areas with different degrees of
infestation by Clethra arborea at Tronqueira (São Miguel Island, Azores). Different letters indicate
significant differences (Nemenyi test for soil conductivity and nitrate concentration; Tukey HSD test
for potassium concentration; α= 0.05). Only for those variables showing significant differences according to
the Kruskal-Wallis test (Table 10).
Variable
Winter Spring Summer
Soil conductivity 31.33 ± 3.56 a 43.77 ± 4.83 b 28.19 ± 1.54 a
HIGH MEDIUM LOW
Potassium 134.69 ± 11.82 a 177.65 ± 13.92 b 176.29 ± 26.12 b Nitrate 5.80 ± 0.29 a 3.35 ± 0.57 b 5.50 ± 0.93 a Factor Season Area Table 12
Leaf litter (dry weight in g/m2) accumulated in three
areas with different degrees of infestation (High, Medium, Low) by C. arborea at Tronqueira (São Miguel Island, Azores). Different letters indicate significant differences (Tukey HSD test, α= 0.05).
(Mean ± SE).
Winter 92.03 ± 16.63 98.49 ± 16.76 69.73 ± 14.26 Spring 97.95 ± 9.42 105.14 ± 14.48 55.44 ± 10.26 Summer 85.71 ± 20.87 55.50 ± 17.56 53.13 ± 11.40
Season Area
HIGH MEDIUM LOW
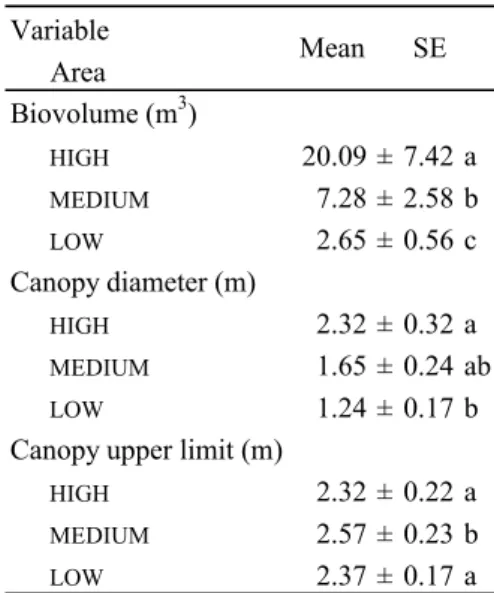
Basal diameter of the trunk showed some variation between areas, for the same species (Fig. 3), but without significant differences (Table 13). While no significant differences were found between areas for canopy lower limit (Fig. 4, Table 13), significant differences were found for canopy upper limit (Table 13 and 14). Canopy diameter was significantly different between areas (Table 13), with a tendency for larger canopy at HIGH (Table 14).
At HIGH and MEDIUM, the greatest biovolume was provided by C. arborea (50%), while in LOW it was provided by E. azorica (50%) (Fig. 5). The percentage of I. perado ssp.
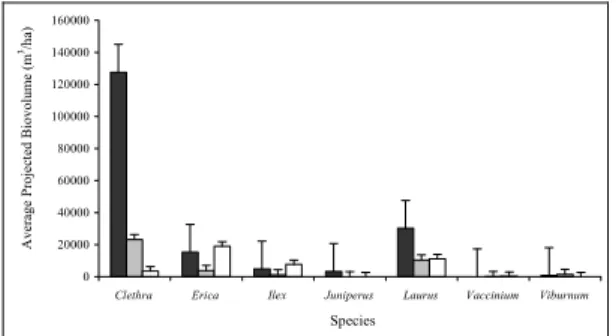
azorica biovolume was also highest at LOW. As expected, the mean biovolume of C. arborea decreased from HIGH to LOW (Fig. 6). Mean biovolume significantly increased from LOW to HIGH (Table 13 and 14). As expected, C. arborea projected biovolume per hectare was highest at HIGH (Fig. 7).
0 10 20 30 40 50 60
Clethra Erica Ilex Juniperus Laurus Vaccinium Viburnum Species Fr eq ue nc y ( % ) Table 13
Comparison of the vegetation structure in three areas with different degrees of infestation by Clethra arborea
at Tronqueira (São Miguel Island, Azores). Kruskal-Wallis test (χ2, test statistic; p, probability; N, number of soil samples); one factor ANOVA (F, test statistic).
Fig 1. Frequency of tree species found in three areas with different degrees of infestation by C. arborea at Tronqueira (São Miguel Island, Azores): heavily invaded area (black); partially invaded area (gray); lightly invaded area (white). By order in the chart:
Clethra arborea, Erica azorica, Ilex perado ssp. azorica, Juniperus brevifolia, Laurus azorica, Vaccinium cylindraceum and Viburnum tinus spp. subcordatum.
Variable
χ2 p n
Canopy upper limit 14.50 0.0007 180
F p
Biovolume 4.02 0.0196 180
Basal diameter 1.67 0.1917 180
Canopy diameter 7.40 0.0008 180
Canopy lower limit 1.14 0.3222 180
Area n 0 1000 2000 3000 4000 5000 6000 7000 8000
Clethra Erica Ilex Juniperus Laurus Vaccinium Viburnum Species D en si ty (t re es /h a) Table 14
Vegetation structure in three areas with different degrees of infestation (High, Medium, Low) by Clethra
arborea in Tronqueira (São Miguel Island, Azores).
Different letters indicate significant differences (HSD Tukey test; α=0.05). Only for those variables with significant differences given by ANOVA (Table 13).
(Mean ± SE).
Fig. 2. Tree density (number of trees/ha) in three areas with different degrees of infestation by Clethra arborea at Tronqueira (São Miguel Island, Azores): heavily invaded area (black); partially invaded area (gray); lightly invaded area (white). (For species names see Fig. 1) Variable Area Biovolume (m3) HIGH 20.09 ± 7.42 a MEDIUM 7.28 ± 2.58 b LOW 2.65 ± 0.56 c Canopy diameter (m) HIGH 2.32 ± 0.32 a MEDIUM 1.65 ± 0.24 ab LOW 1.24 ± 0.17 b
Canopy upper limit (m)
HIGH 2.32 ± 0.22 a MEDIUM 2.57 ± 0.23 b LOW 2.37 ± 0.17 a Mean SE 0 2 4 6 8 10 12 14
Clethra Erica Ilex Juniperus Laurus Vaccinium Viburnum
Species M ean B asa l D iame te r (c m)
Fig. 3. Mean basal diameter of the species found in three different areas with different levels of infestation by Clethra arborea at Tronqueira (São Miguel Island, Azores): heavily invaded area (black); partially invaded area (gray); lightly invaded area (white). Error bar
corresponds to standard error. (For species names see Fig. 1). 0 20000 40000 60000 80000 100000 120000 140000 160000
Clethra Erica Ilex Juniperus Laurus Vaccinium Viburnum
Species Av er ag e Pr oj ec te d Bio vo lu m e (m 3/h a) 0 1 2 3 4 5 6 7
Clethra Erica Ilex Juniperus Laurus Vaccinium Viburnum
Species Hei ght ( m )
Fig. 7. Average projected biovolume (m3/ha) for each
species in three areas with different degrees of infestation by Clethra arborea: heavily invaded area (black); partially invaded area (gray); lightly invaded area (white). Error bars correspond to standard error. (For species names see Fig. 1).
Fig. 4. Average lower and upper canopy limits (m) for each species found in three areas with different degrees of infestation by C. arborea at Tronqueira (São Miguel Island, Azores): heavily invaded area (black); partially invaded area (dark gray); lightly invaded area (light gray). Wider bar corresponds to trunk height. Error bars correspond to tree height. (For species names see
Fig. 1). DISCUSSION
The values for soil conductivity, pH and nutrient concentrations are consistent with the previous classification of the sampled soil as a Saturated Andosoil (MADRUGA 1996). While the considerable amount of ammonia found in the soil is probably associated with C. arborea via increased leaf litter production and its decomposition (DIAS 1996), the differences found in other soil properties for the three areas are not. Variation in soil parameters is probably due to the annual cycle of lixiviation and to the natural heterogeneity of soil properties (DIAS 1996). Thus, a direct impact of a plant invasion on soil properties was not confirmed in this work. However, an increase in leaf litter accumulation was clearly associated with the invasion by C. arborea. When comparing microhabitats associated to C. arborea, L. azorica and I. perado ssp. azorica, and areas with different degrees of infestation, it was clear that C. arborea produced larger amounts of leaf litter than native species. This is in agreement with previous observations of seasonal leaf litter production by C. arborea, which showed a considerable increase during autumn and winter (SILVA 2001). This might also
be related to the high projected biovolume of C. arborea, in contrast with the much smaller biovolume of the native species. All of the tree species in the study are evergreen but C. arborea has large leaves, which are less lethery than
0% 20% 40% 60% 80% 100% P roj ec te d B iov ol um e
High Medium Low
Viburnum Laurus Juniperus Ilex Erica Clethra
Fig. 5. Percentage of projected biovolume for each species in three areas with different degrees of infestation by Clethra arborea: High (heavily invaded); Medium (partially invaded); Low (lightly invaded). (For species names see Fig. 1).
0 5 10 15 20 25 30 35 40
Clethra Erica Ilex Juniperus Laurus Vaccinium Viburnum
Species B io vol um e (m 3)
Fig. 6. Mean projected biovolume (m3) per tree, for
each species found in three areas with different degrees of infestation by Clethra arborea: heavily invaded area (black); partially invaded area (gray); lightly invaded area (white). Error bars correspond to standard error. (For species names see Fig. 1).
others. Also, in São Miguel it was found to be semi-evergreen, with highest values of leaf fall in Autumn and Winter (SILVA 2001).
This is a very important fact regarding the conservation of the native vegetation remains in São Miguel and also P. murina habitat, since C. arborea is clearly affecting vegetation structure of the native communities. Further, I. perado ssp. azorica, an important food resource during P. murina breeding season (RAMOS 1993), showed a
considerable reduction in biovolume percentage in the two more heavily invaded areas. We thus conclude that native vegetation and P. murina habitat have been negatively affected by the invasion of C. arborea at Tronqueira Special Protection Area.
The number of seedlings is negatively associated with leaf litter production (CRAWLEY
1997). In this study, a tendency was found for a reduction of the number of all seedlings in C. arborea microhabitats. Clear reductions were found regarding the percentage of seedlings belonging to native taxa. In C. arborea microhabitats a high percentage of seedlings belonged to this species compared to numbers of native species.
Among the areas analysed, that showing a lower level of infestation by C. arborea corresponded to the alliance Juniperion-brevifolii as proposed by SJÖGREN (1973), and in particular to the association Erico-Myrsinetum On the other hand, the areas with higher levels of infestation are very similar to the Clethro-Laurion alliance from Madeira. In that alliance, C. arborea is expected to establish with L. azorica, after a stage dominated by shrubs (SJÖGREN 1972), namely
Erica scoparia L. (Ericaceae) and Vaccinium padifolium Lk. (Ericaceae). Interestingly, in Madeira C. arborea is not a dominant tree in the Laurel Forest (NEVES et al. 1996), where it is
surpassed by L. azorica, Myrica faya Aiton (Myricaceae) and Octoea foetens Baill (Aiton) (Lauraceae). In São Miguel, likewise, invaded vegetation is, for the most, in a shrub habit so that C. arborea enters the ecological succession in a stage where it later becomes the dominant tree.
ACKNOWLEDGEMENTS
Special thanks are due to the Entomology and Biological Control Section (Biology Department, University of the Azores).
REFERENCES
BIBBY,C.J.&T.D.CHARLTON 1991. Observations on the San Miguel Bullfinch. Açoreana 7: 287-304.
CRAWLEY, M., 1997. Plant-Herbivore Dynamics. Pp.
401-474 in: Crawley, M. (Ed.). Plant Ecology. Blackwell Science, London. 717 pp.
DIAS, E. 1996. Vegetação natural dos Açores.
Dissertação de Doutoramento, Universidade dos Açores, Angra do Heroísmo. 302 pp.
FRANCO, J.A. 1984. Nova Flora de Portugal, Volume
II. Lisboa. 660 pp.
GREIG-SMITH,P. 1983. Quantitative Plant Ecology. 3rd edition. Blackwell Scientific Publications, Oxford. 359 pp.
C. arborea is a species with the ability to increase both density and biovolume/ha, and by this way forming monospecific stands, completely overgrowing native vegetation. The percentage of total projected biovolume in the invaded areas is much higher for C. arborea when compared to the native taxa. Native species showed a reduced vertical stratification of their canopy, leading to a reduced contribution to total projected biovolume. The projected biovolume for this type of vegetation was estimated at 48000 m3/ha (DIAS 1996). In this work, this value was
largely exceeded in the area with the highest infestation level (HIGH), where a value of 120000 m3/ha was found. Thus, C. arborea has
the ability to maintain both high densities and high biovolumes.
KREBS, C.J. 1989. Ecological Methodology. Harper Collins Publishers, New York. 654 pp.
LAMOTTE, 1996. Instruction Manual for DCL-12.
LaMotte, Washington. 30 pp.
LE GRAND,G.1982.O Priôlo, a ave mais interessante
de São Miguel. Açoreana 6: 196-211
LOOPE, L.L. & D. MUELLER-DOMBOIS 1989. Characteristics of invaded islands, with special reference to Hawaii. Pp. 257-280 in: DRAKE,J.A.,
H.A. MOONEY, F. DI CASTRI, R.H. GROVES, F.J.
KRUGER,M.REJMÁNEK &M.WILLIAMSON (Eds).
Biological invasions - A global perspective. John
Wiley & Sons, Chichester. 525 pp.
MADRUGA, J.S. 1986. Andossolos dos Açores -
contributo para o seu estudo. Provas de Aptidão
Pedagógica e Capacidade Científica, Universidade dos Açores, Angra do Heroísmo. 126 pp.
NEVES, H.C.,A.V.VALENTE,B.F. FARIA, I.G.SILVA,
J.C. MARQUES,N.A.GOUVEIA, P.G.SILVA &P.J.
OLIVEIRA 1996. Laurissilva da Madeira-
Caracterização Quantitativa e Qualitativa. Parque
Natural da Madeira, Funchal. 192 pp.
RAMOS, J.A., 1993. The status and ecology of the
Priolo or Azores bullfinch Pyrrhula murina. Doctor
of Philosophy Thesis, University of Oxford, Oxford. 171 pp.
RAMOS, J.A.,1995. The diet of the Azores bullfinch,
Pyrrhula murina Godman, 1866 (Aves:
Passeriformes). Arquipélago. Life and Marine Sciences. 12 A: 101-109.
SILVA L, J. TAVARES & C.W. SMITH 2000.
Biogeography of Azorean plant invaders.
Arquipélago. Life and Marine Sciences.
Supplement 2 (Part A): 19-27.
SILVA, L. 2001. Plantas Vasculares Invasoras no
Arquipélago dos Açores- Caracterização geral e estudo de uma caso: Clethra arborea Ainton (Clethraceae). Dissertação de Doutoramento,
Universidade dos Açores, Ponta Delgada. 436 pp.
SJÖGREN, E. 1972. Vascular plant communities of
Madeira. Boletim do Museu Municipal do Funchal 114: 45-125.
SJÖGREN,E. 1973. Vascular plants new to the Azores
and individual islands in the archipelago. Boletim
do Museu Municipal do Funchal 124 :94-120.
VITOUSEK, P.M., 1986. Biological invasions properties:
can species make a diference? Pp. 163-176 in:
MOONEY, H.A. & J.A.DRAKE (Eds). Ecology of
biological invasions of North America and Hawaii,
Springer-Verlag, New York. 321 pp.
VITOUSEK, P.M. & L.R. WALKER, 1989. Biological
invasion by Myrica faya in Hawaii: plant demography, nitrogen fixation ecosystem effects.
Ecological Monographs 59: 247-265.
WILLIAMS-LINERA, G.&J.TOLOME, 1996. Litter fall template and tropical trees, and climate in a Mexican lower mountain forest. Biotropica 28: 649-656.
ZAR, J.H., 1996. Biostatistical Analysis, 3rd edition.
Prentice Hall International, London, 662 pp.