CHARACTERISATION OF EXUDATES, GROWTH AND PERFORMANCE OF BRASSICA RAPA LINES UNDER CONTROLLED ENVIRONMENT CONDITIONS
AND THE IMPACT OF SOIL MICROORGANISMS ON THE UPTAKE OF PHOSPHATE BY THE PLANT.
by
Ana Catarina Pereira Correia
I CHARACTERISATION OF EXUDATES, GROWTH AND PERFORMANCE OF BRASSICA RAPA LINES UNDER CONTROLLED ENVIRONMENT CONDITIONS
AND THE IMPACT OF SOIL MICROORGANISMS ON THE UPTAKE OF PHOSPHATE BY THE PLANT.
Thesis presented to Escola Superior de Biotecnologia of the Universidade Católica Portuguesa to achieve the Master of Science degree in Microbiology
by
Ana Catarina Pereira Correia
Place: University of Reading, United Kingdom Supervision:
Dr John Hammond - Supervisor Dr Andrew Goodall - Co-Supervisor
III This thesis is dedicated to my family, my mom, dad, brother and my grandparents. Specially to my grandfather José Ferreira Rebelo who left this life while I was 1900 km away from home, working on this. Thanks to them and their sacrifice I had the means to
enjoy all the opportunities to improve my education and personality. Without them I wouldn’t be who I am today!
“We ourselves feel that what we are doing is just a drop in the ocean. But the ocean
would be less because of that missing drop.” By: Madre Teresa de Calcutá
“Never interrupt someone doing something you said couldn’t be done.” By: Amelia Earhart
V Resumo
O fósforo (P) é um nutriente de elevado interesse e procura pelas indústrias agrícolas e um fator limitante nos solos de produções agrícolas como por exemplo Brassica rapa. Porém a presença de P no solo não significa que se encontra disponível para absorção pelas plantas. Para a resolução deste problema, os profissionais recorrem à adição de P nos solos, acabando por levar a problemas de eutrofização, quando este é perdido no meio. As fosfatases excretadas pelas plantas e microrganismos participam numa das reações envolvidas na absorção de P pelas plantas. No caso da indústria agrícola, se não houver uma evolução nos procedimentos aplicados atualmente, com a demanda atual e/ou futura, a escassez de nutrientes nos solos pode tornar-se uma realidade afetando negativamente o sector agrícola. Uma das soluções para contrariar esta corrente é uso de rizobactérias promotoras do crescimento de plantas (PGPR), como Pseudomonas fluorescens, Pseudomonas putida e Flavobacterium johnsoniae.
O objetivo deste trabalho laboratorial foi avaliar a excreção enzimática in vitro de ácido e alcalino fosfatases (AcP e AlP) por três diferentes PGPR (P. fluorescens, P. putida e F. johnsoniae) e pela B. rapa subsp. trilocularis line R-o-18 na presença e ausência de P e a diferentes pHs.
Para a análise da atividade enzimática dos microrganismos e da planta recorreu-se ao uso da técnica de zimografia. O estudo da atividade enzimática foi realizado ao longo de 21 dias de crescimento da planta, em três solos diferentes, dois com P adicionado, como controlos (+) (John Innes no. 3 e solo arenoso) e um sem adição de P, como controlo (-) (solo de turfa e areia), e em Murashige and Skoog (MS) com P adicionado como controlo (+) e sem P adicionado como controlo (-). Os tempos foram avaliados aos 7, 14 e 21 dias. Os resultados mostraram-se significativamente diferentes aos diferentes pHs, e aos diferentes tempos de crescimento (p < 0.05). Contudo, os três solos com e sem adição de P a pH 6.5 e os meios de MS com e sem P adicionado a pHs 6.5 e 11 apresentam resultados não significativamente diferentes de atividade enzimática. A avaliação feita a B. rapa inoculada com as PGPR crescida nos dois diferentes meios MS, apresentam resultados estatisticamente similares entre si.
Em conclusão, pela técnica da zimografia, a análise feita nos primeiros 21 dias de crescimento de B. rapa, a concentrações de P diferentes e com o uso PGPR não afetaram significativamente a secreção enzimática e consequentemente a sua atividade.
VII Abstract
Phosphorus (P) is a nutrient of high interest and demand for agricultural industries and is a limiting factor in the soils to produce plants such as Brassica rapa. However, the presence of P in the soil does not mean that it is available for absorption by plants. In order to solve this problem, the farmers add more phosphorus to the crops, which if lost from the field can lead to eutrophication problems. One of the reactions involved in the uptake of P by plants is related to the phosphatases excreted by plants and microorganisms present in the environment. In the case of the agricultural industry, if there is no evolution in the current procedures used, current and future demands for food will trigger nutrient scarcity in soils, adversely affecting the agricultural sector. One of the solutions to counteract this chain is the use of plant growth promoting rhizobacteria (PGPR), such as Pseudomonas fluorescens, Pseudomonas putida and Flavobacterium johnsoniae.
The objective of this work was to evaluate the in vitro enzymatic excretion of acid and alkaline phosphatases (AcP and AlP) by three different PGPRs (P. fluorescens, P. putida and F. johnsoniae) and by B. rapa subsp. trilocularis line R-o-18 in the presence and absence of P and at different pHs.
For the analysis of the enzymatic activity of microorganisms and plant, zymography technique was used. The study of the enzymatic activity was performed during 21 days of plant growth in three different soils, two with P added, as (+) controls (John Innes no. 3 and sandy soil) and one without P added, as (-) control (peat and sand soil), and Murashige and Skoog (MS) mediums with P added as (+) control and without P added as (-) control. The times were evaluated at 7, 14 and 21 days.
The results were significantly different at different pHs, and at different growth times (p <0.05). However, the three soils with and without addition of P at pH 6.5 and the MS medium with and without P added at pHs 6.5 and 11 presented results non-significantly different of enzymatic activity. The evaluation made to B. rapa inoculated with the PGPR grown in the two different MS mediums presents statistically similar results among themselves.
In conclusion, the analysis made with zymography technique, in the first 21 days of growth of B. rapa, at different concentrations of P and with the use of PGPR did not significantly affect the enzymatic secretion and consequently its activity.
IX Acknowledgments
I would like to thank Dr John Hammond for give me the opportunity to research abroad, to let me do what I love, and for making all this project possible. I also would like to thank Dr Andrew Goodall for help and support me during all my work.
I want to show my gratitude to Professor Paula Castro who guide me to this project and introduce me to the environmental field of microbiology.
To my parents, Maria Pereira and José Rebelo, I want to say my deepest appreciation for everything they did and sacrifice for, in behalf of my education, my health and wellbeing. Without them I would not turn out the person I am today, so for that, my biggest Thank You!
To my brother, my best friend, thank you for not letting me grow old and for value my inner child person, you are one of the best and funniest influences in the way I see the world.
To my former colleagues and now good friends, Maria Sequeira Lopes, Ana Pinto, Beatriz Lemos, Ana Campos and Francisca Coelho who I shared many adventures since we were all freshers at university, thank you for blossoming my character.
To Nelson Carvalho, my Erasmus buddy, my sincere gratitude for help me in my adaptation to the new city, the new house and the new life, without him all this experience would have been harder and unfunnier to go through.
To Tatiana Barbosa my best friend since 5th grade who supported and introduced me to a
lot of boys’ bands along the years and who is currently caring my goddaughter. Thank you for all the years of crazy adventures!
Finally, I want to thank my grandparents, Emilia Correia and José Rebelo, who always showed me that with hard work, soul and sacrifice I could reach my wildest dreams. Thank you for being there for me and for believing in me!
XI Contents Resumo V Abstract VII Acknowledgments IX Figure Index XV
Table list XIX
Abbreviations list XXI
1. Introduction 1
1.1. Overview 1
1.2. The cycle of P 1
1.2.1. The provenience of P in the soil 2
1.2.2. Forms of P present in the soil 2
1.2.3. P in soil 3
1.3. Phosphorus and plants 5
1.4. Phosphatase enzymes 5
1.4.1. Acid phosphatases (AcP) and alkaline phosphatases (AlP) 6
1.5. P dynamics 6
1.6. Plant phosphate uptake 7
1.7. Rhizosphere 8
1.7.1. Microorganisms in the rhizosphere 8
1.8. Soil microorganisms and phosphorus 9
1.9. The plant 10
1.10. Economic importance 11
XII
1.12. Objectives 12
2. Material and Methods 13
2.1. Studied plant 13
2.1.1. Sowing and growth conditions 13
2.2. Soil characteristics 15
2.2.1. Positive control soils 15
2.2.2. Negative control soils 16
2.3. Zymography 17
2.3.1. Standards for calibration curve 17
2.3.1.1. Agarose gel preparation 18
2.3.2. Root analysis 18
2.4. Bacteria 18
2.4.1. Bacteria and culture conditions 18
2.4.2. Bacterial growth conditions before plant inoculation 19
2.4.3. Bacterial inoculation on petri dishes 19
2.5. Fiji image J analysis 20
2.6. Fiji image J setup 20
2.7. Statistical analysis 20
3. Results and Discussion 22
3.1. Soil composition 22
3.2. Zymography 23
3.2.1. Zymography calibration 23
3.2.2. Standards calibration 25
XIII
3.3.1. Plant zymography in rhizoboxes 27
3.3.2. Root zymography in petri dishes 30
3.4. Bacterial zymography 33 3.4.1. Bacterial enumeration 33 3.4.2. Zymography at pH 6.5 33 3.4.3. Zymography at pH 11 36 4. General Conclusions 40 5. Future works 41 6. Appendix 42 7. References 43
XV Figure Index
Number Title Page
1. Introduction
Figure 1.1 Relationship between soil phosphorus compounds and pH (adapted from USDAa, 1999).
3 Figure 1.2 The P cycle and dynamics. Adapted from Shen et al., (2011). 4
2. Materials and methods
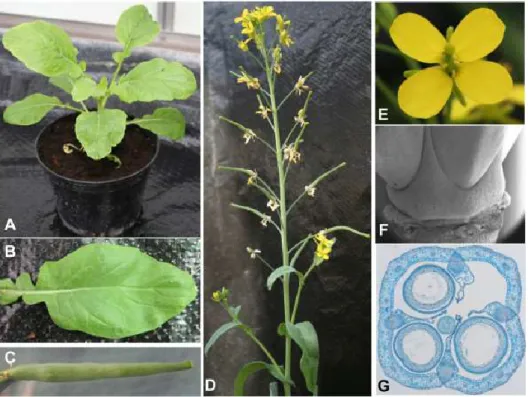
Figure 2.1 B. rapa genotype R-o-18 plant development. A) Seedling three weeks after sowing, B) Fully expanded rosette leaf, C) mature and fully elongated fruit, D) main shoot of flowering R-o-18 plant seven weeks after sowing, E) open flower, F) scanning electron. Adapted from Stephenson et al., 2010.
13
Figure 2.2 Rhizobox assembly scheme adapted from Durand et al., 2016. 15
Figure 2.3 Fiji ImageJ analysis setup. 20
3. Results and Discussion
Figure 3.1 Normalized enzymatic activity (nKat/mm2) calibration curve of 4-MU
concentration (µM) at multiple exposure times (8, 12, 16, 20, 24 s) at pH 10, with respective equation curve and R-square (R2) values for each time of exposure.
24
Figure 3.2 Standards calibration results at pH10. A) exposure time 8 s; B)
exposure time 12 s, at different concentrations of 4-MU (0 µM, 35 µM, 70 µM, 130 µM and 200 µM).
25
Figure 3.3 Results of the normalized enzyme activity (nKat/mm2) at pH 6.5, 10 and
11, for concentrations of 4-MU at 0 µM, 35 µM, 70 µM, 130 µM and 200 µM; with respective equation curve and R-square (R2) values. Values were calculated based on the greyscale image collected at 8 s exposure.
XVI Figure 3.4 Enzymatic activity of B. rapa roots calculated using 4-MU calibration
equations. The analyses were conducted in three different soils, John Innes no. 3 (with P), Sandy soil (with P) and Peat and Sand soil (without P) at pH 6.5. The analysis shows the normalized enzyme activity in nKat/mm2 (represented in the bars) along the growth stages of the plant
(7, 14 and 21 days). All essays were performed in triplicate. The different letters exhibit statistically significant differences (p ≤ 0.05).
27
Figure 3.5 Enzymatic activity of the B. rapa on Fiji ImageJ for the three different soils testes at pH 6.5. It was used an inversion setting, which means the enzymatic activity is indirectly proportional to the clarity of the image. Values were calculated based on the greyscale image collected at 8 s exposure.
29
Figure 3.6 Availability of P to the plant at 7, 14 and 21 days of B. rapa growth in peat and sand soil, analysed by Lancrop Laboratories.
30 Figure 3.7 Zymography results of the enzyme excretion from B. rapa in two
nutrient agars, one for the presence of phosphorus (MS medium > (+) control) and other negative for P (MS medium without phosphorus added > (-) control), both tests were grown at different pH conditions (A) at pH 6.5 and (B) at pH 11. The bars represent the mean of the enzymatic activity in nKat/mm2 along a period of the plant growth (7,
14 and 21 days). All essays were performed in triplicate (n=3).
32
Figure 3.8 Zymography results of B. rapa. inoculated with P. putida, F.
johnsoniae and P. fluorescens at 5 days of growth in a MS medium, without phosphate, and respective (+) and (-) controls, at pH 6.5. The bars represent mean enzymatic activity in nKat/mm2 along the growth
period of the plant (time 7, 14 and 21 days). All essays were performed in triplicate (n=3).
33
Figure 3.9 Results of B. rapa grown at pH 6.5 in MS medium without P, with bacterial inoculation on the 5th day of the plant growth. It was used an inversion setting, which means the enzymatic activity is indirectly proportional to the clarity of the image. Values were calculated based on the greyscale image collected at 8 s exposure.
XVII Figure 3.10 Zymography results of B. rapa. inoculated with P. putida, F. johnsoniae
and P. fluorescens at 5 days of growth in a MS medium without phosphate, and respective (+) and (-) controls, at pH 11. The bars represent the enzymatic activity in nKat/mm2 along the growth period
of the plant (time 7, 14 and 21 days). All essays were performed in triplicate (n=3).
36
Figure 3.11 Results of B. rapa grown at pH 11 in MS medium without P, and with bacterial inoculation on the 5th day of the plant growth. It was used an
inversion setting, which means the enzymatic activity is indirectly proportional to the clarity of the image. Values were calculated based on the greyscale image collected at 8 s exposure.
38
6. Appendix
Figure 6.1 Graphs of normalized integrated intensity associated with the concentration of 4-MU (µM) at different pH (6.5, 10 and 11).
XIX Table list
Number Title Page
2. Materials and methods
Table 2.1 Sandy soil composition analysis of the available nutrients. 15 Table 2.2 Peat and sand soil nutrient composition per litre of soil. 16
Table 2.3 Peat and sand soil composition analysis. 16
Table 2.4 Bacteria species and line, culture medium and growth conditions used in the experiment.
19
3. Results and discussion
XXI Abbreviations list
(+) Control - Positive control (-) Control - Negative control 4-UM - 4-methylumbelliferone AcP - Acid phosphatase
ADP - Adenosine diphosphate Al - Aluminium
AlP - Alkaline phosphatase ATP - Adenosine triphosphate C - Carbon
Ca - Calcium
C.E.C. - Cation Exchange Capacity CFU - Colony-forming units F - Iron
g - G force ha - Hectare
HCl - Hydrochloric acid IGZ - In gel zymography ISZ - In situ zymography IVZ - In vivo zymography K - Potassium
LA - Luria Broth with agar LB - Luria broth
meq - Milliequivalent Mg - Magnesium
MMA - Minimal medium A
MS - Murashige and Skoog Basal Medium Mt - Mega tonnes
MUB - Modified Universal Buffer MUP - 4-methyllumbelliferylphosphate N - Nitrogen
NaCl - Sodium chloride nKat – Nanokatal
XXII P - Phosphorus
PGPR - Plant growth promoting rhizobacteria PHT1 - Phosphate transporter gene
Pi - inorganic phosphate Po - organic phosphate Ppm - parts per million
PUE - Phosphorus use efficiency S - Sulphur
SOM - Soil organic matter UV - Ultraviolet
- 1 - 1. Introduction
1.1. Overview
Phosphorus (P) availability in the soil is important for maintaining food supplies. As the population grows the food demand increases and directly the demand for P by the global crop production industries. Despite the presence of P in soil, the P uptake by the plant represents a limiting factor in obtaining the best yields in agricultural plantations (Van de Wiel et al., 2016). The presence of P in soil does not mean that it will be completely available for plant uptake due to the phosphate-fixing by the soil (Xie et al., 2015; Van de Wiel et al., 2016). Therefore, farmers tend to use more inorganic P fertilizers to guarantee the P uptake by the plants during the growing season. However, only 50% of the P applied to the soil is really used by the plants (Van de Wiel et al., 2016; Hasan et al., 2016).
Currently, inorganic P fertilizers used for crops and pastures are mainly acquired from non-renewable resources, which starts to make agriculture a non-sustainable activity (Van de Wield et al., 2016). Although there is currently no shortage, continued use and demand for P will trigger the "phosphorus peak" (which is estimated between 2030-2100) and consequently the rise in costs of inorganic P fertilisers (Van de Wield et al., 2016; Baker et al., 2015).
As a global prospective of the industrialized countries, in the year 2000, the P inputs, such as manures and fertilizers were up to 31 Mt/year, with estimated outputs of just 19 Mt/year meaning that there is an excessive use of 12 Mt of P per year, with a P surplus forecast to 18 Mt/year by 2050 (Owen et al., 2015).
Another problem related to the excessive phosphorus use, is the impact in the environment once the P reaches natural watercourses. The water contamination by phosphate can lead to eutrophication which causes an imbalance in the aquatic ecosystem (Torrent and Delgado, 2001).
Just in the UK, it is estimated that 2-3 t of phosphate per million people/day enters watercourses and are lost in the environment. Losses of phosphate to the environment represent misapplied money in fertilizers, and annually is estimated that £22 million are lost to the environment through excessive fertilization in the UK (Baker et al., 2015). 1.2. The cycle of P
P is the eleventh most abundant element in the planet and represents up to ~0.7% of the earth’s crust. By itself it cannot be found in nature because of the highly reactive
- 2 - characteristics, and for this reason it is present in the form of phosphate in biological systems (Owen et al., 2015; Iheagwara et al., 2013).
1.2.1. The provenience of P in the soil
In the soil, P have two sources, the native phosphate which derives from the release of phosphate to the soil solution by natural weathering from the primary minerals; and the legacy phosphate, that result by the accumulation of phosphate from human inputs like fertiliser and manure from past fertilization (Owen et al., 2015). The phosphate from the legacy form is one of the most large global source of P, being more available to the plant, than the native form. Also, this form of P was recognised as the most distinct and major form of eutrophication problems in water ecosystems (Rowe, 2015).
1.2.2. Forms of P present in the soil
The presence of P in the soil is mainly held in inorganic (Pi) and organic (Po) forms of phosphate, and the bioavailability of P to the plant varies with the degree of stability and solubility of Pi and Po. The Pi is found in P-solution, but it is also coupled with oxides of Fe, Ca and Al in the clay fraction by adsorption. With these oxides the adsorption process becomes weaker (labile P) or stronger (moderately labile P) when precipitated with Fe, Ca and Al, establishes insoluble forms (non-labile P). The Po is formed due to phosphate ions bonded to C moieties, and the lability related with the organic moiety (linked to the phosphate) decomposition susceptibility (Costa et al., 2016).
Organic P is responsible for 30 to 65% of total P in the soil, and mainly represented by simple phosphomonoesters and phosphodiesters (<90%) or phytate (<50%) (Lidbury et al., 2017).
Labile and non-labile P can be distinguished by their availability. Non-labile P is referred to slowly available forms of P, whereas labile P is referred to an intermediate form rather weakly adsorbed or bounded to clay or soil compounds.
The equilibrium between labile and non-labile is balanced by several factors such as soil temperature and pH, size of the slowly available pools, compound in soil and amount of clay (USDAa, 1999).
- 3 - Figure 1.1: Relationship between soil phosphorus compounds and pH (adapted from USDAa, 1999).
When there is soluble P in the soil solution and it starts to revert into insoluble or slowly soluble forms, reaching a phase where the soluble P is being removed from the soil solution, there is a fixation phenomenon occurring. Fixation is the capture of ions among the internal layers of soils particles or clay minerals (Okuda, 1959). As a way of limiting fixation, P fertiliser placements can be the limiting answer. Placing P fertilizers near to the seeds will limit the contact between the soil and the fertilizer and increase the probability of root contact with the fertilizer (USDAb, 1999).
1.2.3. P in soil
The data of optimal concentration of P in the soil show to be scarce and inconsistent, however in arable and fertile soils the concentration of P is generally quite high, with values between 400 and 1200 mg/kg of soil (Matula, 2011; Glick, 2012).
There are three main factors responsible for the P availability to plants, such as soil pH, quantity of organic matter, and the P fertilization placement. The soil pH is a very important factor, with low pH values causing P deficiency in soils even with high concentrations of total P. The soils with a pH between 7.5 and 8.5 or lower than 5.5 results in a reduction of P availability to the plant due to the fixation by Al, Fe and Ca, since in alkaline soils, P bounds to Ca and in acid soils P bounds to Al and Fe. The ideal value of pH for P availability is between 6 and 7.5 (Aguiar et al., 2013; USDAb, 1999).
- 4 - The soil organic matter (SOM) plays an important role in the soil productivity and the is major source of organic P. In organic pools, the P is highly protected from fixation when compared with inorganic pools. The P fertilization placement aggregates both soil pH and SOM conditions, which means that soils with low pH and fertilised can still show low levels of P availability due to the fixation by certain mineral (present in inorganic pools). This shows that SOM and P are associated and can be used to predict soil modifications and prevent inadequate crop management since they are related with the reduction of P availability and consequently that lack in productivity and soil quality (Aguiar et al., 2013).
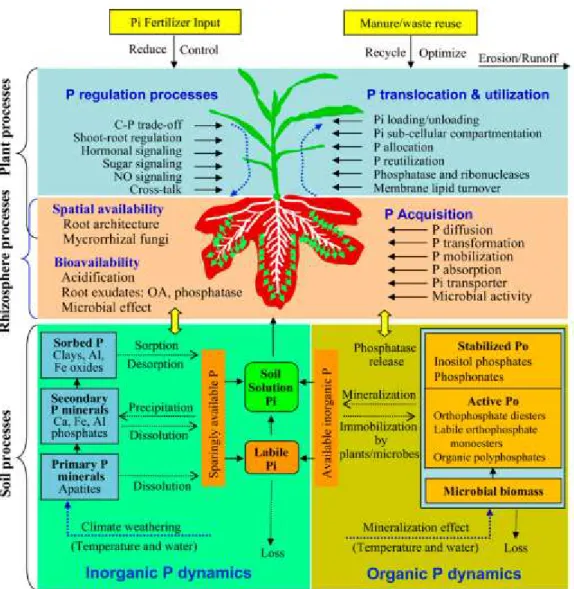
Figure 1.2.: The P cycle and dynamics. Adapted from Shen et al., (2011).
The P cycle, represented in Figure 1.2, shows that P can be added to a mineral soil solution by fertilisation, manure or residue application. Once in the soil, P is found primarily as Po (associated with humus), in insoluble or non-labile forms of P, and as
- 5 - plant-available P. Once in the soil, P can be removed by two pathways, by plant uptake or by erosion (Neitsch et al., 2011).
1.3. Phosphorus and plants
There are 17 nutrients that are essential for the plant growth. They are divided in macronutrients and micronutrients. Inside macronutrients, the elements can be classified as “primary” or “secondary” based on the frequency of the element’s shortage, which is the case of N, P and K (“primary”) deficiencies that are more common than the “secondary” macronutrients like Ca, Mg and S. In their elemental form, nutrients cannot be taken up by the plants, first the elements need to be converted into an ionic or charged form (Jones and Olson-Rutz, 2016).
For plants, P is a vital macronutrient for growth, and participates in several biological processes along plant development such as nucleic acid structure, synthesis of proteins and membranes and is one important element in the development of tissue and in cell division (Hasan et al., 2016; USDAa, 1999).
Satisfactory concentrations of P boost the plant by vigorously improve root and shoot growth, by increase water use efficiency and by promoting early maturity.
Nutrient uptake by plants is reliant on nutrient concentration in the soil surrounding the roots and on roots capacity to absorb nutrients.
P is known as a mobile nutrient in the plant but immobile in the soil, and for this reason needs to be fertilized as close to the plant as possible (Jones and Olson-Rutz, 2016). Symptoms of phosphorus scarcity are more common in young plants due to the small root system. Deficiencies symptoms can be triggered by environmental and cultural factors such as cool temperatures, humidity, texture, herbicide and insect damage, salinity and root pruning with cultivators or side-dressing knives, and lead to reduced yields due to delay maturity, inhibiting growth and limiting the energy use by the plant (USDAb, 1999).
1.4. Phosphatase enzymes
Enzymes are proteins with a three-dimensional globular form. Functionally, enzymes can increase the speed rate of a certain chemical reaction. For this reason, enzymes are referred as biological catalysts (Bull, 2002).
Phosphatases are enzymes capable to mediate the conversion of organic P into available phosphate. These enzymes are produced by several organisms like bacteria, fungi and
- 6 - plants, and are linked to the demand from plants and microorganisms for P, to the organic P availability and to the soil limitations of P. Phosphatases can be present in the soil as intracellular (inside living cells) or extracellular (secretion of living cells) phosphatases (Margalef et al., 2017).
There are two types of phosphatases, the acid phosphatase (AcP) and alkaline phosphatase (AlP), which varies with the soil’s pH (Eichler, 2004).
Acid and alkaline phosphatases, along with phytate and nucleases belong to a group of enzymes that involve a varied range of structures and reaction mechanisms named phosphomonoesterases (Fraser et al., 2015).
1.4.1. Acid phosphatases (AcP) and alkaline phosphatases (AlP)
AcP is very widespread in nature, being easily found in many species of animals, plants roots, fungi, mycorrhizal fungi and bacteria. Under acidic conditions, AcP’s can catalyse the hydrolysis of orthophosphate monoesters (Eichler et al., 2004). AlP can be found in many species of soil microorganisms and fauna, while higher plants are devoid of AlP (Eichler et al., 2004).
1.5. P dynamics
An important mechanism for the plant to increase the solubility of P (and consequently the concentration of phosphate in the soil), is the exudation of proton and organic acids which release phosphate bound to other ions such as Fe and Al (Mucha et al., 2005; Neumann and Römheld, 1999).
Organic acids, such as citric, malic and oxalic acids are associated with processes that occur in the rhizosphere like, nutrient acquisition, metal detoxification, mineral weathering, microbial attraction and relief of anaerobic stress in roots (Mucha et al., 2005).
Root induced acidification (Ca-P) or alkalinisation (Al-P, Fe-P) can increase P solubility in the rhizosphere. AcP activity in the rhizosphere are connected with the hydrolysis of organic P fractions. Carboxylic acids mainly found in root exudates, are capable to mobilize P by ligand exchange, dissolution and occupation of P sorption sites (Neumann and Römheld, 1999).
Large amounts of protons, phosphate, dicalcium phosphate released by fertilizers (that include monocalcium phosphate in the formula) can generate a P-saturated patch, due to the physicochemical properties. Three different reaction zones are created due to the
P-- 7 P-- saturated patch, such as direct reaction, precipitation reaction and adsorption reaction zones. The direct reaction zone is known as a very acid zone, with a pH between 1.0 and 1.6, which results in an improved mobilization of metal ions in soil. In soils with high concentration of Pi, the metal ions present react with Pi causing precipitation. Therefore, the Fe-P and Al-P form previously (amorphous), become partially available to plants. Once there is a low concentration of Pi in the soil, the adsorption mineral prevails in the outer zone (Shen et al., 2011).
1.6. Plant phosphate uptake
The phosphate uptake by the plant is made in the form of orthophosphate (H2PO42- or
H2PO4-). Once the phosphate is in the soil solution, the plant will excrete phosphatases
(extracellular enzymes) that are designated to perform the mineralization of Po to orthophosphate (Fraser et al., 2015). Other than mineralization/immobilization (by biological transformations) the conversion to orthophosphate can occur in distinct processes, such as dissolution/precipitation (by mineral equilibrium) and sorption/desorption (by interaction between the Pi particles and the minerals surface) mechanisms (Costa et al., 2016; Owen et al., 2015). However, when the conditions change, and the presence of phosphate is low, the plant will excrete phosphatase enzymes with more regularity due to the lack of P availability, as a way of surviving. (Robinson et al., 2012; USDAa, 1999).
Phosphate enters in the plant through phosphate transporter (PHT1 protein) located in the plasma membrane and is transported within the plant cell through other organelles like chloroplast, mitochondria or golgi (by PHT2,3 or 4 proteins) (Rouached et al., 2010). Depending on the pH of the soil, the phosphate will be present in two essential forms, HPO42- or H2PO4-. The phosphate is transported into the epidermal cortical cells of the
root through proton -phosphate co-transport mechanism (Baker et al., 2015).
The genes for PHT1 family are found to be expressed in roots, primarily in epidermal cells and in the outer cortex of the root hair (Baker et al., 2015).
As a major nutrient, phosphorus enters in the plant (as orthophosphate) by the root hairs and tips or by the outermost layers and is stored in the root cells or transported to the upper parts of the plant. Once inside the plant, the orthophosphate is assimilated as organic compounds like nucleic acids, phospholipids, phosphoproteins, enzymes, sugar phosphates and energy-rich phosphate compounds such as adenosine tri and diphosphate (ATP and ADP) where plays a vital role in the chemical structure of the molecule.
- 8 - When the plant is under phosphorus scarcity a range of problems can emerge due to the important role that P plays in the plant biology. Therefore, when there is a limiting amount of P in the soil, the plant will be affected in the development of the leaves (Schachtman, et al., 1998).
1.7. Rhizosphere
All the interactions between the plants and the microorganisms occur in the rhizosphere. The rhizosphere is a narrow region of soil where roots are located. This soil region is normally influenced by the roots secretions and associated with interactions between the roots and microorganisms. The rhizosphere is divided in three different zones, the endorhizosphere, which includes the endodermis and the cortical layers of the root tissues; the rhizoplane, which includes the mucilage and the epidermis of the root surface; and the ectorhizosphere which is the soil surrounding the plant roots. The rhizosphere is highly related to root exudations, being these exudations responsible for the major source of organic carbon released in the soil by the plant (rhizodeposition). The exudations normally are constituted by carbon compounds (mainly), inorganic acids, ions, oxygen and water. When present in the soil, the root exudates can mediate the interactions in the rhizosphere in a positive or negative way. The positive interactions are for example the symbiotic associations with beneficial microorganisms such as plant growth promoting rhizobacteria (PGPR); and negative interactions, for example the association of the plant roots with pathogenic microorganisms, parasitic plants, etc (Badri and Vivanco, 2009, Beneduzi et al., 2012).
1.7.1. Microorganisms in the rhizosphere
The rhizosphere, compared to the bulk soil has a higher number of microorganisms, including bacteria, fungi, protozoa, actinomycetes and algae (10-100 times higher than the bulk soil) due to the high nutritional value (energy and nutrients) provided by the plant exudates, like sugars, amino acids, organic acids, and other small molecules from plant root (Beneduzi et al., 2012).
As is currently known, the microorganism that is more common in the soil are the bacteria, corresponding to 95% (around 108 to 109 cells/g of soil). However, from these numerous cells only about 1% of the total cell are culturable (Glick, 2012).
- 9 - Rhizobacteria is the name given to microorganisms that populate the rhizosphere. Rhizobacteria are normally classified as positive, negative or neutral influencers in the plant growth (Beneduzi et al., 2012).
Plant growth promoting rhizobacteria (PGPR) normally colonize the radicular tissues of the roots, the soil surrounding the root and the root surface (rhizoplane) and are classified as positives influencers in the plant growth. The plant growth promoting can occur in two different ways, the direct form is when the bacteria synthesize a compound for the plant like phytohormones or by just assisting in the uptake of nutrients from the soil. The indirect way is when the rhizobacteria help in the prevention of other pathogenic organisms from harming the plant by increasing the resistance to these pathogens or by producing antagonist substances (Beneduzi et al., 2012). Through the existence of several bacterial genera of PGPR, the most predominate PGPR already identified are the Bacillus spp. and Pseudomonas spp. (Beneduzi et al., 2012).
1.8. Soil microorganisms and phosphorus
Beside the plant, microorganisms have mechanisms capable of P solubilization, and these mechanisms include the release of protons (by soil pH modulation), organic ligands (by iron and aluminium cation chelation) and extracellular phosphatases (organic mineralization) releasement by both plants and microorganisms (Spohn et al., 2015). Depending on the soil pH, some microorganisms have the capacity of produce acid and alkaline phosphatases, while the plants can only produce acid phosphatases. Beside the phosphatases, microorganisms can also secret phytases, phosphonatases, nucleases and phosphodiesterases that can enrich the soil fertility by promoting the mineralization of organic P into inorganic P (Lidbury et al., 2017).
The difference between plant phosphatases and microbial phosphatases is that the first one is only capable of organic P mineralization, while the microbial phosphatases can perform the P mineralization and dephosphorylation of compounds, available as carbon sources (Spohn et al., 2015). For this reason, the microorganisms can be beneficial organisms for the soil P fertilization. Some examples of soil microorganisms are Pseudomonas fluorescens, Flavobacterium johnsoniae and Pseudomonas putida. Pseudomonas fluorescens is a strict aerobe (except for some strains, which can use NO3
instead of O2 as an electron acceptor), gram-negative, rod-shaped, non-pathogenic
saprophyte bacteria, present commonly in distinct environments such as soil, water and plants. P. fluorescens has the capacity to secret fluorescein, which is a soluble greenish
- 10 - fluorescent pigment and can produce extracellular alkaline phosphatases (Ganeshan and Kumar, 2007; Sakurai et al., 2008).
Pseudomonas putida is an aerobe, gram-negative, rod-shaped and low virulence pathogenic bacteria. Generally, it is found in environments like agricultural soils and water. Some characteristics of these microorganisms are the ability to grow rapidly in vitro, the capacity to use exudates from seeds and roots, the fast colonization and multiplication in the rhizosphere, spermosphere and in the interior of the plant, the competition with other microorganisms, the production of bioactive metabolites like growth- promoting substances, the adaptation to stress environments and the excretion of large numbers of proteins like alkaline phosphatases (Putker et al., 2013; Georgieva et al., 2014).
Flavobacterium johnsoniae is an aerobe, gram-negative and rod-shaped bacteria. These bacteria can produce a yellow pigment that colour the rods, and form acid from different sugars. These bacteria can be found in a variety of environmental sources like soil, freshwater, sea ice and sediments. Some species of Flavobacterium are pathogenic to humans and fish (Bernardet et al., 1996; Manfredi et al., 1999; Suebsing and Kim, 2012). Enzymatically some species of Flavobacterium spp. produce acid phosphatases and alkaline phosphatases (Faisal et al., 2011).
1.9. The plant
Brassica rapa is a plant that belongs to the Cruciferae/Brassicaceae family also known as the mustard family (Canadian Food Inspection Agency, 2014). Being one of the most valuable crops for bioenergy, vegetable oil and fodder, B. rapa is a diploid specie (2n = 20; genome composition AA) (Zhao, 2015). B. rapa can be defined in three groups depending on the diversity of the morphological characteristics such as, the oil type (yellow sarson), related with the production of canola oil, known to have low erucic acid and low glucosinolate in the meal protein; the leafy type, that includes the B. rapa mainly grown in China, such as, Chinese turnip rape (ssp. rapa), Pak choi (ssp. chinensis), Chinese cabbage (spp. pekinensis) and Tendergreen (ssp. perviridis); and finally the rapiferous/turnip type, comprehend the rapifera (turnip and rapini) and the ruvo (turnip broccoli, Italian turnip) groups, having the vegetables and turnips that are very important, in many parts of the world, as a supply in sheep and cattle diet (Canadian Food Inspection Agency, 2014; Jan et al., 2017; Mun et al., 2015; Zhao, 2015).
- 11 - B. rapa can be also subdivided by their form, into India forms such as B. rapa ssp. trilocularis (also known as yellow sarson) and spp. dichotoma (known as toria and brown sarson); and into western European and north American form, such as B. rapa ssp. oleifera (Canadian Food Inspection Agency, 2014 and Jan et al., 2017). The Indian forms of B. rapa can be grown in various environmental conditions, like in irrigate or dry soils and as a simple or intercrop system (Jan et al., 2017).
1.10 Economic importance
Related to the world economic importance, Brassica species correspond up to 10% of the vegetable crops plantation and up to 12% of the edible oil supplies. Between the most important species, B. napus and B. juncea (Indian mustard, predominant in the Indian subcontinent) are related to the production of canola oil, B. rapa and B. oleracea are sources of vegetable cole crops and B. nigra as a source of mustard condiment (Mun et al., 2015).
1.11. Potential solutions to improve sustainable production of crops
A possible solution to improve sustainable production of crops is by improve fertiliser management to reduce soil P accumulation and the subsequent loses to the environment leading to eutrophication. To introduce these practices, the transmission of fertilisers recommendations to farmers need to become a common practice worldwide to optimize fertilizer doses to a desired yield, without impacting the environment and to ensure good soil management and nutrient efficiency (Tóth et al., 2014).
Improved phosphorus use efficiency (PUE) of crops can help in reducing P fertiliser inputs. The PUE can be enhanced by increasing the plant breeding, by genetic means. A plant with a higher PUE will use more residual soil P, which will help the decreasing of high concentrations of P in the soil due to intensive fertilisation (Van de Wiel et al., 2016). Other solutions could be the recycling of phosphate from several sources like wastewater and manures. Precise fertilisation can be other answer, where basically the fertilisation occurs based on soil parameters to the plant phosphate availability (Van de Wiel et al., 2016). Inoculation of the soils with specific PGPR can be other solution to improve P availability in the plant (Souza et al., 2015).
Related to the use of PGPR, currently known that bacteria can improve the plant growth. A large varieties of soil bacteria are able to solubilize the Pi due to the production and activity of low molecular weight organic acids, such as gluconic acid and citric acid.
- 12 - Regarding the mineralization of Po, certain bacteria can excrete various phosphatases that catalyse the hydrolysis of phosphoric esters. Some bacterial strains are able to perform both mineralisation and solubilisation of phosphate (Glick, 2012).
1.12. Objectives
The aim of this work is to evaluate selected PGPR and their enzyme excretion in their rhizosphere of B. rapa using in vitro models with P shortage to understand if these bacteria could help the plant growth.
- 13 - 2 Material and Methods
2.1. Studied plant
Brassica rapa subsp. trilocularis line R-o-18, a rapid cycling Yellow Sarson and Indian Colza line was used for all experiments (USDA, 2018 and Stephenson et al., 2010). The strain used, R-o-18, presents rapid cycling, high female fertility, lack of seed dormancy and rapid seed maturation, which allows the productions of large seed stocks (Stephenson et al., 2010; Slankster et al., 2012).
Figure 2.1: B. rapa genotype R-o-18 plant development. A) Seedling three weeks after sowing, B) Fully expanded rosette leaf, C) mature and fully elongated fruit, D) main shoot of flowering R-o-18 plant seven weeks after sowing, E) open flower, F) scanning electron. Adapted from Stephenson et al., 2010.
2.1.1. Sowing and growth conditions
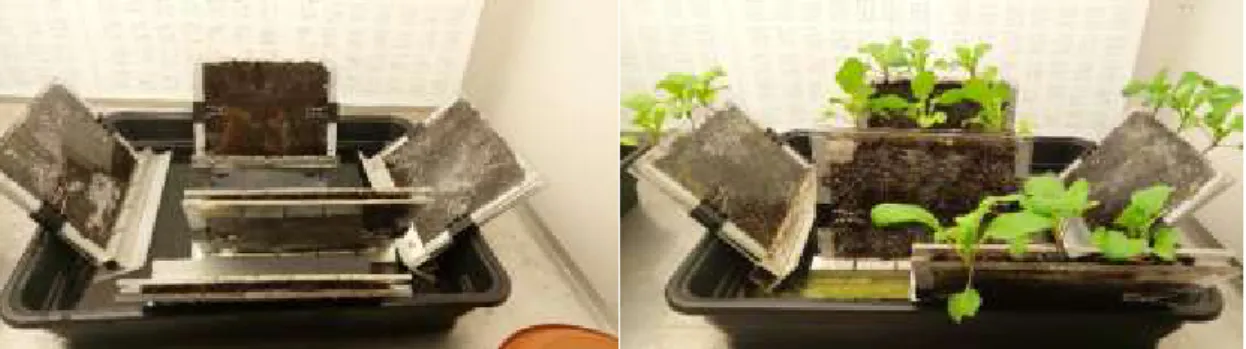
Two growing methods were used. The first method involved the placement of two seeds of B. rapa on top of rhizoboxes, being watered afterward with deionized water. The plants were grown for 21 days and the tests were performed on days 7, 14 and 21, and the soil kept moist for all the 21 days. The rhizobox by itself is a limited layer of soil between two transparent plates, with closed sides, to allow the visualization of the plant growth and the watering without soil loss. Details of soils used, and environmental parameters are given below.
- 14 - For the second method used petri dishes (23cm x 23cm) with Murashige and Skoog Basal Medium (MS) as a positive control and MS medium without added phosphate as a negative control, where the KH2PO4 from the recipe was replaced by KCl, so it could be
creating a phosphate depletion condition on the plants.
The MS medium is composed by 20.6147 mM NH4NO3, 18.7933 mM KNO3, 2.2599 mM
CaCl2, 1.5008 mM MgSO4.7H2O, 1.2491 mM KH2PO4, 0.1003 mM H3BO3, 0.10010 mM
Na2EDTA.2H2O, 0.1000 mM FeSO4.7H2O, 0.1000 mM MnSO4.H2O, 0.0299 mM
ZnSO4.7H2O, 0.0050 mM KI, 0.00103 mM Na2MoO4.2H2O, 0.00011 mM CoCl2.6H2O,
0.00010 mM CuSO4.5H2O. For the preparation it was weight the compounds and then
added 800 ml of deionised water, the pH was changed to 5.6 with 1 M of NaOH and the solution made up to 1 L. To the 1 L solution it was added 8 g of agar and the solution was afterwards, autoclaved.
The plants were grown for 21 days and the tests were performed on days 7, 14 and 21. The petri dishes were closed with parafilm through the 21 days.
The plants were sow and grown in both petri dishes and rhizoboxes and then stored in a growth room at 16.0ºC with a 60 % of humidity, for all the growth period and with a 63 cm distance from the light bulbs.
- 15 - Figure 2.2: Rhizobox assembly scheme adapted from Durand et al., 2016.
2.2. Soil characteristics 2.2.1. Positive control soils
For the plant growth in the rhizoboxes two different soils were used as positive controls. The first soil used was commercial soil named John Innes no. 3 that is described in Gardening data (2018). The second soil used was a sandy soil, composed by horticultural sand and loam, with the following composition as analysed by Lancrop Laboratories (York, UK) (Table 2.1).
Table 2.1: Sandy soil composition analysis of the available nutrients.
Analysis Results pH 7.20 Phosphorus (ppm) 29.00 Potassium (ppm) 105.00 Magnesium (ppm) 62.00 Calcium (ppm) 826.00 Sulphur (ppm) 32.00 Manganese (ppm) 21.00 Copper (ppm) 3.00 Boron (ppm) 0.92 Zinc (ppm) 3.80 Molybdenum (ppm) 0.03 Iron (ppm) 527.00 Sodium (ppm) 27.00
- 16 - 2.2.2. Negative control soils
As negative control soil, it was used a peat (Clover, Dungannon, UK) and horticultural sand soil, composed with 70% peat and 30% sand with the addition of specific nutrients (Table 2.2)
Table 2.2: Peat and sand soil nutrient composition per litre of soil.
Nutrients g/L compost
Ammonium nitrate 0.400
Potassium nitrate 0.745
Ground limestone 2.250
Ground magnesium limestone 2.250 Fritted trace elements 0.400
The soil composition was analysed by Lancrop Laboratories (York, UK) and is described in the Table 2.3.
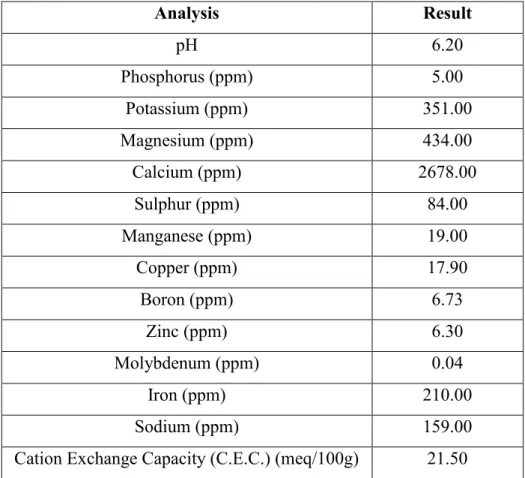
Table 2.3: Peat and sand soil composition analysis.
Analysis Result pH 6.20 Phosphorus (ppm) 5.00 Potassium (ppm) 351.00 Magnesium (ppm) 434.00 Calcium (ppm) 2678.00 Sulphur (ppm) 84.00 Manganese (ppm) 19.00 Copper (ppm) 17.90 Boron (ppm) 6.73 Zinc (ppm) 6.30 Molybdenum (ppm) 0.04 Iron (ppm) 210.00 Sodium (ppm) 159.00
- 17 - 2.3. Zymography
For the zymography, a solution of Modified Universal Buffer (MUB) was prepared according to Giles et at. (2018) with slight modifications. For 1 L of MUB stock, 12.6 g boric acid, 28 g citric acid, 23.2 g maleic acid, 24.2 g trizma base and 39 g sodium hydroxide were added to deionised water and made up to 1L.
The MUB was prepared fresh each time, at a working concentration of 40 mM from the MUB stock prepared previously, by adding 100 mL of MUB stock to 300 mL of deionized water. The pH was adjusted to 6.5, 10 and 11 with 1 M HCl and 1 M NaCl, respectively and the solution was adjusted to 500mL with deionized water.
The pH’s were adjusted to different values (6.5, 10 and 11) in order to establish the standard calibration, to evaluate the impact of the pH in the phosphatase activity from the plants grown in the rhizoboxes (at pH 6.5) and on the petri dishes (at pH 6.5 and 11) with and without bacterial inoculation.
2.3.1. Standards for calibration curve
To prepared standards for the calibration curve, nylon membrane filters (Whatman - GE Healthcare Life Sciences) (1 cm x 2 cm) were soaked in a MUB and 4-methylumbelliferone (4-MU) solution. The 4-MU solution was prepared according to Giles et al. (2018), dissolving 9.91 mg of 4-MU in 5 mL of methanol and added afterward MUB until the total solution achieves the 50 mL. This was then diluted to prepare solutions with 4-MU concentrations of 200 µM, 130 µM, 70 µM, 35 µM and 0 µM (just the MUB). The nylon filters were then soaked in these solutions. The filters were weighted before and after the soaking. The soaking step was made in falcon tubes with 5 ml of the soaking solutions for 40 min in the absence of light. After soaking, the filters were dried for 10 min at 30 ºC and again weighted (all these steps were performed in the dark). Afterward the filters were visualized and photographed under the UV light. The universal buffer (MUB) was used as a way of normalizing the pH and the ionic conditions for the calibration and assay. For the calibration 4-MU was used, the 4-MU able modifications in the protonation state of the compound. These changes are reflected in the fluorescence intensity. The methanol used able the solubilization of 4-MU at alkaline and acid pH (Giles et al., 2018).
The agarose gel was used to promote the diffusion of the phosphatase enzymes from the soil to the soaked membrane.
- 18 - The agarose by itself create tight bonds with large diameters. The percentage of agarose in a solution affects directly the enzyme support and interaction, meaning that higher percentages of agarose imply higher support for the enzymes. This can be explained because the diameter of the pores is smaller when the agarose percentage is larger, and for this reason 1% agarose was used since the agarose was used as a diffusion membrane for the enzymes (Zucca, 2016).
2.3.1.1. Agarose gel preparation
The agarose gel used in this study was prepared at 1% (w/v), by dissolving the agarose in with 40 mM MUB of the stock solution, according to Giles et al. (2018).
The gel thickness used for the zymography was determined by the dimensions of the shape used to create the agarose membrane, and this being just thick enough to work with. 2.3.2. Root analysis
To analyse enzyme activity on the roots of growing B. rapa plants, the following solution was prepared by dissolving 90 mg of 4-methyllumbelliferylphosphate (MUP) in 40 mM MUB and making up to a volume of 50 mL in a dark flask. Nylon filters (9 cm diameter) were then soaked in the dark for 10 min. After soaking, the filter membranes were dried for 10 min at 30 ºC and then placed on top of an agarose gel that was already set in the rhizobox. Each membrane was only used for a single root. The set up rhizobox with the agarose and membranes were stored in the dark for 40 min at 20 ºC so the reaction between the enzymes secreted by the plant and the substrate in the filter membrane could occur. Afterward, the filters were dried for 4 min in a 30 ºC in a dark oven and then observed and photographed under the UV light (Giles et al., 2018).
2.4. Bacteria
2.4.1. Bacteria and culture conditions
The bacteria’s used on this experiment and their growth conditions are described in the Table 2.4.
- 19 - Table 2.4.: Bacteria species and line, culture medium and growth conditions used in the experiment.
Microorganism Media Incubation conditions
Flavobacterium johnsoniae DSM2064 Luria (L) Aerobic, 30ºC Pseudomonas fluorescens SWB25 Luria (L) Aerobic, 30ºC Pseudomonas putida BIRD-1 Luria (L) Aerobic, 30ºC 2.4.2. Bacterial growth conditions before plant inoculation
All the bacteria were stored in LB (Luria broth) with glycerol with 1:1 proportion, at -80 ºC. New cultures were made from the stored bacteria by inoculating in LB at 30 ºC for 24 h with 200 rpm. This was then spread on LA (Luria agar) and grown for 2 days at 30ºC, (Munna et al., 2015; Donnarumma et al., 2010; Bernardet and Bowman, 2015).
For 1 L of LB solution it was measured 25g of LB powder, added deionized water until fulfil 1 L, and then autoclaved. For the preparation of 1 L of LA it was weighted 25g of LB and 15g of agar, then added deionized water fulfilling the 1 L and autoclaved. 2.4.3. Bacterial inoculation on petri dishes
On the fifth day of growth, the plants were inoculated with the bacteria’s mentioned in the section 2.4.1. The inoculation was made under sterile conditions. For this step single colonies for the microorganisms were grown over night in LB. They were then centrifugation at 3763 x g for 10 min and the supernatant removed. A minimal medium A (MMA) was used to suspend the bacterial inoculum after the centrifugation. For 1 L of MMA preparation, a stock solution was prepared with 35 g NH4Cl, 40g MgSO4:7H2O,
30g KCl, 20g NaCl and 12g CaCl and autoclaved. After autoclaving 2g FeSO4 and 2g
MnSO4 were added. Finally, 10 mL filter sterilised 1M HEPES (pH 7.2) was added, and
the pH of the solution regulated with NaOH. For each petri dish (23 cm x 23 cm) with two plants, 1 mL of the bacterial suspension was added and then spread through the whole petri dish.
The colony-forming units per mL (CFU/mL) were measured for every bacterial suspension with the drop plate method. For this technique it was used peptone water for the dilutions.
- 20 - 2.5. Fiji image J analysis
The photographed images obtain under the UV light were process through Fiji ImageJ modified with python scripts and plugins that enable the measure of radial intensity profiles. The Fiji ImageJ program was downloaded from imagej.net/Fiji/Downloads and for the plugins reading it was used Python and SciPy library (Giles et al., 2018).
Python 3.4.4 was downloaded from www.python.org. After the python was installed, a command prompt was created inside the scripts folder (inside the python dossier). The SciPy library was then installed through pip (installed simultaneously with python). After python and SciPy were installed the name of the java folder (inside Fiji.app) was changed (to for example: java-old), and the radial profile plugin was installed into the plugins file, downloaded from: imagej.nih.gov/ij/plugins/radial-profile.html as Radial_Profile.class. 2.6. Fiji image J setup
Fiji ImageJ was used to conduct the analysis of the image. For the analysis, the image was set to “8-bit”, the filters were inverted, scaled (60 pixels/cm) and the colour changed to “Gem” (through the “LUT” on the look up table). To determine the enzyme activity the “Radial Profile” option was used, found on the “Plugins” bar.
Figure 2.3: Fiji ImageJ analysis setup.
2.7. Statistical analysis
For the data analysis IBM SPSS software (24.0.0.0, IBM, Chicago, USA) was used. As a way of simplifying the data analysis, the data was transformed using log10. To evaluate the normality of the distributions the Shapiro-Wilk test was used. As the data followed a normal distribution, the means of the samples throughout the assay were compared, using
- 21 - Repeated Measures ANOVA coupled with Turkey’s post-hoc test with differences being marked as significant for a confidence level of 95%. The independent variables, pH and time from the different samples were evaluated by the different enzymatic outputs, with the different treatments applied and compared through the F value for the two different studies, with and without bacterial inoculation.
- 22 - 3. Results and Discussion
3.1. Soil composition
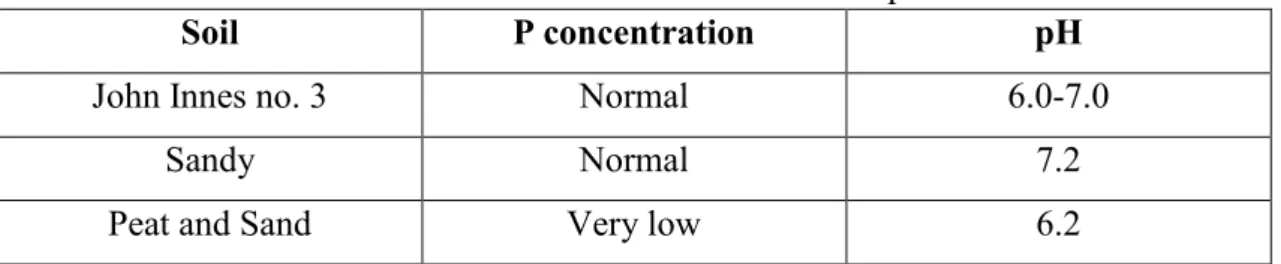
The soils used for the rhizobox experiment comprehend two positive soils, with normal values of P and a third soil, a negative soil with very low values of P concentrations, that leads to scarcity conditions, allowing the comparison of the enzymatic response by the plant when in different conditions.
Table 3.1: Soil characteristics relative to P concentration and pH.
Two different soils were used as (+) controls as they had normal concentrations of phosphate in their mixture (Table 3.1). John Innes no. 3 was a commercial compost and richest in nutrients, in the composition is found superphosphate added to the mix and a pH between 6.0 and 7.0 (Westland Horticulture limited, 2012).
The positive sandy soil is simply horticultural sand with natural nutritional values that were analysed previously (Table 2.1). The composition obtained for sandy soil revealed normal values for pH, phosphorus, sulphur, copper and iron; very high values of potassium; low values of magnesium, zinc and on the Cation Exchange Capacity (C.E.C.); and very low values of calcium, manganese, boron, molybdenum and sodium. It was used two different soils with normal P concentrations and pH, but different nutritional conditions, being the John Innes no. 3 the soil that provide more growth conditions compared to the sandy soil. The sandy soil was used due to be more practical and easier to work with the roots in study.
Peat and sand soil mix was used as a (-) control. This one was also analysed by Lancrop Laboratories to understand the mix composition (Table 2.3). The results from the analysis showed high concentrations for potassium, magnesium, sulphur, copper and boron, a normal presence for calcium, zinc, iron, sodium and for the Cation Exchange Capacity (C.E.C); a slightly low pH value, a low concentration for manganese and a very low concentrations of phosphorus and molybdenum.
These soil analysis results showed that the three soils selected for this experiment presented different compositions and consequently different conditions for the plant
Soil P concentration pH
John Innes no. 3 Normal 6.0-7.0
Sandy Normal 7.2
- 23 - growth, in terms of nutrients availability. The difference in the pH values present on Table 3.1 is a factor that may influence the availability of P to the plant, since the pH can cause an imbalance between labile and non-labile P in the soil (USDAa, 1999). The availability is influenced by the fixation of P, by Ca, Fe and Al. Since the analysis exhibits Fe and Ca concentration in the soil, fixation is able to occur depending on soil pH. However, all three soils are between pH 6 and 7.5, considered the ideal range of pH, and non-affecting the P availability in the soil (Aguiar et al., 2013; USDAb, 1999).
3.2. Zymography
Zymography is a non-destructive method used to analyse the enzymatic activity by substrate conversion, providing spatial information. Zymography can be used to visualise any hydrolase activity on any biological substrate like proteins, lipids and nucleic acids. This technique has three major complementary techniques for enzyme analyses such as in gel zymography (IGZ), in situ zymography (ISZ) and in vivo zymography (IVZ). In this experiment IGZ technique was used for the detection of enzymatic phosphatases excreted from the plant root into the soil. IGZ can evaluate the heterogeneity of phosphatases in the roots and soil, by analysing the chemical changes in the rhizosphere. Technically, for the detection, a filter paper is impregnated with a phosphatase substrate that will react by hydrolysis, with the sample (root or/and soil) containing phosphate or not, and generate a colour change or fluorescence, indicating the presence of the enzyme (Giles et al., 2018; Vandooren et al., 2013).
3.2.1. Zymography calibration
The calibration was made using 4-MU. The nKat production rate obtained by the 4-MU solution calibration is measured through the grey-value intensity, which is captured under a UV light, as a digital image. Furthermore, to obtain a precise measurement of the enzyme activity, the exposure time needs to be adjusted due to the sensitivity and the dynamic range, which influence signal losses for under exposure (noise), over exposure (saturation), and to make sure the sensor has used the full capacity (Giles et al., 2018). For the image calibration, different concentration of 4-MU (0µM, 35 µM, 70 µM, 130 µM and 200 µM) with different times of exposure (8, 12, 16, 20 and 24 s) were analysed.
- 24 - Figure 3.1: Normalized enzymatic activity (nKat/mm2) calibration curve of 4-MU
concentration (µM) at multiple exposure times (8, 12, 16, 20, 24 s) at pH 10, with respective equation curve and R-square (R2) values for each time of exposure.
With increasing exposure time, the sensitivity starts to decrease, and the concentrations become unable to be distinguished (Figure 3.1). Through the R2 it can be extrapolated
that the 8 s exposure is the most explanatory time from all five times evaluated. For this reason, the time used for the analysis was 8 s which gives the best-balanced results for the samples and standards. The UV exposition time of 8 s was applied to all the images obtain as results for the rhizobox and petri dish zymography.
8 s y = 13.61e-0,007x R² = 0.9342 12 s y = 8.9614e-0,005x R² = 0.658 16 s y = 7.7942e-0,005x R² = 0.555 20 s y = 7.4127e-0,004x R² = 0.5636 24 s y = 6.9653e-0,004x R² = 0.5733 0 2 4 6 8 10 12 14 16 18 0 50 100 150 200 250 No rm alize d en zy m atic ac tiv ity ( nKat/m m 2) 4-MU concentration (µM) 8 s 12 s 16 s 20 s 24 s Exponencial (8 s) Exponencial (12 s) Exponencial (16 s) Exponencial (20 s) Exponencial (24 s)
- 25 - Figure 3.2: Standards calibration results at pH10. A) exposure time 8 s; B) exposure time 12 s, at different concentrations of 4-MU (0 µM, 35 µM, 70 µM, 130 µM and 200 µM). In the Figure 3.2, is possible to see the real image obtain by the Fiji ImageJ program, at 8 and 12 s of exposure. In this image it can be observed a colour difference between two different times of exposure under the UV light.
When the concentrations of 4-MU are low, the filters become more fluoresced. This happens due to the image inversion made on the Fiji ImageJ software. This inversion was also made in the controls and inoculated root results, which means all images analysed are processed under the same conditions.
3.2.2. Standards calibration
In this experimental work, three different pH (6.5, 10 and 11) were used. The pH 6.5 was used in order to AcP (which are primarily excreter by plants and bacteria) could be evaluated, while the pH 11 was used for the AlP (primarily excreted from bacteria) be evaluated. The pH 10 was used to determine the standard calibration following the protocol according to Giles et al. (2018). The standard calibration was prepared at the same three pH mention before (6.5, 10 and 11), in order to evaluate how the enzymatic activity responded in each different pH (Spohn et al., 2015). Each selected pH was induced in the filters soaking solution and in the MUB.
A) )
- 26 - Figure 3.3: Results of the normalized enzyme activity (nKat/mm2) at pH 6.5, 10 and 11,
for concentrations of 4-MU at 0 µM, 35 µM, 70 µM, 130 µM and 200 µM; with respective equation curve and R-square (R2) values. Values were calculated based on the greyscale
image collected at 8 s exposure.
The standards show that the enzyme activity increases directly with the concentration of 4-MU present in the filters, this happens because the concentration of 4 -MU is directly proportional to the conversion from MUP to 4-MU. The conversion is due to the cleavage of MUP (used in the assays) to MU by the activity of the enzymes. Therefore higher 4-MU concentration means more 4-MUP cleavage and consequently higher enzyme activity (Sigma-Aldrich, 2013 and Turner BioSystems, 2002). However, the three different pH levels have different cleavage rates (Figure 3.3). The curve with more slope is the pH 10, followed by the pH 6.5 and finally the pH 11. The higher slope means higher enzymatic activity when the concentrations increase. Therefore, when the pH is 10, the cleavage of MUP is higher compared with pH 6.5 and 11.
These standards were made to calculate the normalized enzyme activity (nKat/mm2) from
the normalized integrated intensity obtain by the UV light (Figure 6.1).
The pH used to analyse the plant controls and respective samples were 6.5 and 11, since there was a need to optimize the AcP activity by the plants and because at pH 11 it was possible observe more easily the AlP (Giles et al., 2018).
pH 6.5 y = 0.0576x + 1.3559 R² = 0.98 pH 10 y = 0.0657x + 0.9935 R² = 0.9931 pH 11 y = 0.0204x + 1.1874 R² = 0.9827 0 2 4 6 8 10 12 14 16 0 50 100 150 200 250 No rm alize d en zy m atic ac tiv ity ( nKat/m m 2) Concentration of 4-MU (µM)
Different pH Standards
Standards pH 6.5 Standards pH 10 Standards pH 11 Linear (Standards pH 6.5) Linear (Standards pH 10) Linear (Standards pH 11)- 27 - 3.3. Control’s zymography
3.3.1. Plant zymography in rhizoboxes
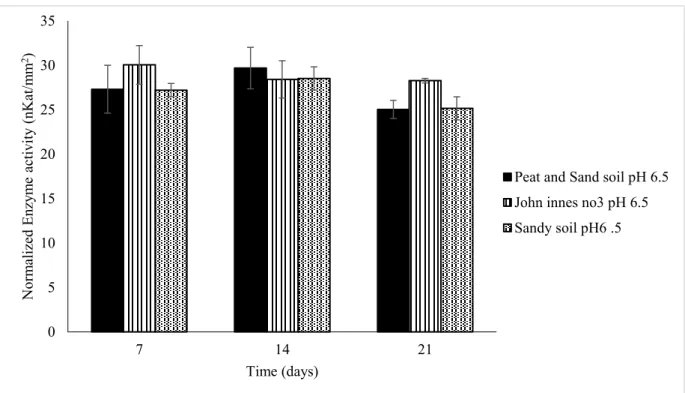
Figure 3.4: Enzymatic activity of B. rapa roots calculated using 4-MU calibration equations. The analyses were conducted in three different soils, John Innes no. 3 (with P), Sandy soil (with P) and Peat and Sand soil (without P) at pH 6.5. The analysis shows the normalized enzyme activity in nKat/mm2 (represented in the bars) along the growth
stages of the plant (7, 14 and 21 days). All essays were performed in triplicate. The different letters exhibit statistically significant differences (p ≤ 0.05).
Statistically the results are not significantly different (p > 0.05). This is a likely consequence of the limited number of replicates considered (due to methodological constrains) and subsequent large standard deviations observed. However, following the patterns on the Figure 3.4 it is possible extrapolate a potential behaviour expressed by the plants in the different soils.
Despite the different soils having no significative difference in the enzymatic activity, the growth times (7, 14 and 21) were proven to be a significant factor on the phosphatase activity (p < 0.05).
The analysis of enzyme activities around the roots of B. rapa grown in rhizoboxes were all carried at pH 6.5, which is the normal pH value for a soil and meaning that the enzymes evaluated were mainly AcP excreted by the plant and microorganisms (Hui et al., 2013).
0 5 10 15 20 25 30 35 7 14 21 No rm alize d E nzy m e ac tiv ity ( nKat/m m 2) Time (days)
Peat and Sand soil pH 6.5 John innes no3 pH 6.5 Sandy soil pH6 .5