WORKING PAPER SERIES
Universidade dos Açores Universidade da Madeira
CEEAplA WP No. 02/2007
Measuring the Impact of International Financial
Reporting Standards (IFRS) in Firm Reporting:
The Case of Portugal
Francisco Silva Gualter Couto Ruben Cordeiro
Measuring the Impact of International Financial
Reporting Standards (IFRS) in Firm Reporting:
The Case of Portugal
Francisco Silva
Universidade dos Açores (DEG)
e CEEAplA
Gualter Couto
Universidade dos Açores (DEG)
e CEEAplA
Ruben Cordeiro
Universidade dos Açores (DEG)
Working Paper n.º 02/2007
Fevereiro de 2007
RESUMO/ABSTRACT
Measuring the Impact of International Financial Reporting Standards (IFRS) in Firm Reporting: The Case of Portugal
To increase efficiency of the European finance market, the European Union (EU) recently forced all public companies to publish their financial disclosures with the support of the International Financial Reporting Standards (IFRS), emanated by the International Accounting Standards Board (IASB), beginning January 1, 2005.
In this paper, we measure the impact of the application of IFRS to financial information of Portuguese public companies belonging to the Eurolist by Euronext Lisbon.
The results show that the Balance Sheet and Income Statement structures of the firms studied suffered relevant accounting conversions in the process of compliance. Nevertheless, we did not find a clear pattern for the accounting variations. IFRS implementation conditioned the measure made to the performance and the financial position of the business companies in Portugal.
Key Words: Accounting Harmonization; International Financial Reporting Standards; Financial Reports; International Accounting Standards; Ratios; Multivariate Statistics;
Francisco Silva
Departamento de Economia e Gestão Universidade dos Açores
Rua da Mãe de Deus, 58 9501-801 Ponta Delgada
Gualter Couto
Departamento de Economia e Gestão Universidade dos Açores
Rua da Mãe de Deus, 58 9501-801 Ponta Delgada
Universidade dos Açores Rua da Mãe de Deus, 58 9501-801 Ponta Delgada
FINANCIAL REPORTING STANDARDS (IFRS) IN FIRM
REPORTING: THE CASE OF PORTUGAL
Francisco Silva
Professor of the University of the Azores CEEAplA, University of the Azores
Rua da Mãe de Deus, 9502 Ponta Delgada, Portugal Telef. 351-296650550
Gualter Couto
Professor of the University of the Azores CEEAplA, University of the Azores
Rua da Mãe de Deus, 9502 Ponta Delgada, Portugal Telef. 351-296650550
Ruben Cordeiro
MBA, University of the Azores University of the Azores
Rua da Mãe de Deus, 9502 Ponta Delgada, Portugal Telef. 351-296650550
MEASURING THE IMPACT OF INTERNATIONAL FINANCIAL
REPORTING STANDARDS (IFRS) IN FIRM REPORTING: THE
CASE OF PORTUGAL
Abstract
To increase efficiency of the European finance market, the European Union (EU) recently forced all public companies to publish their financial disclosures with the support of the International Financial Reporting Standards (IFRS), emanated by the International Accounting Standards Board (IASB), beginning January 1, 2005.
In this paper, we measure the impact of the application of IFRS to financial information of Portuguese public companies belonging to the Eurolist by Euronext Lisbon.
The results show that the Balance Sheet and Income Statement structures of the firms studied suffered relevant accounting conversions in the process of compliance. Nevertheless, we did not find a clear pattern for the accounting variations. IFRS implementation conditioned the measure made to the performance and the financial position of the business companies in Portugal.
Key Words: Accounting Harmonization; International Financial Reporting Standards;
1 INTRODUCTION
Over the last few years, the importance of international accounting practice studies have been growing in order to meet economic agent demands and to facilitate international business practices. International accounting convergence is an important topic for capital market regulators, investors, managers, governments, and indeed all who deal with the financial information of public companies.
Nowadays, accounting is not only a fiscal tool for authorities and for the financial institutions, but it also turns out to be an important tool for a wide variety of economic agents, due to the expansion of the capital transactions and the dispersion of economic agents. International accounting convergence intends to minimize the negative effects that result from the diversity of accounting practices in different countries.
Despite continual improvements since implementation of the first Accounting Standards Regulation (Plano Oficial de Contabilidade - POC) in 1977 in Portugal, adhesion to the European Community in 1986 motivated the development of accounting harmonization. In fact, the European Community approved Regulatory Law (CE) N.º 1606/2002, forcing all public firms, after the year 2005, to have consolidated accounts in accordance with the International Standard Accounts (IFRS) as developed by the International Accounting Standards Board (IASB).
Implementation of IFRS practices in all twenty-five countries of the European Union turned out to be an historic event. Possibly, it was the most significant revolution concerning accounting standards and accounting practices ever.
This paper aims to evaluate the impact of implementing the IFRS in the consolidated accounts (Balance Sheet, and Profit and Loss Accounting) of Portuguese firms (with the exception of financial institutions and sporting institutions) in the Euronext Lisbon official stock market, in accordance with the Regulatory Law (CE) N.º 1606/2002, and to determine if there are groups of enterprises with similar adjustment behavior. In addition, this study aims to quantify the differences between some economic and financial ratios, in particular price earnings ratio (PER) and the earnings per share (EPS), after the IFRS’s implementation.
2 LITERATURE REVIEW
Some of the first comparative studies considering international accounting diversity came from Davidson and Kohlmeier (1966) and Abel (1969), who measured the relationship between financial reports and the development of capital markets. Later on, Gray (1980)
found a relationship between accounting practices and a firm’s profits. The first studies concerned with accounting harmonization came in the 1980s, with the works of Nair and Frank (1981), Evans and Taylor (1982), Mckinnon and Janell (1984), Doupnik and Taylor (1987), Van der Tas (1988) and FEE (1989).
Understanding accounting diversity may help to explain differing business practices across different countries. This idea was developed by Joos and Lang (1994) and by Krisement and Strasse (1997). For Radebaugh and Gray (1993), differing accounting standards may be explained by different economic, historical, institutional and cultural environments. As the openness of the economy increases, the higher is the necessity for accounting harmonization.
Krisement and Strasse (1997), justify the existence of different accounting standards. History has shown that countries with similar social development have similar accounting practices, since accounting practices reflect social, economic, legal and cultural conditions that are similar (Choi et al., 1999; Cañibano and Mora, 2000).
Radebaugh and Gray (1993) enumerate the following aspects as to the most relevant terms of accounting orientation: the legal system; financing; tax system; politics, inflation, level of economic development and cultural environment.
Nobes and Parker (2000) found a strong similarity among accounting standards in countries with communitarian cultures on which financial information is directed to the government and financial institutions, and not to investors.
Technological advances allow financial reporting to be easily transmitted and always achievable. In this sense, information can easily be accessed not only by governments, but also by consumers, environmental associations, social institutions and others (Radebaugh and Gray, 1993; Choi et al., 1999; Titard and DiGregorio, 2003).
Lawrence (1996) referred to several agents and factors as responsible for the efforts toward an international accounting harmonization: investors, multinationals, international entities, and globalization. The same author also suggested some barriers: legal systems, nationalism, and organizational conflicts.
Choi et al. (1999), considered three main advantages that result from accounting harmonization:
a) The ability to compare international financial information, allowing enhanced credibility in the comparison of profits and losses around the world (see also Gray, 1980 and Tweedie, 2004).
Beresford (1990), Radebaugh and Gray (1993), Joos and Lang (1994), infer that in some cases, it is difficult to obtain an exact equivalence in different accounting systems and in the manner of financial reporting.
b) Savings in costs and time consolidating accounts result from different accounting systems. Also Copeland and Galai (1983); Kyle (1985); Glosten and Milgrom (1985) and Leuz and Verrecchia (2001) determine the savings to investors and to stockholders resulting from accounting harmonization.
c) A stronger consistence concerning economic, social and legal factors across different countries of the world.
3 METHODOLOGY
Most of the empirical studies to date investigate the following themes: benefits and cost of harmonization; obstacles to the process of harmonization; range of harmonization; factors that impel the process of harmonization; and gauging international or national harmonization levels (Emenyonu and Gray, 1992). Beyond initial studies, the content and scope of these issues were deeply studied, aimed at perfecting accounting knowledge, mainly by the studies of Ashbaugh and Pincus (2001), Cañibano and Mora (2000), Pierce and Weetman (2000), Benau and Grima (2002) and Tagesson et al. (2003).
Regarding accounting conversion imposed by the CE Regulation N.º 1606/2002, it is important to study the impact of the regulation on financial accounts in order to qualify the advantages and disadvantages inherent to the present process of European accounting harmonization. As a singular and exceptional event that has occurred so much in Portugal as in Europe, this is a new instrument to academic research in the accounting area.
For this study, we have used the software, Statistical Package for the Social Sciences (SPSS), in order to statistically analyze the obtained data. The statistical application has covered: descriptive statistics, ratio methods, cluster analyses and linear regression models.
In the first analysis, we have elaborated the distribution of data frequencies using descriptive statistics. Study of the mean and standard deviation was based on the absolute and percentage variations verified in certain accounting items of the Balance Sheet (to a sample of 39 firms) and profits and losses account (in a sample of 37 firms).
Concerning financial analysis, we have used the ratios method, which requires computing the relationship between economic and financial items. The ratios are a support tool for the study of the economic and financial appraisal of the companies over the long term. Thus, we aim to study the difference of these coefficients in the financial analysis, after the introduction of the IAS. An understanding of the changes in the ratios allows measurement of the level of benefit or disadvantage of the involved economic agents, independently of economic and financial conjecture, verified through the implementation of the IAS.
Elaboration of the ratios depends upon the purpose of the analyses and on the sources of information. In this study, we only computed the ratios of frequent use in the financial context whose calculation was feasible, attending to the limitations of the collected data. Therefore, we have examined the following ratios: gearing, PER and EPS, calculated using the information contained in some of the items on the Balance Sheet and Profit and Loss statements, complemented by the value of stock capitalization and by the number of stocks in circulation until the time in which the accounting conversion was observed.
In a third phase, we undertook a clusters analysis, a procedure of multivariate statistics, which requires the grouping of similar firms. Hence, the individuals grouping, in the set of n companies, is made regarding existent information in p variables, so that the resemblance between companies of a certain group are as alike as possible in comparison with the companies of the remaining groups. In synthesis, we have structured the data through presentation of the firms under the nature of a matrix of dimension n×p, equivalent to n lines (firms) and p columns (variables). For such, we have used the statistic tool K-Means Cluster Analysis, which adopts the Euclidian distance to measure the distance, or difference between, each one of the companies, calculated from the square root of the sum of the squares of the values’ differences for each variable, as in the following expression:
(
)
i 1,...,n j 1,...,n 1 2 , , − = = =∑
= p k k j k i ij X X dwhere Xi,kis the value of variable k for firm i and Xj,k is the value of variable k for firm j. The variables considered for the development of clusters analysis were the accounting adjustments after the year 2005 (percentage variations), verified in the Balance Sheet and Profit and Loss statement accounts, such as: intangible assets, tangible fixed assets, investments, other assets, equity, liabilities, operating profits, operating costs, financial accounts, extraordinary accounts,corporation taxes, and minority interests.
In the clusters algorithm, the criterion for aggregation of the firms was based on the centroid criteria, which requires calculation of the distance between groups, using the mean distance between their elements.
Lastly, to test the dependent relationship between the percentage variations verified in certain items of the Balance Sheet and Profit and Loss statements, as well as the economic and financial characteristics of the firms considering their dimension and practiced activity (namely, total assets, market capitalization, turnover, profit after taxes and sectors of activity), we have used the linear regression model, computing the t, F and R2 statistics. These methods evaluate the compliance between two variables (X and Y) with the same quantitative nature, with this relation represented in proximity to a straight-line. The coefficient of R2
determination measures the adjustment quality in terms of the sample. The models’ quality must also be evaluated considering the F test and the t test. The F test analyzes the adjustment in a global manner, while the t test is relative to each one of the parameters of the model.
Therefore, whether positive or negative correlations exist between the percentage variations of the items of the financial accounts (dependent variables) and the total assets, market capitalization, turnover, profit after taxes and sectors of activity (independent variables), is expressed by the following hypothesis:
H0: “There is a correlation between accounting adjustments and the company’s
dimension/activity.”
H1: “There is no correlation between accounting adjustments and the company’s
dimension/activity.”
For the null hypothesis, it is necessary to conclude that to different dimensions of the firm or sectors of activity, the major or minor will be the corresponding accounting adjustments resulting from IFRS’s implementation.
The model presented represents forty-eight simple linear regressions referring to the combination of each accounting item with each exogenous variable, except the variable’s “sectors of activity.” This can be represented by the following equation:
Vni = β0 + β1DEti + εi
n = 1, 2, 3, 4, 5, 6, 7, 8, 9, 10, 11, 12 t = 1, 2, 3, 4
i = 1,…,39
where, Vni is the value of the nth dependent (endogenous) variable for the ith firm, and DEti is the value of each of the independent (exogenous) variable t for the ith firm.
To accomplish the models, we have used as dependent variables the percentage variations occurring in the following accounting items: intangible assets (V1), tangible fixed assets (V2), investments (V3), other assets (V4), equity (V5), liabilities (V6), operating profits (V7), operating costs (V8), financial accounts (V9), extraordinary accounts (V10), corporation tax (V11), and minority interests (V12). As independent variables, we have considered the firms’ dimension (DE) concerning the total assets (DE1), sales volume (DE2), and market capitalization (DE4).
Relative to regression models, concerning the independent variables “sectors of activity,” we have formulated the following model:
Vni = β0 + β1SAi + β2SBi + β3SCi + εi
n = 1, 2, 3, 4, 5, 6, 7, 8, 9, 10, 11, 12 i = 1,…, 39
where, Vni is the value of the nth dependent (endogenous) variable for the ith firm, SA is a
dummy variable, assuming the value one for the technological sector and Internet, SB is a
dummy variable assuming the value one for the industrial sector (food, beverage, paper, card, chemical products, non-metal mineral products, machinery and electronic products, gas and steam electricity) and Sc is a dummy variable assuming the value one for other activities of
service rendered to the companies.
The previous model represents 12 multiple regressions, relative to the twelve dependent variables studied and to the exogenous variable “sectors of activity.” Therefore, we have excluded the companies pertaining to the following sectors: post offices and telecommunication, construction, retail commerce and commerce agents, catering and logistics, cultural and entertainment activities, auxiliary means of transportation and tourism and travel agents (sectors of activity considered the base in the regression models).
4 THE DATA
In empirical study, we used financial information relative to the end of the year 2004 and to the end of the year 2005 (the last quarter of the year). This information was obtained using the financial reports relative to the first quarter of the year 2006, which gives us two accounts elaborated by both the accounting standards (IFRS and Portuguese Accounting Standards - POC).
Whenever it was impossible to obtain comparative information relative to the Balance Sheet in the first quarter of 2005, we used the first type of “multiple information” as
suggested by Van der Tas (1988). That is, whenever the reports did not offer information based in the POC, it was necessary to deduce this information using accounts relative to the year 2004.
In what refers to the Profit and Loss accounts, comparisons between POC procedures and the IFRS were developed essentially in the first quarter of the year 2004, with the exception of two of the firms. In this case, most of the transaction periods report for the year 2004, independently of the rules imposed by the NIC 24.
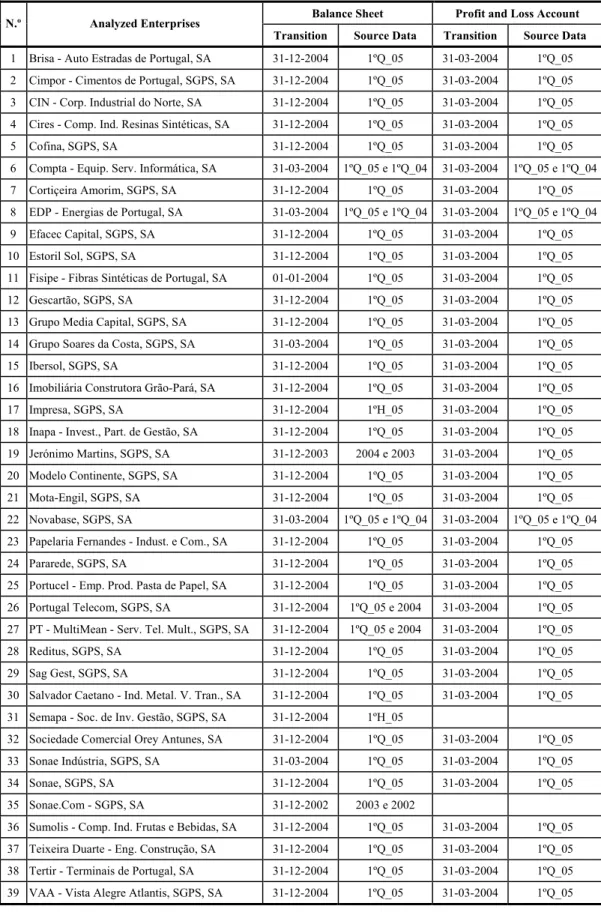
Table 1 displays transaction periods and the information sources relative to the balance sheet and to the profit and loss accounts for all of the firms.
[Insert TABLE 1 here]
As observed in Table 1, the transition periods do not coincide among the different firms. We are assuming that the transition period does not affect adjustments to the Balance Sheet.
In Portugal, European regulation N.º1606/2002 has been enforced since January 2005, for all corporations operating in the stock market with consolidated accounts. The law N.º 505/02 confirms which firms are members of the Euronext Lisbon.
The present study is concentrated in the consolidated accounts of the firms in the official stock market of Euronext Lisbon, which had to adapt their accounting to the European regulations. As of March 31, 2005, there were 39 corporations, after the exclusion of financial companies (7 companies), sporting companies (2 companies) and foreign-owned companies (2 companies). For this particular study, we have analyzed all of the firms’ consolidated financial reports.
Even when all of the adjustments to the assets, liabilities and equity in the Balance Sheet accounts were observable, the notation used was not always the same. Therefore, we had to adapt the most important components of the Balance Sheet, namely: intangible assets, fixed tangible assets, investments, differed taxes, goods and merchandize, cash, profits after taxes, minority interest, loans and provisions. Other components were aggregated as in “other assets”, “other liabilities” or “other capital.”
5 EMPIRICAL STUDY
5.1 Descriptive Analysis
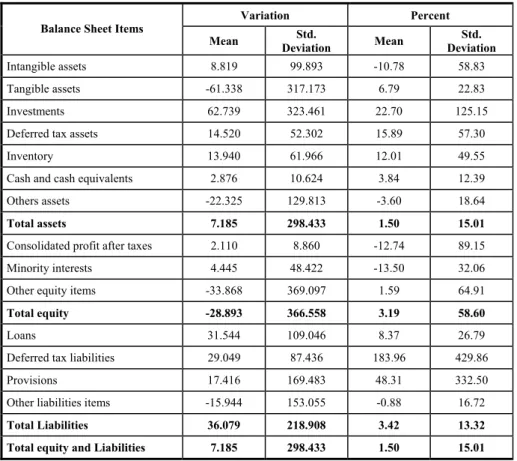
The results of descriptive analysis are shown in Tables 2 and 3. As can be seen, IFRS’s implementation produced some important variations both in the Balance Sheet (Table 2) as in the Profit and Loss accounts (Table 3).
The total of the Balance Sheet analysis shows an average variation of 7.185 thousand euros, which is equivalent to a positive variation of 1.5%. Equity is reduced, with the IFRS’s implementation in about 28,893 thousand euros; the average percentage of variation was 3.19%. Total liabilities increased on average 36,079 thousand euros, equivalent to 3.42%.
[Insert TABLE 2 here]
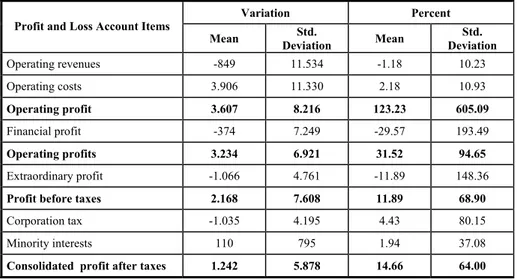
Concerning Table 3, one can see that the adjustments to meet IFRS compliance increased, on average, the Profits after Taxes in 14.66% of the firms, with a standard deviation of 64%, in the first quarter of the year 2004. Operating Profits verified a positive evolution as a result of the decrease in the Operating Costs (a decrease of 2.18%, equivalent to 3,906 thousand euros), compensated to some extend by the average decrease in Operating Revenues, in 1.18% (849 thousand euros).
We can also observe a negative average variation of 11.89% in Extraordinary Profits, and of 29.57% in the Financial Profits accounts. Tax estimates, in the Corporation Tax Account and the Minority Interests Account, varied on average about 4.43% and 1.94% respectively. Nevertheless, there is not a clear pattern in the variations’ behaviour (absolute and percentage variations), both for the Balance Sheet and for the Profit and Loss Statement.
[Insert TABLE 3 here]
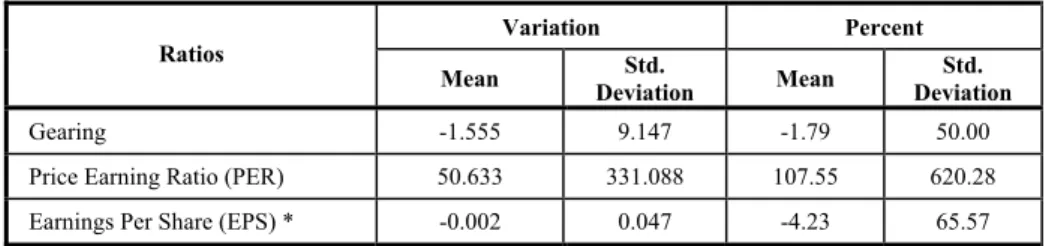
5.2 The Ratios
In attention to the results of this study, we expected some variations in the economic and financial ratios of the firms.
Table 4 shows some important changes in the ratios. As demonstrated, there is a distortion of the performance and financial conditions of the firms, which results merely from an accounting adjustment.
Gearing ratios show an average decrease of 1.6 percentage points; therefore firms’ capacity for paying their debt in the long term is lesser, signalling a greater risk for investors in these firms.
The ratios measuring the capital market influence relative to the first quarter 2004, the PER as well as the EPS, suggested a small lose for stockholders. On average, the PER changed in the value 50.6. This implies a decrease in the firms’ growth potential in the stock market, or in alternative, a recursive policy of dividend distribution, as well as an increase in risk level, by changing the roles of the accounts elaborated by both the accounting standards (IFRS and Portuguese Accounting Standards - POC).
5.3 Cluster Analysis
In order to aggregate the firms into different groups according to the variations resulting from the IFRS’s implementation, we used K-Means Cluster Analysis. This procedure optimizes the allocation of the firms to a predefined number of groups. We repeated the exercise for different numbers of clusters, between two and ten clusters.
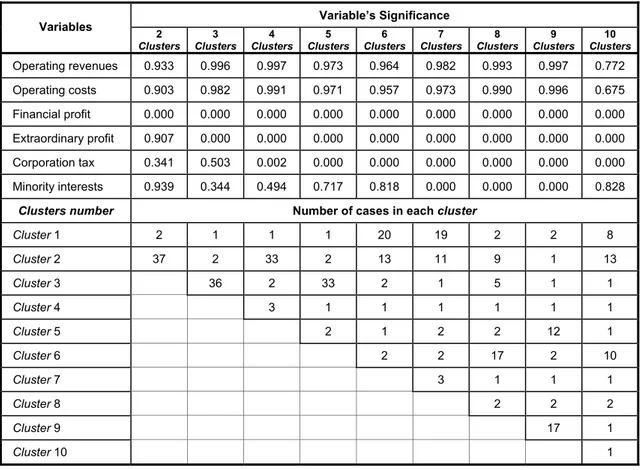
Tables 5 and 6 show the results for the Balance Sheet and for Profit and Loss Statement, respectively. Both tables show the significance for each of the variables used in the cluster analysis and the number of firms within each group.
[Insert TABLE 5 here]
At a 5% significance level, we found as significant variables in the Balance Sheet the intangible assets: Fixed Tangible Assets, Investments, Equity and Liabilities. Nevertheless, the firms’ allocation to the different groups is quite asymmetric.
Relative to the Profit and Loss Statement, the significance level for most of the variables is low, reflecting their inability to differentiate the clusters.
[Insert TABLE 6 here]
5.4 Linear Regression.
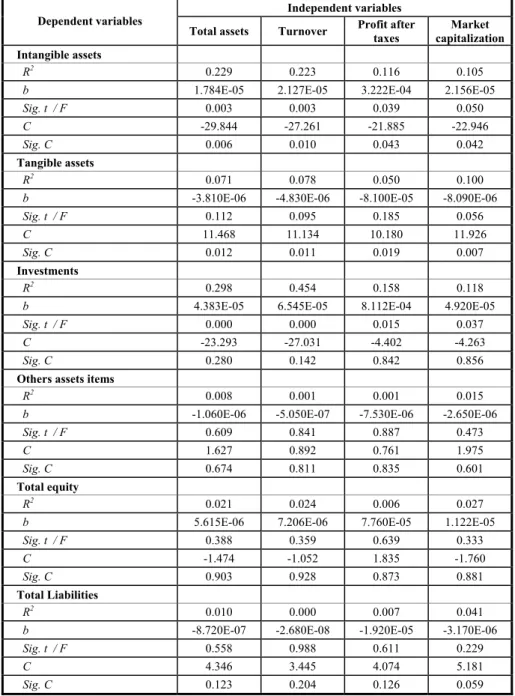
Table 7 shows the principal results when studying the relationship between the different variables.
In order to avoid influential cases, we dropped from our sample the firms EDP-Energia de Portugal and PT-Portugal Telecom, given that the dimension of these firms is significantly greater than the dimension of the other firms included in the sample. Table 7 shows the results for the different regressions, relative to the Balance Sheet with exclusion of the two firms.
It is possible to conclude from the significant relationships estimated (Sig. t <0.05), that as long as the firm’s size increases (measured by total assets, turnover, profit after taxes and market capitalization), the larger the percentage adjustments resulting from the IFRS’s implementation in the Intangible Assets and in Investments.
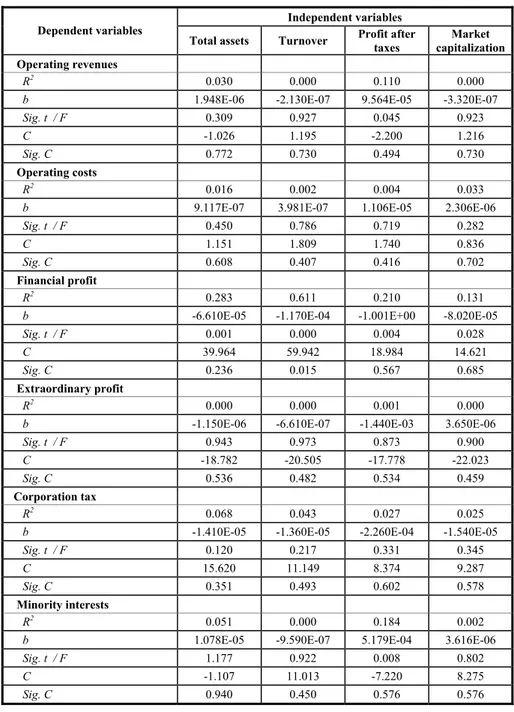
[Insert TABLE 8 here]
In Table 8, we can also verify some statistical relationships between firm’s size and the variations in Financial Profits and in Minority Interests. The percentage adjustment in Financial Profits is expected to be larger for larger companies.
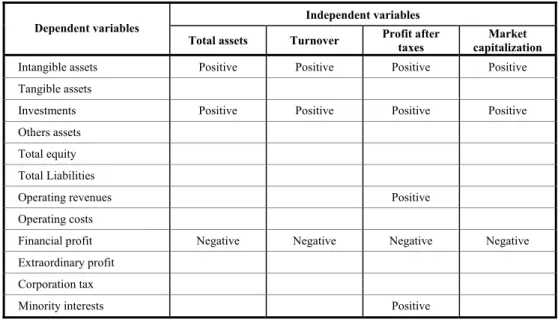
Table 9 shows the type of relationship between the endogenous and exogenous variables related to the firm’s dimension, whenever there is a significant statistical relationship at a 5 percent significance level.
[Insert TABLE 9 here]
CONCLUSIONS
Despite the objective of normalizing accounting standards within the European Community, IFRS’s implementation generated differences in the short term, creating a distortion of accounting information based on traditional national accounting standards.
This study’s conclusions are directed toward a significant impact of IFRS’s implementation in the financial reports of Portuguese firms, publicly-traded in the stock market. All of the items from the Balance Sheet and the Profit and Loss Statements registered important variations, increasing, in general, the total value of the Assets, Capital, Liabilities and Net Results in 1.5%, 3.2%, 3.4% and 14.7% respectively.
The most significant impacts on the Balance Sheet reporting result from the adjustments to Fixed Financial Assets and Debt, which contributed on a large scale to the positive variations in Total assets and Liabilities. With regard to the Profit and Loss Statement, the increase in Profits after Taxes creates a large reduction in operational costs.
IFRS’s implementation conditioned the evaluation of a firm’s financial performance. The ratios PER and EPS suggest depreciation in the position of stockholders with the new accounting standards.
Besides the distortion in accounting resulting from IFRS’s implementation in the firms studied, there is also a caution to consider when comparing numbers before and after IFRS’s implementation: a conversion of the accounts must be developed in order to accurately create such a comparison.
In this study, we did not find clusters of firms with significant differences in the way they adapt their accounting to the IFRS’s standards, and we did not find any clear evidence of different adaptation procedures between firms from different activity sectors. Nevertheless, we found some evidence of a relationship between percentage variations in some of the items on the Balance Sheet and the Profit and Loss Statement within the firms’ dimension.
REFERENCES
ABEL, R. A Comparative Simulation of German and United States Accounting Principles. Journal of Accounting Research, 1-11, 1969.
ASHBAUGH, H. and PINCUS, M. Domestic Accounting Standards, International Accounting Standards, and the Predictability of Earnings. Journal of Accounting Research, 417-434, 2001.
BENAU, G. and GRIMA, Z. Características de las Empresas Europeas que Aplican las Normas del IASB: Evidencia Empírica de Cara al Debate Regulador en la Nueva Fase de Armonización Contable. Revista Española de Financiación y Contabilidad, 75-110, 2002.
BERESFORD, D. Internationalization of Accounting Standards. Accounting Horizons, 99-107, 1990.
CAÑIBANO, L. and MORA, A. Evaluating the Statistical Significance of De Facto Accounting Harmonization: A Study of European Global Players. The European Accounting Review, 349-369, 2000.
CHOI, F., FROST, C. and MEEK, G. International Accounting. New Jersey: Prentice-Hall, 1999.
COPELAND, T. and GALAI, D. Information Effects on the Bid-Ask Spread. Journal of Finance, December, 1457-1469, 1983.
DAVIDSON, S. and KOHLMEIER, J. A Measure of the Impact of Some Foreign Accounting Principles. Journal of Accounting Research, 183-212, 1966.
EMENYONU, E. and GRAY S. EC Accounting Harmonisation: An Empirical Study of Measurement Practices in France, Germany and the UK. Accounting and Business Research, 49-58, 1992.
GLOSTEN, L. and MILGROM P. Bid, Ask, and Transaction Prices in a Specialist Market with Heterogeneously Informed Traders. Journal of Financial Economics, 71-100, 1985.
GRAY, S. The Impact of International Accounting Differences from a Security-Analysis Perspective: Some European Evidence. Journal of Accounting Research, 64-76, 1980.
JOOS, P. and LANG, M. The Effects of Accounting Diversity: Evidence from the European Union. Journal of Accounting Research, supplement, 141-168, 1994.
KRISEMENT, V. and STRASSE, O. An Approach for Measuring the Degree of Comparability of Financial Accounting Information. The European Accounting Review, 465-485, 1997.
KYLE, A. Continuous Auctions and Insider Trade. Econometrica, 1315-1335, 1985. LAWRENCE, S. International Accounting. Londres: International Thompson, 1996.
LEUZ, C. and VERRECCHIA, R. The Economic Consequences of Increased Disclosure. Journal of Accounting Research, Vol. 38, supplement 2000.
MCKINNON, S. and JANELL, P. The International Accounting Standards committee: A Performance Evaluation. International Journal of Accounting, Education and Research, 19-34, 1984.
NAIR, R. and FRANK, W. The Harmonization of International Accounting Standards, 1973-1979. International Journal of Accounting, Education and Research, 61-77, 1981.
NOBES, C. and PARKER, R. Comparative International Accounting, 6th edn. London: Financial
Times/Prentice-Hall, 2000.
PIERCE, A. and WEETMAN, P. The Impact of Non-disclosure on Measurement of De Facto Harmonisation: A Tow Country Comparison. 23º Congress of the European Accounting Association, Munique, 2000.
RADEBAUGH, L. and GRAY, S. International Accounting and Multinational Enterprises. New York. John Wiley & Sons., 1993.
TAGESSON, T., DAHLGREN, M., GAMLÉN, M. and HÄKANSON, M. The Relationship between Attitude towards Harmonization and the Internationalization of the Corporation: A Study of the Attitudes towards the Implementation of IASB Standards among Swedish Listed Companies. Workshop on Implementing IFRS. EIASM, Brussels, 2003.
TITARD, P. and DIGREGORIO, D. The Changing Landscape of Accounting Standards Setting. The CPA Journal, 73 (11), 18. 2003.
TWEEDIE, D. Statement of Sir David Tweedie Chairman, International Accounting Standards Board, before the Committee on Banking, Housing and Urban Affairs of the United States Senate. IASB.2004.
VAN DER TAS, L. Measuring Harmonisation of Financial Reporting Practice. Accounting and Business Research, 157-169, 1988.
Table 1 – Source Data
Balance Sheet Profit and Loss Account N.º Analyzed Enterprises
Transition Source Data Transition Source Data
1 Brisa - Auto Estradas de Portugal, SA 31-12-2004 1ºQ_05 31-03-2004 1ºQ_05 2 Cimpor - Cimentos de Portugal, SGPS, SA 31-12-2004 1ºQ_05 31-03-2004 1ºQ_05 3 CIN - Corp. Industrial do Norte, SA 31-12-2004 1ºQ_05 31-03-2004 1ºQ_05 4 Cires - Comp. Ind. Resinas Sintéticas, SA 31-12-2004 1ºQ_05 31-03-2004 1ºQ_05
5 Cofina, SGPS, SA 31-12-2004 1ºQ_05 31-03-2004 1ºQ_05
6 Compta - Equip. Serv. Informática, SA 31-03-2004 1ºQ_05 e 1ºQ_04 31-03-2004 1ºQ_05 e 1ºQ_04 7 Cortiçeira Amorim, SGPS, SA 31-12-2004 1ºQ_05 31-03-2004 1ºQ_05 8 EDP - Energias de Portugal, SA 31-03-2004 1ºQ_05 e 1ºQ_04 31-03-2004 1ºQ_05 e 1ºQ_04
9 Efacec Capital, SGPS, SA 31-12-2004 1ºQ_05 31-03-2004 1ºQ_05
10 Estoril Sol, SGPS, SA 31-12-2004 1ºQ_05 31-03-2004 1ºQ_05
11 Fisipe - Fibras Sintéticas de Portugal, SA 01-01-2004 1ºQ_05 31-03-2004 1ºQ_05
12 Gescartão, SGPS, SA 31-12-2004 1ºQ_05 31-03-2004 1ºQ_05
13 Grupo Media Capital, SGPS, SA 31-12-2004 1ºQ_05 31-03-2004 1ºQ_05 14 Grupo Soares da Costa, SGPS, SA 31-03-2004 1ºQ_05 31-03-2004 1ºQ_05
15 Ibersol, SGPS, SA 31-12-2004 1ºQ_05 31-03-2004 1ºQ_05
16 Imobiliária Construtora Grão-Pará, SA 31-12-2004 1ºQ_05 31-03-2004 1ºQ_05
17 Impresa, SGPS, SA 31-12-2004 1ºH_05 31-03-2004 1ºQ_05
18 Inapa - Invest., Part. de Gestão, SA 31-12-2004 1ºQ_05 31-03-2004 1ºQ_05 19 Jerónimo Martins, SGPS, SA 31-12-2003 2004 e 2003 31-03-2004 1ºQ_05 20 Modelo Continente, SGPS, SA 31-12-2004 1ºQ_05 31-03-2004 1ºQ_05
21 Mota-Engil, SGPS, SA 31-12-2004 1ºQ_05 31-03-2004 1ºQ_05
22 Novabase, SGPS, SA 31-03-2004 1ºQ_05 e 1ºQ_04 31-03-2004 1ºQ_05 e 1ºQ_04 23 Papelaria Fernandes - Indust. e Com., SA 31-12-2004 1ºQ_05 31-03-2004 1ºQ_05
24 Pararede, SGPS, SA 31-12-2004 1ºQ_05 31-03-2004 1ºQ_05
25 Portucel - Emp. Prod. Pasta de Papel, SA 31-12-2004 1ºQ_05 31-03-2004 1ºQ_05 26 Portugal Telecom, SGPS, SA 31-12-2004 1ºQ_05 e 2004 31-03-2004 1ºQ_05 27 PT - MultiMean - Serv. Tel. Mult., SGPS, SA 31-12-2004 1ºQ_05 e 2004 31-03-2004 1ºQ_05
28 Reditus, SGPS, SA 31-12-2004 1ºQ_05 31-03-2004 1ºQ_05
29 Sag Gest, SGPS, SA 31-12-2004 1ºQ_05 31-03-2004 1ºQ_05
30 Salvador Caetano - Ind. Metal. V. Tran., SA 31-12-2004 1ºQ_05 31-03-2004 1ºQ_05 31 Semapa - Soc. de Inv. Gestão, SGPS, SA 31-12-2004 1ºH_05
32 Sociedade Comercial Orey Antunes, SA 31-12-2004 1ºQ_05 31-03-2004 1ºQ_05 33 Sonae Indústria, SGPS, SA 31-03-2004 1ºQ_05 31-03-2004 1ºQ_05
34 Sonae, SGPS, SA 31-12-2004 1ºQ_05 31-03-2004 1ºQ_05
35 Sonae.Com - SGPS, SA 31-12-2002 2003 e 2002
36 Sumolis - Comp. Ind. Frutas e Bebidas, SA 31-12-2004 1ºQ_05 31-03-2004 1ºQ_05 37 Teixeira Duarte - Eng. Construção, SA 31-12-2004 1ºQ_05 31-03-2004 1ºQ_05 38 Tertir - Terminais de Portugal, SA 31-12-2004 1ºQ_05 31-03-2004 1ºQ_05 39 VAA - Vista Alegre Atlantis, SGPS, SA 31-12-2004 1ºQ_05 31-03-2004 1ºQ_05
Table 2 – Balance sheet variations
Variation Percent Balance Sheet Items
Mean Deviation Std. Mean Deviation Std.
Intangible assets 8.819 99.893 -10.78 58.83
Tangible assets -61.338 317.173 6.79 22.83
Investments 62.739 323.461 22.70 125.15
Deferred tax assets 14.520 52.302 15.89 57.30
Inventory 13.940 61.966 12.01 49.55
Cash and cash equivalents 2.876 10.624 3.84 12.39
Others assets -22.325 129.813 -3.60 18.64
Total assets 7.185 298.433 1.50 15.01
Consolidated profit after taxes 2.110 8.860 -12.74 89.15
Minority interests 4.445 48.422 -13.50 32.06
Other equity items -33.868 369.097 1.59 64.91
Total equity -28.893 366.558 3.19 58.60
Loans 31.544 109.046 8.37 26.79
Deferred tax liabilities 29.049 87.436 183.96 429.86
Provisions 17.416 169.483 48.31 332.50
Other liabilities items -15.944 153.055 -0.88 16.72
Total Liabilities 36.079 218.908 3.42 13.32 Total equity and Liabilities 7.185 298.433 1.50 15.01
Table 3 – Profit and Loss Account variations
Variation Percent Profit and Loss Account Items
Mean Deviation Std. Mean Deviation Std.
Operating revenues -849 11.534 -1.18 10.23 Operating costs 3.906 11.330 2.18 10.93 Operating profit 3.607 8.216 123.23 605.09 Financial profit -374 7.249 -29.57 193.49 Operating profits 3.234 6.921 31.52 94.65 Extraordinary profit -1.066 4.761 -11.89 148.36
Profit before taxes 2.168 7.608 11.89 68.90
Corporation tax -1.035 4.195 4.43 80.15
Minority interests 110 795 1.94 37.08
Consolidated profit after taxes 1.242 5.878 14.66 64.00
Table 4 – Ratios Variations
Variation Percent Ratios
Mean Deviation Std. Mean Deviation Std.
Gearing -1.555 9.147 -1.79 50.00
Price Earning Ratio (PER) 50.633 331.088 107.55 620.28
Earnings Per Share (EPS) * -0.002 0.047 -4.23 65.57
Table 5 – Results of clusters analysis (balance sheet)
Variable’s Significance Variables 2
Clusters Clusters 3 Clusters 4 Clusters 5 Clusters 6 Clusters 7 Clusters 8 Clusters 9 Clusters 10
Intangible assets 0.000 0.000 0.000 0.000 0.000 0.000 0.000 0.000 0.000 Tangible assets 0.021 0.017 0.000 0.000 0.001 0.001 0.000 0.002 0.003 Investments 0.000 0.000 0.000 0.000 0.000 0.000 0.000 0.000 0.000 Others assets 0.248 0.338 0.655 0.759 0.500 0.737 0.894 0.092 0.112 Total equity 0.510 0.000 0.000 0.000 0.000 0.000 0.000 0.000 0.000 Total Liabilities 0.000 0.000 0.000 0.000 0.001 0.000 0.000 0.000 0.000
Clusters number Number of cases in each cluster
Cluster 1 37 2 2 2 2 1 1 1 1 Cluster 2 2 4 6 6 2 1 19 2 2 Cluster 3 33 28 1 1 24 8 24 5 Cluster 4 3 28 29 9 2 5 1 Cluster 5 2 2 2 1 1 1 Cluster 6 3 1 1 1 1 Cluster 7 1 6 1 1 Cluster 8 1 1 1 Cluster 9 3 23 Cluster 10 3
Table 6 – Results of clusters analysis (Profit and Loss Account)
Variable’s Significance Variables
2
Clusters Clusters 3 Clusters 4 Clusters 5 Clusters 6 Clusters 7 Clusters 8 Clusters 9 Clusters 10
Operating revenues 0.933 0.996 0.997 0.973 0.964 0.982 0.993 0.997 0.772 Operating costs 0.903 0.982 0.991 0.971 0.957 0.973 0.990 0.996 0.675 Financial profit 0.000 0.000 0.000 0.000 0.000 0.000 0.000 0.000 0.000 Extraordinary profit 0.907 0.000 0.000 0.000 0.000 0.000 0.000 0.000 0.000 Corporation tax 0.341 0.503 0.002 0.000 0.000 0.000 0.000 0.000 0.000 Minority interests 0.939 0.344 0.494 0.717 0.818 0.000 0.000 0.000 0.828
Clusters number Number of cases in each cluster
Cluster 1 2 1 1 1 20 19 2 2 8 Cluster 2 37 2 33 2 13 11 9 1 13 Cluster 3 36 2 33 2 1 5 1 1 Cluster 4 3 1 1 1 1 1 1 Cluster 5 2 1 2 2 12 1 Cluster 6 2 2 17 2 10 Cluster 7 3 1 1 1 Cluster 8 2 2 2 Cluster 9 17 1 Cluster 10 1
Table 7 – Results of the regression models (balance sheet)
Independent variables Dependent variables
Total assets Turnover Profit after taxes capitalization Market Intangible assets
R2 0.229 0.223 0.116 0.105
b 1.784E-05 2.127E-05 3.222E-04 2.156E-05
Sig. t / F 0.003 0.003 0.039 0.050
C -29.844 -27.261 -21.885 -22.946
Sig. C 0.006 0.010 0.043 0.042
Tangible assets
R2 0.071 0.078 0.050 0.100
b -3.810E-06 -4.830E-06 -8.100E-05 -8.090E-06
Sig. t / F 0.112 0.095 0.185 0.056
C 11.468 11.134 10.180 11.926
Sig. C 0.012 0.011 0.019 0.007
Investments
R2 0.298 0.454 0.158 0.118
b 4.383E-05 6.545E-05 8.112E-04 4.920E-05
Sig. t / F 0.000 0.000 0.015 0.037
C -23.293 -27.031 -4.402 -4.263
Sig. C 0.280 0.142 0.842 0.856
Others assets items
R2 0.008 0.001 0.001 0.015
b -1.060E-06 -5.050E-07 -7.530E-06 -2.650E-06
Sig. t / F 0.609 0.841 0.887 0.473
C 1.627 0.892 0.761 1.975
Sig. C 0.674 0.811 0.835 0.601
Total equity
R2 0.021 0.024 0.006 0.027
b 5.615E-06 7.206E-06 7.760E-05 1.122E-05
Sig. t / F 0.388 0.359 0.639 0.333
C -1.474 -1.052 1.835 -1.760
Sig. C 0.903 0.928 0.873 0.881
Total Liabilities
R2 0.010 0.000 0.007 0.041
b -8.720E-07 -2.680E-08 -1.920E-05 -3.170E-06
Sig. t / F 0.558 0.988 0.611 0.229
C 4.346 3.445 4.074 5.181
Table 8 – Results of the regression models (Profit and Loss Account).
Independent variables Dependent variables
Total assets Turnover Profit after taxes capitalization Market Operating revenues
R2 0.030 0.000 0.110 0.000
b 1.948E-06 -2.130E-07 9.564E-05 -3.320E-07
Sig. t / F 0.309 0.927 0.045 0.923
C -1.026 1.195 -2.200 1.216
Sig. C 0.772 0.730 0.494 0.730
Operating costs
R2 0.016 0.002 0.004 0.033
b 9.117E-07 3.981E-07 1.106E-05 2.306E-06
Sig. t / F 0.450 0.786 0.719 0.282
C 1.151 1.809 1.740 0.836
Sig. C 0.608 0.407 0.416 0.702
Financial profit
R2 0.283 0.611 0.210 0.131
b -6.610E-05 -1.170E-04 -1.001E+00 -8.020E-05
Sig. t / F 0.001 0.000 0.004 0.028
C 39.964 59.942 18.984 14.621
Sig. C 0.236 0.015 0.567 0.685
Extraordinary profit
R2 0.000 0.000 0.001 0.000
b -1.150E-06 -6.610E-07 -1.440E-03 3.650E-06
Sig. t / F 0.943 0.973 0.873 0.900
C -18.782 -20.505 -17.778 -22.023
Sig. C 0.536 0.482 0.534 0.459
Corporation tax
R2 0.068 0.043 0.027 0.025
b -1.410E-05 -1.360E-05 -2.260E-04 -1.540E-05
Sig. t / F 0.120 0.217 0.331 0.345
C 15.620 11.149 8.374 9.287
Sig. C 0.351 0.493 0.602 0.578
Minority interests
R2 0.051 0.000 0.184 0.002
b 1.078E-05 -9.590E-07 5.179E-04 3.616E-06
Sig. t / F 1.177 0.922 0.008 0.802
C -1.107 11.013 -7.220 8.275
Table 9 – Correlation between the variables
Independent variables Dependent variables
Total assets Turnover Profit after taxes capitalization Market
Intangible assets Positive Positive Positive Positive
Tangible assets
Investments Positive Positive Positive Positive
Others assets Total equity Total Liabilities
Operating revenues Positive
Operating costs
Financial profit Negative Negative Negative Negative
Extraordinary profit Corporation tax