EUROPEAN ORGANIZATION FOR NUCLEAR RESEARCH (CERN)
CERN-PH-EP/2013-037 2014/09/22
CMS-TOP-12-036
Measurement of top quark-antiquark pair production in
association with a W or Z boson in pp collisions at
√
s
=
8 TeV
The CMS Collaboration
∗Abstract
A measurement of the cross section for the production of top quark-antiquark pairs (tt) in association with a vector boson V (W or Z) in proton-proton collisions at √s = 8 TeV is presented. The results are based on a dataset corresponding to an integrated luminosity of 19.5 fb−1 recorded with the CMS detector at the LHC. The measurement is performed in three leptonic (e and µ) channels: a same-sign dilepton analysis targeting ttW events, and trilepton and four-lepton analyses de-signed for ttZ events. In the same-sign dilepton channel, the ttW cross section is measured as σttW = 170+−9080(stat)±70 (syst) fb, corresponding to a significance of 1.6 standard deviations over the background-only hypothesis. Combining the trilepton and four-lepton channels, a direct measurement of the ttZ cross section, σttZ = 200+−8070(stat)+−4030(syst) fb, is obtained with a significance of 3.1 standard devi-ations. The measured cross sections are compatible with standard model predictions within their experimental uncertainties. The inclusive ttV process is observed with a significance of 3.7 standard deviations from the combination of all three leptonic channels.
Published in the European Physical Journal C as doi:10.1140/epjc/s10052-014-3060-7.
c
2014 CERN for the benefit of the CMS Collaboration. CC-BY-3.0 license
∗See Appendix A for the list of collaboration members
1
1
Introduction
Two decades after the discovery of the top quark [1, 2], many of its properties are still to be determined or are only loosely constrained by experimental data. Among these properties are the couplings between the top quark and the vector bosons.
The existence of non-zero couplings between the top quark and the neutral vector bosons can be inferred through the analysis of direct production of tt pairs in association with a γ or a Z boson. The CERN LHC allows these two processes to be disentangled and the corresponding couplings to be measured. The associated production of tt pairs with a W boson, the ttW process, has a cross section similar to ttZ and ttγ production. All three processes can be used to test the internal consistency of the standard model (SM) [3–5] and search for the presence of new physics. Despite their small cross sections, they are significant backgrounds to analyses that probe phenomena with even smaller, or comparable, cross sections. Examples are searches for supersymmetry [6–8] in same-sign dilepton [9] and in multilepton [10] final states, and the analysis of the SM ttH process with the Higgs boson and the top quarks decaying leptonically. The measurement of the ttγ process has been documented by the CDF Collaboration [11] for proton-antiproton collisions at a centre-of-mass energy √s = 1.96 TeV. This article presents instead the measurement of cross sections for the ttW and ttZ processes in proton-proton (pp) collisions at√s = 8 TeV. The analysis is based on data corresponding to an integrated lumi-nosity of 19.5 fb−1 collected with the CMS detector at the LHC in 2012. Unlike the previous observation of the ttV process (V equal to W or Z) at√s = 7 TeV [12], here the ttW process is treated separately.
Three leptonic (e and µ) final states are considered: same-sign dilepton events, trilepton events, and four-lepton events. The same-sign dilepton events are used for the measurement of the ttW process, where one lepton originates from the leptonic decay of one of the two top quarks and the other like-sign lepton is produced in the decay of the prompt vector boson. The trilepton events are used for the identification of ttZ events in which one lepton is again produced from the leptonic decay of one of the two top quarks, and the two other opposite-sign and same-flavour leptons stem from the decay of the Z boson. The four-lepton events are used to identify ttZ events in which both the top quarks and the Z boson decay leptonically. For all three signatures, signal events containing leptonic τ decays are implicitly included.
d
u
d
g
W
+
t
t
g
g
g
t
t
Z
Figure 1: The dominant leading-order Feynman diagrams for ttW and ttZ production in pp collisions. The charge conjugate of the diagrams shown is implied.
Figure 1 shows the most important leading-order Feynman diagrams for ttW and ttZ produc-tion in pp collisions. For pp collisions at√s = 8 TeV, the current best estimates of the cross sections for these processes are based on quantum chromodynamics (QCD) calculations at next-to-leading-order (NLO) in αs. Using CT10 NLO [13] parton distribution functions (PDF) and a
top-quark mass of 173 GeV, the software framework MADGRAPH5 aMC@NLO[14, 15] provides a cross section of 206+−2123fb for ttW production and of 197+−2225fb for ttZ production, in agreement
2 3 Event selection and Monte Carlo simulation
with independent NLO calculations [16, 17].
As the number of selected signal events is expected to be comparable to that of the background processes, the estimation of the background is a key aspect of the analysis. The strategy is to use background-dominated control samples in data to the maximum extent possible. Many contributions to the background, in particular those caused by detector misreconstruction, are estimated in this way, while the remaining irreducible backgrounds are estimated using Monte Carlo (MC) simulations and the most precise calculations of cross sections that are available. For the three separate channels and also for their combination, the yields of events found in ex-cess of the expected backgrounds are used to measure the corresponding signal cross sections.
2
The CMS detector
The central feature of the CMS apparatus is a superconducting solenoid of 6 m internal di-ameter, providing a magnetic field of 3.8 T. Within the superconducting solenoid volume are a silicon pixel and strip tracker, a lead tungstate crystal electromagnetic calorimeter, and a brass/scintillator hadron calorimeter. Muons are measured in gas-ionization detectors em-bedded in the steel flux-return yoke outside the solenoid. A forward calorimeter extends the coverage provided by the barrel and endcap detectors. CMS uses a right-handed coordinate system, with the origin at the nominal interaction point, the x axis pointing to the centre of the LHC, the y axis pointing up (perpendicular to the LHC plane), and the z axis along the anticlockwise-beam direction. The polar angle θ is measured from the positive z axis and the azimuthal angle φ is measured in the x-y plane in radians. Events are selected by a two-stage trigger system: a hardware-based trigger followed by a software-based high-level trigger run-ning on the data acquisition computer farm. A more detailed description of the CMS apparatus can be found in Ref. [18].
3
Event selection and Monte Carlo simulation
For all the channels considered in this analysis, the data are selected online by dilepton (ee, eµ, and µµ) triggers that demand a transverse momentum (pT) larger than 17 GeV for the highest pT
lepton and 8 GeV for the second-highest. The online selection involves loose identification for both flavours and isolation requirements on electrons. Other channel-specific triggers, which are described in detail later, select control regions that are used for the estimation of specific backgrounds and the assessment of the signal selection efficiency. After the online selection, data and simulated events are reconstructed offline using the same software.
Each event is processed using a global event reconstruction approach [19, 20]. This consists in reconstructing and identifying particles using an optimized combination of the information from all subdetectors. In this process, the identification of the particle type (photon, electron, muon, charged hadron, and neutral hadron) plays an important role in the determination of the particle direction and energy.
The tracks reconstructed in the silicon tracker are clustered in several primary vertices corre-sponding to the different pp interactions occurring within the same LHC bunch crossing. The vertex that has the largest∑ip2Ti, where i runs over all tracks of the vertex, is assumed to iden-tify the signal primary vertex. Its position is used to discriminate against particles originating from the other interactions (pileup) and to distinguish between prompt and non-prompt parti-cles stemming from the signal interaction.
3
algorithm [21], operated with a distance parameter of 0.5. The jet momentum is determined as the vector sum of all particle momenta in the jet. In this analysis the jets used for the definition of the signal regions (signal jets) are required to be inside the tracker acceptance, i.e.|η| < 2.4 where η≡ −ln[tan(θ/2)], to reduce the uncertainty in the jet reconstruction efficiency and im-prove the precision of the energy measurement. Jet energy corrections are applied to account for the non-linear response of the calorimeters and other instrumental effects. These correc-tions are based on in situ measurements using dijet and γ+jet data samples [22]. A two-fold approach is employed to reduce the effect of pileup during jet reconstruction. Firstly, charged particles whose trajectories point to pileup vertices are excluded from the set of particles that are used for the reconstruction of signal jets. Secondly, the average energy density due to neu-tral pileup particles is evaluated in each event, and the corresponding energy inside the jet is subtracted [23]. Then a jet identification requirement [24], primarily based on the energy balance between charged and neutral hadrons in a jet, is applied to remove jets that are mis-reconstructed or originate from instrumental noise. Finally, the trajectories of all the charged particles of a jet are used to calculate a pT-averaged longitudinal impact parameter for each
sig-nal jet [25]. This variable is then employed as a discriminator against jets from pileup. Unless otherwise specified, signal jets are required to have pT >30 GeV.
To identify (tag) jets originating from the hadronization of bottom quarks (b jets), the com-bined secondary vertex (CSV) algorithm [26] is used. The algorithm combines the information about track impact parameters and secondary vertices within jets in a likelihood discriminant to provide separation between b jets and jets originating from light quarks, gluons, or charm quarks. We use here two operating points. The loose working point corresponds to a b-tagging efficiency for jets originating from b quarks of about 85% and a misidentification probability for jets from light quarks and gluons of 10%. The medium working point provides an efficiency of about 70% and a misidentification probability of 1.5%.
Muons and electrons are identified using standard quality criteria [27, 28] and are required to have pT > 20 GeV and|η| < 2.4. For the four-lepton channel only, identified leptons with pT
between 10 and 20 GeV are also employed for the event selection. To reduce the contamination caused by leptons from heavy-flavour decays or misidentified hadrons in jets, leptons are re-quired to be isolated and to pass a selection on the impact parameter, which is calculated with respect to the position of the signal primary vertex. Candidates are considered isolated when the ratio of the scalar sum of the transverse momenta of all the other reconstructed particles in a cone of∆R =
√
(∆η)2+ (∆φ)2 = 0.3 around the candidate, relative to the lepton pT value,
is less than 5–10%, the exact value of the threshold depending on the flavour of the lepton and on the final state. This relative isolation is corrected for the expected contribution from pileup using an approach that is similar to the one employed for the reconstruction of jets [29]. The leptons are required to originate from the primary interaction demanding that their transverse and longitudinal impact parameters are smaller than 50–200 µm and 0.1–1.0 cm, respectively. The tightest selections in these ranges are used for the lepton flavour and final states that are most affected by backgrounds due to non-prompt leptons.
Finally, the observables Emiss
T and HTare used, respectively, to identify the presence of neutrinos
and to measure the hadronic activity in the analysed events. The former is defined as the magnitude of the vector sum of the transverse momenta of all reconstructed particles, the latter is the scalar sum of the transverse momenta of all signal jets.
Simulations, which include pileup effects, are used to estimate some of the backgrounds, as well as to calculate the selection efficiency for the ttW and ttZ signal events. Simulated sam-ples are generated with the MADGRAPH5 [30] program, with the exception of the ttH
back-4 4 Same-sign dilepton analysis
ground process that is generated using PYTHIA 6 [31]. All simulated samples are processed using a GEANT4-based model [32] of the CMS detector. Signal samples are produced with MADGRAPH5, which is used with the CTEQ6L1 [33] PDF and is interfaced toPYTHIA6.424 to
simulate parton showering and hadronization.
4
Same-sign dilepton analysis
The aim of the same-sign dilepton analysis is to search for ttW events where one lepton is produced in the leptonic decay chain of one of the two top quarks, and the other like-sign lepton stems directly from the decay of the prompt vector boson:
pp→ttW→ (t→b`ν)(t→bqq0)(W→ `ν),
where ` corresponds to an electron or a muon. By requiring that the two selected leptons have the same sign, only half of the signal produced in the dilepton final state can be selected. However, the requirement significantly improves the signal-over-background ratio. The main background is caused by misidentification and misreconstruction effects: decay products of heavy-flavour mesons that give rise to non-prompt leptons and pions in jets misidentified as prompt leptons. A second, smaller, source of background is also caused by misreconstruction and consists of opposite-sign dilepton events where the charge of one of the two leptons is wrongly assigned.
The selection for the dilepton channel is conducted through the following steps:
1. Each event must contain two isolated leptons of the same charge and pT > 40 GeV. Both
leptons are required to be compatible with the signal primary vertex and have a relative isolation smaller than 5%. The invariant mass of the dilepton pair is required to be larger than 8 GeV.
2. Three or more signal jets must be reconstructed, and at least one of these has to be b-tagged using the medium working point of the CSV algorithm.
3. Events are rejected if they contain a third lepton forming, with one of the other two lep-tons, a same-flavour opposite-sign pair whose invariant mass is within 15 GeV of the known Z-boson mass [34]. For the third lepton, the relative isolation must be less than 9(10)% if it is an electron (muon), and the transverse momentum requirement is loosened to pT >10 GeV.
4. The HTvalue is required to be greater than 155 GeV.
5. Selected events are grouped in three categories depending on the lepton flavour: ee, eµ, and µµ dilepton pairs. Each of these categories is further split into two separate sets of dileptons with either positive or negative charges, for a total of six signal regions.
The tight-lepton selection (1) reduces the background from misidentified leptons, while the in-variant mass requirement rejects events with pairs of energetic leptons from decays of heavy hadrons. The requirement (2) on the general number of jets and on the number of b-tagged jets present in the event decreases the background from electroweak processes, e.g. WZ produc-tion, that can have same-sign leptons in the final state, but are accompanied by little hadronic activity. The WZ background is also significantly reduced by the third-lepton veto (3). The HT
4.1 Background estimation 5
signal significance. This selection also minimizes the expected uncertainty in the measured cross section. The splitting (5) of the signal candidates in six categories is done for two reasons: exploiting the smaller background from lepton and charge misidentification in signal regions with muons and benefitting from the greater signal cross section in the plus-plus dilepton final states, which is caused by the abundance of quarks, instead of antiquarks, within the colliding protons at the LHC. Finally, the Z-boson veto is necessary to make the dilepton analysis sta-tistically independent from the trilepton one described later. Events with three leptons are not rejected if they pass the Z-boson veto, since these can stem from a fully-leptonic decay of the tt pair in ttW signal events.
4.1 Background estimation
After the full same-sign dilepton selection is applied, there are three general categories of background processes that are selected together with ttW signal events: background from non-prompt or misidentified leptons (misidentified lepton background); background from lep-ton charge misidentification (mismeasured charge background); WZ and ttZ production, as well as other rare SM processes that contain genuine pairs of prompt, isolated and same-sign lep-tons. The subset of these processes that do not contain a Z boson in the final state forms the irreducible component of the background. This includes the production of like-sign WW and the production of the Higgs boson in association with a pair of top quarks. The production of a tt pair in association with a W boson by means of double parton scattering is expected to have a cross section two orders of magnitude smaller than the ttW production through single scattering [35]. This source of background is therefore considered negligible and is ignored in the rest of the analysis.
The first background consists mostly of tt events, with a second important contribution com-ing from W+jets events. In both cases, one prompt lepton originates from the leptonic decay of a W boson, and another same-sign lepton is caused by the misidentification of a non-prompt lepton stemming from the decay of a heavy-flavour hadron. In W+jets events, smaller sources of misreconstructed leptons affecting this category of background are given by the misrecon-struction of hadrons, the production of muons from light-meson decays, and the reconstruc-tion of electrons from unidentified photon conversions. The background yield is estimated from data using a sample of events that satisfy the full analysis selection, except that one of the two leptons is required to pass a looser lepton selection and fail the full selection (sideband region). The background rate is then obtained weighting the events in this sideband region by the “tight-to-loose” ratio, i.e. the probability for a loosely identified lepton to pass the full set of requirements. This tight-to-loose ratio is measured as a function of lepton pTand η in a control
sample of dijet events, which is depleted of prompt leptons and is selected by dedicated single-muon and single-electron triggers. The systematic uncertainty in the background estimate is due to the differences in the various sources of non-prompt or misidentified leptons, between the dijet events where the tight-to-loose ratio is measured and the sideband region where the ratio is applied. Among the most important differences are the pT spectrum and the flavour
of the jets containing the misidentified leptons. These two quantities have been varied in the control sample using appropriate selections and then the effects on the tight-to-loose ratio, and on the background estimate itself, have been quantified. The range of variation for these two quantities has been guided by a simulation of the background processes. The full systematic uncertainty in the background is estimated to be 50%. The statistical part of the uncertainty is driven by the number of events in the sideband region and it is significantly smaller than the systematic uncertainty for all six signal regions.
6 4 Same-sign dilepton analysis
than for electrons. Therefore the magnitude of the background caused by charge misidenti-fication, mostly in Drell–Yan and tt events, is driven only by electrons. This background is estimated by selecting opposite-sign ee or eµ events that pass the full analysis selection, except the same-sign requirement, and then weighting them by the pT- and η-dependent probability
for electron charge misassignment. This probability and its variation as a function of the lepton pTand η are determined by combining information from simulation and a control data sample
of Z → ee events. For the electron selection used in this analysis, the probability of charge misidentification is about 10−4 and 10−3 for electrons reconstructed in the barrel and endcap detectors, respectively. The background estimate has an uncertainty of 30% (15%) for the ee (eµ) signal regions. This uncertainty accounts for differences between data and simulation, and the limited momentum range of electrons in the Z-boson control sample.
Production of WZ and ttZ events, and the irreducible backgrounds, are all estimated from simulation as done when calculating the signal selection efficiencies. For each SM process contributing to this category of background, the dominant systematic uncertainty is the one in the theoretical cross section prediction. Depending on the process, we use an uncertainty of 15–50% and consider it as fully correlated across all signal regions.
4.2 Same-sign dilepton results
After the full analysis selection is applied, 36 events are observed in data, to be compared with 25.2±3.4(syst⊕stat)events expected from background processes and 39.7±3.5(syst⊕
stat)events from the sum of background and ttW signal with the SM cross section. For both predictions, the statistical and systematic uncertainties are added in quadrature.
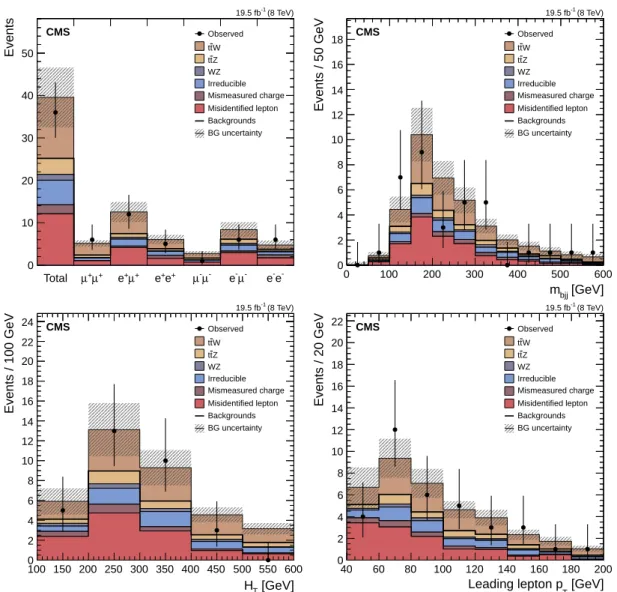
The event yields, along with the corresponding uncertainties for each background component, are reported in Table 1. The top left panel of Fig. 2 shows the distribution of the expected and observed events across the six different signal regions, and for all dilepton channels added to-gether. As already anticipated, the positively charged channels are expected to collect a larger quantity of signal than the negatively charged channels, for a comparable quantity of back-ground. The first three channels therefore drive the sensitivity of this analysis. In Table 1 and Fig. 2, and in the equivalent tables and figures for the other two leptonic channels, the uncer-tainty in the signal cross section is not shown because it does not affect the precision of the experimental measurement.
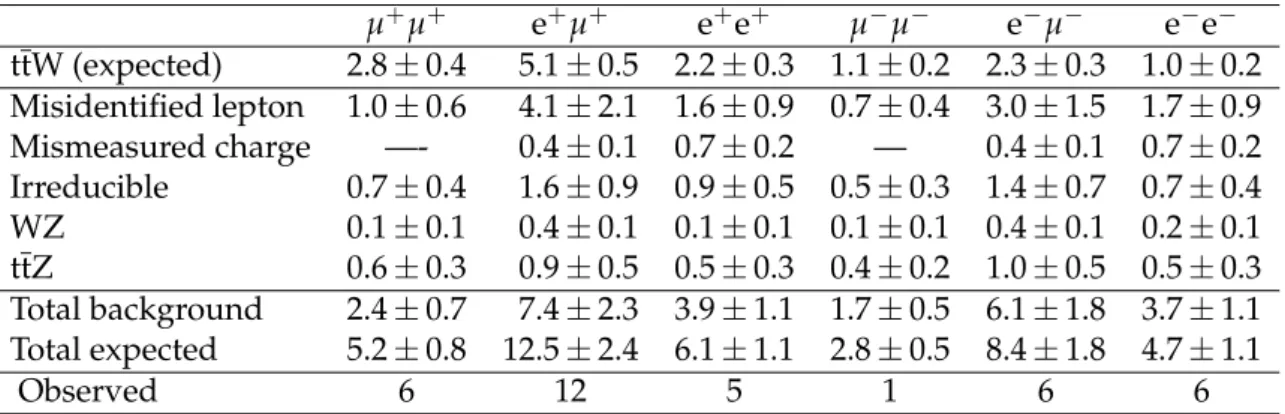
Table 1: Expected signal, estimated backgrounds, the sum of the two, and observed number of events for the µ±µ±, e±µ±, and e±e± channels. Uncertainties include both the statistical and the systematic components. The systematic uncertainty in the signal contribution does not include the theoretical uncertainty in the signal production cross section.
µ+µ+ e+µ+ e+e+ µ−µ− e−µ− e−e− ttW (expected) 2.8±0.4 5.1±0.5 2.2±0.3 1.1±0.2 2.3±0.3 1.0±0.2 Misidentified lepton 1.0±0.6 4.1±2.1 1.6±0.9 0.7±0.4 3.0±1.5 1.7±0.9 Mismeasured charge —- 0.4±0.1 0.7±0.2 — 0.4±0.1 0.7±0.2 Irreducible 0.7±0.4 1.6±0.9 0.9±0.5 0.5±0.3 1.4±0.7 0.7±0.4 WZ 0.1±0.1 0.4±0.1 0.1±0.1 0.1±0.1 0.4±0.1 0.2±0.1 ttZ 0.6±0.3 0.9±0.5 0.5±0.3 0.4±0.2 1.0±0.5 0.5±0.3 Total background 2.4±0.7 7.4±2.3 3.9±1.1 1.7±0.5 6.1±1.8 3.7±1.1 Total expected 5.2±0.8 12.5±2.4 6.1±1.1 2.8±0.5 8.4±1.8 4.7±1.1 Observed 6 12 5 1 6 6
The other three panels of Fig. 2 show the distributions for the invariant mass mbjjof the three jets
4.2 Same-sign dilepton results 7 Total lµ+µ+l le+µ+l le+e+l lµ-µ-l -µ-l e l le-e-l Events 0 10 20 30 40 50 Observed W t t Z t t WZ Irreducible Mismeasured charge Misidentified lepton Backgrounds BG uncertainty CMS (8 TeV) -1 19.5 fb [GeV] bjj m 0 100 200 300 400 500 600 Events / 50 GeV 0 2 4 6 8 10 12 14 16 18 Observed W t t Z t t WZ Irreducible Mismeasured charge Misidentified lepton Backgrounds BG uncertainty CMS (8 TeV) -1 19.5 fb [GeV] T H 100 150 200 250 300 350 400 450 500 550 600 Events / 100 GeV 0 2 4 6 8 10 12 14 16 18 20 22 24 Observed W t t Z t t WZ Irreducible Mismeasured charge Misidentified lepton Backgrounds BG uncertainty CMS (8 TeV) -1 19.5 fb [GeV] T Leading lepton p 40 60 80 100 120 140 160 180 200 Events / 20 GeV 0 2 4 6 8 10 12 14 16 18 20 22 Observed W t t Z t t WZ Irreducible Mismeasured charge Misidentified lepton Backgrounds BG uncertainty CMS (8 TeV) -1 19.5 fb
Figure 2: Event yields in data after final dilepton selection requirements, compared to the back-ground estimates and signal expectations. Contributions separated by final states (top left), tri-jets mass distribution for the hadronic top-quark candidate (top right), HTdistribution (bottom
left), and the leading-lepton pT distribution (bottom right). The combination of statistical and
8 5 Trilepton analysis
leading-lepton pT (bottom right) for all six signal regions combined together. For each event,
the three signal jets used for the mbjjdistribution are selected as follows: one, and only one, of
the three jets is b-tagged; among the possible three-jet combinations the one chosen minimizes ∆Rjjj =
√
(∆Rj1,t)2+ (∆R
j2,t)2+ (∆Rj3,t)2, where∆Rji,tis the∆R distance between the direction
of the i-th jet and the direction of the reconstructed hadronic top-quark candidate. In all four distributions data and simulation are found in agreement. In particular, the mbjj distribution
confirms that most of the background from misidentified leptons is originating from top-quark events. In Fig. 2, and also in all other similar figures included in this document, the error bar enclosing each data point represents the 68% confidence level interval around the mean of the corresponding Poisson distribution.
Based on the observed number of events, the background estimates, and the signal acceptance (including the leptonic branching fractions), the inclusive ttW production cross section is mea-sured, through the combination of the six dilepton channels, as
σttW=170+−9080(stat)±70 (syst) fb,
including statistical and systematic uncertainties, compared to the SM expectation of 206+−2123fb. The significance of the result over the background-only hypothesis is equivalent to 1.6 standard deviations (2.0 standard deviations expected).
The systematic uncertainty in the signal selection efficiency is 8%. It is treated in a common way with the three- and four-lepton channels and is discussed in detail in Section 7. Additionally, for all channels there is a 2.6% uncertainty in the expected yield of signal and simulation-derived background events because of the uncertainty in the luminosity normalization [36]. However, together with the low yield of signal events, the main factor dominating the uncertainty in the cross section measurement is the uncertainty in the largest background component, i.e. the 50% uncertainty in the background from misidentified leptons.
5
Trilepton analysis
The production of a tt pair in association with a Z boson is analysed in the final state with three high-energy, isolated, and prompt leptons. The trilepton analysis targets final states with only one W boson decaying leptonically:
pp→ttZ→ (t→b`ν)(t→bqq0)(Z→ ``).
The event selection, described in more detail below, focuses on the main features of this final state: two oppositely charged leptons of the same flavour, consistent with the Z-boson decay; an additional lepton; and at least four jets, at least two of which are b-tagged. The isolation of the leptons has additionally been loosened to reflect the diminished contribution of misidenti-fied leptons to the background.
The selection for the trilepton channel is conducted through the following steps:
1. Each event must contain three isolated leptons of pT >20 GeV and passing identification
requirements described in Section 3. All three leptons are required to be compatible with the signal primary vertex and have a relative isolation smaller than 9% (10%) for electrons (muons).
2. Two of the leptons must be of the same flavour, be oppositely charged, and form an invariant mass between 81 and 101 GeV to be consistent with a Z-boson decay. If multiple
5.1 Background estimation 9
pairs pass this selection, the one with the mass closest to the known Z-boson mass is selected as the Z boson candidate.
3. To match the final-state signal topology, four or more signal jets must be reconstructed with at least three of these jets having pT >30 GeV, and the fourth jet is required to have
pT > 15 GeV. Additional identification and pileup suppression selections are applied as
described in Section 3.
4. At least two of the jets with pT > 30 GeV must be b-tagged, the first using the medium
working point of the CSV algorithm, and the second using the loose working point. 5. Events are rejected if they contain a fourth lepton with a loosened transverse momentum
requirement of pT >10 GeV, in order not to overlap with the four-lepton analysis.
These event selections have been optimized for the best precision on the expected measured cross section. A broad range of variations to the applied requirements has been considered in the optimization: including in the event selections a minimum number of jets, minimum jet pT, as well as HT; changing the number of jets required to be b-tagged; and varying the
lepton momentum and isolation thresholds. Estimates of the expected backgrounds used in the optimization of the final requirements have been made both with initial estimates from simulation alone as well as with events in data control samples using the methods described below.
5.1 Background estimation
Backgrounds passing the analysis selections are separated into three components: irreducible contributions from events with three prompt leptons and two b-quark jets (irreducible compo-nent), primarily with at least one top quark in the process; those with three prompt leptons and b-tagged jets without top-quark contributions (non-top-quark component); and contributions with at least one misidentified lepton (misidentified lepton component). This categorization is driven by the choice of methods used to estimate the backgrounds.
The irreducible component is split evenly among single-top-quark production in association with a Z boson (tbZ), ttH, and ttW production; additional contributions from production of three bosons and tt associated with an isolated photon or two additional vector bosons are much smaller, but are still considered. Since the ttW contribution is constrained by measure-ments in other (primarily the same-sign dilepton) final states, its expected SM contribution of 0.2±0.1 (stat) events is quoted separately. The remaining irreducible background contributions are estimated directly from simulation: 0.77±0.04 (stat)±0.39 (syst) events are expected. The systematic uncertainty in this background is conservatively estimated to be 50%, dominated by the uncertainty in the cross section, in accordance with corresponding values used in Sec-tion 4.1. This systematic uncertainty is applied also to the ttW contribuSec-tion and serves as an initial constraint to the combined measurement, as discussed in Section 8.
The non-top-quark component contributions are primarily from events with three prompt lep-tons and b-tagged jets from misidentified light-flavour jets or b-quark jets arising from initial-or final-state radiation. In simulation, this contribution is dominated by WZ events. Because neither the absolute rate of extra jet production from radiation and higher-order diagrams, nor the flavour composition of additional jets are well simulated [37], we rely on data to predict this background.
A sideband sample with three leptons and no b-tagged jets, with all other selections applied, is dominated by non-top-quark backgrounds and is used to normalize the non-top-quark
compo-10 5 Trilepton analysis
nent prediction. The method to predict the non-top-quark backgrounds relies on the ratio Rbof
the number of events passing the analysis b-tagging requirements relative to those not having b-tagged jets. This ratio is assumed to be the same as for inclusive Z+jets production (with the Z boson decaying leptonically) for events passing the same jet selections. We derive the Rb in a sample of events with opposite-sign same-flavour leptons passing the same identification requirements as in the trilepton sample. The contribution of tt and other flavour-symmetric backgrounds is subtracted using opposite-flavour dilepton events after a correction for a dif-ference in the lepton selection efficiency. For the final prediction of the non-top-quark compo-nent, an additional correction Cb = 1.4±0.2 (stat) is applied based on the difference between
the prediction and observation in simulation. This is done to account for residual differences in the kinematic properties of jets between Z+jets events and the trilepton non-top-quark back-ground. The Rbmeasured in dilepton events in data is 0.160±0.003 (stat). The non-top-quark component is predicted to contribute 2.3±0.5 (stat)±1.1 (syst) events. The systematic uncer-tainty of approximately 50% is estimated as a combination of observed difference of Rbin the
dilepton events between data and simulation and the deviation of Cbfrom unity.
Finally, the misidentified-lepton background component is estimated with a method similar to that of the same-sign dilepton analysis, described in Section 4.1. In each of the four final states the control sample is culled from events passing the trilepton signal event selections except that only one of the leptons is required to fail the isolation and identification require-ments, still passing looser requirements. Similar to the same-sign dilepton analysis, the ratio of misidentified leptons passing full identification and isolation selections relative to the loosened requirements (the tight-to-loose ratio) is modelled to be the same in the trilepton events as in a sample with one lepton candidate and a jet. The modelling is tested in simulation, where the tight-to-loose ratio is measured in simulated multijet events and is then applied to the dom-inant background sample, i.e. tt production. The level of agreement between predicted and observed background in simulation gives the leading source of systematic uncertainty in the method, estimated to be roughly 50%. Combined in all trilepton final states, the misidentified lepton component is estimated to be 1.2±0.5 (stat)±0.6 (syst) events.
5.2 Trilepton results
The 12 events observed in data are consistent with the sum of the estimated backgrounds, 4.4±
1.6(syst⊕stat)events, and the expected signal, 7.8±0.9(syst⊕stat)events. These results are summarized in Table 2 and illustrated in Fig. 3, which shows corresponding contributions in separate channels as well as several characteristic distributions. The trijet mass for the hadronic top-quark candidate is calculated with the same method as in Section 4.2.
The systematic uncertainty in the cross section measurement arises from uncertainties in the background yields and in the estimate of the signal selection efficiency. For the signal event selection, the dominant sources of systematic uncertainty are the modelling of the lepton se-lection and the uncertainty in the jet energy scale. They produce 6% and 5% uncertainty in the signal selection efficiency, respectively, and sum to a total of 10% systematic uncertainty together with the other sources of uncertainty described in Section 7.
Based on the observed number of events, the background estimates, and the signal acceptance, of 0.0021±0.0001 (stat)±0.0002 (syst), the inclusive ttZ production cross section in the trilepton analysis is measured as
σttZ,3` =190+−10080 (stat)±40 (syst) fb,
including statistical and systematic uncertainties, compared to the SM expectation of 197+−2225fb. The significance of the result over the background-only hypothesis is equivalent to 2.3 standard
11
Total (µµ)µ (µµ)e (ee)µ (ee)e
Events 0 2 4 6 8 10 12 14 16 18 Observed Z t t W t t Irreducible Non-top-quark Misidentified lepton Backgrounds BG uncertainty (8 TeV) -1 19.5 fb CMS [GeV] bjj m 0 100 200 300 400 500 600 Events / 50 GeV 0 2 4 6 8 10 Observed Z t t W t t Irreducible Non-top-quark Misidentified lepton Backgrounds BG uncertainty (8 TeV) -1 19.5 fb CMS [GeV] ll m 82 84 86 88 90 92 94 96 98 100 Events / 3 GeV 0 2 4 6 8 10 Observed Z t t W t t Irreducible Non-top-quark Misidentified lepton Backgrounds BG uncertainty (8 TeV) -1 19.5 fb CMS
b-jet multiplicity (CSV Medium) 0.5 1 1.5 2 2.5 3 3.5 4 4.5 Events 0 2 4 6 8 10 Observed Z t t W t t Irreducible Non-top-quark Misidentified lepton Backgrounds BG uncertainty (8 TeV) -1 19.5 fb CMS
Figure 3: Event yields in data after final trilepton selection requirements, compared to the background estimates and signal expectations. Contributions separated by final states where the two leptons consistent with the Z boson are indicated inside parenthesis on the bin labels (top left), trijets mass distribution for the hadronic top-quark candidate (top right), Z-boson candidate dilepton mass distribution (bottom left), and the distribution of the number of b-tagged jets passing medium operating point of the b-tagger (bottom right). The combination of statistical and systematic uncertainties is denoted by the shaded area.
deviations, compared to the expected value of 2.4. This result is combined with the four-lepton analysis and the same-sign dilepton analysis, as described in Section 8.
6
Four-lepton analysis
The aim of the four-lepton analysis is to select events originating from the process: pp→ttZ→ (t→b`ν)(t→b`ν)(Z→ ``).
These events are characterized by a pair of same-flavour, opposite-sign leptons (e and µ) with an invariant mass that is close to the nominal Z-boson mass and two additional prompt leptons.
12 6 Four-lepton analysis
Table 2: Expected signal, estimated backgrounds, the sum of the two, and observed number of events for the trilepton channel. Uncertainties include both the statistical and the system-atic components. The systemsystem-atic uncertainty in the signal contribution does not include the theoretical uncertainty in the signal production cross section.
Yield ttZ (expected) 7.8±0.9 Irreducible 0.8±0.4 ttW 0.2±0.1 Non-top-quark 2.3±1.2 Misidentified lepton 1.1±0.8 Total background 4.4±1.6 Total expected 12.2±1.8 Observed 12
Since the branching fraction of ttZ to four leptons is very low, it is a challenge to maintain high signal efficiency and at the same time reject as much background as possible. To that end, the events are separated into two categories, one of which has a significantly higher signal-to-background ratio than the other. The event selection has been optimized using the signal significance from simulated events and is summarized in the following:
1. Events must have a total of four leptons passing the lepton identification criteria de-scribed in Section 3. Each electron (muon) is required to have relative isolation smaller than 9(10)%.
2. The highest lepton pT must be greater than 20 GeV. The remaining leptons must have
pT >10 GeV.
3. Two of the leptons must form an opposite-sign same-flavour pair with the dilepton mass between 76 and 106 GeV.
4. The remaining two opposite-sign leptons must not form a same-flavour pair with the dilepton mass between 76 and 106 GeV.
5. At least one jet must pass the medium CSV b-tagging selection. 6. At least one other jet must pass the loose CSV b-tagging selection.
The high signal-to-background signal region requires that events pass all of the criteria above. A second signal region requires that they pass the first five conditions and fail the sixth. These two four-lepton channels are exclusive.
6.1 Background estimation
The standard model can produce four genuine, prompt leptons through multiboson+jets pro-duction where at least two bosons decay leptonically. Backgrounds to this search include ZZ, WWZ, WZZ, ZZZ, and rarer processes. They can prove irreducible if the multiboson produc-tion is accompanied by b-tagged jets arising from the underlying event or initial-state radiaproduc-tion (irreducible background).
The contribution from irreducible background processes is estimated using MC simulations. The process with the largest contribution in the four-lepton signal regions comes from the
6.2 Four-lepton results 13
ZZ process. The main concern with taking this background estimate solely from a simula-tion is how well the rate at which bottom quarks are produced is modelled. Since these bottom quarks mainly originate from initial-state radiation, this rate is estimated in a data sample of leptonically-decaying Z bosons with two additional jets. For events in this sample the proba-bility to pass the two b-tagging criteria is found to be about 4%. Rescaling by this number the events in the appropriate ZZ enhanced region measured in data, the background estimate is found to agree very well with the estimate from simulations. Therefore, the latter estimate is used in the analysis.
Another source of background arises when electrons and muons are incorrectly identified as prompt and isolated (misidentified lepton background). These can either result from misrecon-struction of hadrons or from non-prompt or non-isolated leptons passing the selection criteria. Isolated tracks are used as a proxy for misidentified leptons and to calculate a “track-to-lepton” ratio, which depends on the heavy-flavour content and jet activity. The track-to-lepton ratio is determined by measuring the number of prompt, isolated tracks and the number of prompt, isolated leptons after the contribution to the leptons from electroweak processes has been sub-tracted. It is calculated in two control regions in data: a region with leptonic decays of Z bosons and a region with semi-leptonic decays of tt pairs. The two regions cover the extremes of how much heavy-flavour content is expected in different event samples. The ratio is then interpolated between these two regions using a linear mixing of the two control samples and parameterized as a function of the variable Rn-p/p, which is the ratio of isolated, non-prompt tracks to non-isolated, non-prompt tracks in the sample. A track is defined as non-prompt when its transverse impact parameter is less than 200 µm, and non-prompt otherwise. The variable Rn-p/pis used in the parameterization of the track-to-lepton ratio since it quantifies the amount
of heavy-flavour content in the events of a given sample. The validity of the parameterization is checked in a third control region that requires one dilepton pair consistent with the Z boson and at least one b-tagged jet: for this sample, whose heavy-flavour content is expected to be in between those of the two previous control regions, Rn-p/p is calculated, and the predicted and observed track-to-lepton ratios are compared and found in agreement. Finally, two side-band regions with one dilepton pair consistent with the Z boson and a third lepton, and which also satisfy the two b-tagging categorizations are defined. By calculating Rn-p/pand using the
track-to-lepton parameterization, the probability for isolated, prompt tracks to be misidentified as electrons (muons) is found equal to 7.4±2.2% (1.6±0.5%) in these two samples. To deter-mine the number of background events in the signal regions, the yields in the sideband regions are then multiplied by the track-to-lepton ratios and the relevant combinatoric factors depend-ing on the number of isolated tracks present in the events. A background yield of 0.1±0.1 (0.5±0.2) in the 2 b-jet (1 b-jet) signal region is calculated in this way.
6.2 Four-lepton results
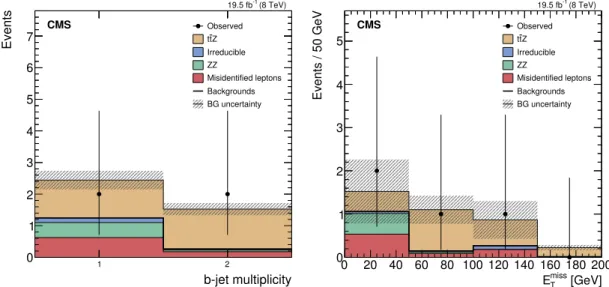
Applying the full event selection, the event yields shown in Table 3 are obtained. A total of 4 events are observed, compared to a background expectation of 1.4±0.3 events, where the un-certainty in the background prediction contains both the contributions from the limited num-ber of simulated events and from the uncertainties related to the rescaling procedure based on control samples in data. The results are shown in Fig. 4 (left). A comparison of the EmissT dis-tributions for the background, signal, and observed data, combining the two signal regions, is shown in Fig. 4 (right).
The systematic uncertainties in the selection efficiencies for signal and irreducible background are derived in the same way as for the dilepton and trilepton channels and are described in Section 7. For the four-lepton analysis, the dominant source of uncertainty in the signal
accep-14 7 Systematic uncertainties in signal selection efficiency
Table 3: Expected signal, estimated backgrounds, the sum of the two, and observed number of events for the four-lepton channel. Uncertainties include both the statistical and the systematic components. The systematic uncertainty in the signal contribution does not include the theo-retical uncertainty in the signal production cross section. The ZZ component of the background is shown separately from the rest of the irreducible processes.
2 b jets required 1 b jet required
ttZ (expected) 1.3±0.2 1.3±0.2 Misidentified lepton 0.1±0.1 0.5±0.2 ZZ 0.05±0.01 0.47±0.02 Irreducible 0.04±0.03 0.14±0.04 Total background 0.2±0.1 1.1±0.2 Total expected 1.5±0.2 2.4±0.3 Observed 2 2
tance is the 8% uncertainty in the modelling of the lepton selection. Together with the other systematic uncertainties, it sums to a total uncertainty of 11% in the signal selection efficiency. By performing a simultaneous fit to the two exclusive four-lepton signal regions, the following cross section is extracted:
σttZ,4` =230+−180130(stat)
+60
−30(syst) fb.
The significance is equal to 2.2 standard deviations (2.0 standard deviations expected).
b-jet multiplicity 1 2 Events 0 1 2 3 4 5 6 7 Observed Z t t Irreducible ZZ Misidentified leptons Backgrounds BG uncertainty CMS (8 TeV) -1 19.5 fb [GeV] miss T E 0 20 40 60 80 100 120 140 160 180 200 Events / 50 GeV 0 1 2 3 4 5 Observed Z t t Irreducible ZZ Misidentified leptons Backgrounds BG uncertainty CMS (8 TeV) -1 19.5 fb
Figure 4: Event yields in data after final four-lepton selection requirements, compared to the background estimates and signal expectations. Contributions in the 1 tagged jet and 2 b-tagged jets signal regions (left) and inclusive EmissT distribution (right). The ZZ component of the background is shown separately from the rest of the irreducible processes. The combination of statistical and systematic uncertainties is denoted by the shaded area.
7
Systematic uncertainties in signal selection efficiency
Along with the corresponding techniques for the background estimation, the uncertainties in the estimates of the backgrounds affecting the three channels have been presented respectively in Sections 4, 5, and 6. Here are illustrated the uncertainties in the selection efficiency of signal events.
15
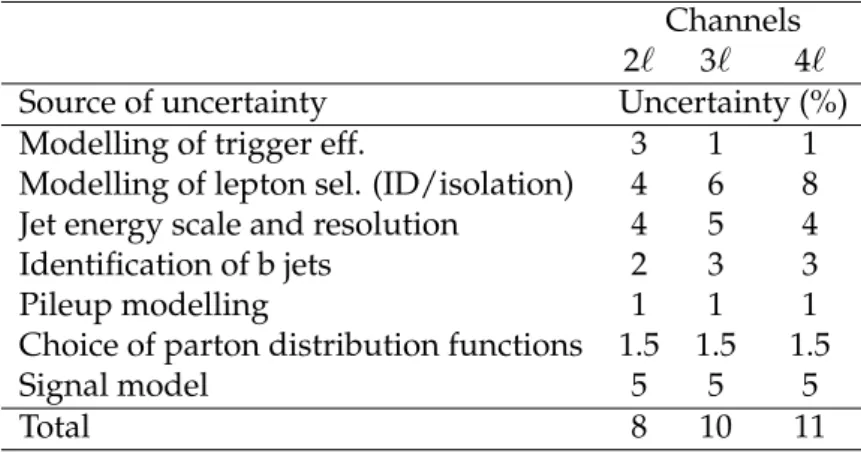
Except for the component due to trigger, simulation is used to estimate the selection efficiency for signal. Control samples in data are used to correct the selection acceptance estimated in simulation and to assess the corresponding uncertainty. A similar approach is employed for all three analysis channels and therefore a common list of systematic uncertainties in signal acceptance can be summarized as in Table 4. The total uncertainty in the computed acceptance varies between 8 and 11% depending on the channel.
Table 4: Systematic uncertainties in the signal selection efficiency for the three considered chan-nels: ttW in dilepton (2`) final state; ttZ in trilepton (3`) and four-lepton (4`) final states.
Channels 2` 3` 4`
Source of uncertainty Uncertainty (%)
Modelling of trigger eff. 3 1 1
Modelling of lepton sel. (ID/isolation) 4 6 8 Jet energy scale and resolution 4 5 4
Identification of b jets 2 3 3
Pileup modelling 1 1 1
Choice of parton distribution functions 1.5 1.5 1.5
Signal model 5 5 5
Total 8 10 11
The trigger efficiency is directly measured in data using control samples selected by HTtriggers
that are orthogonal to the dilepton triggers employed by the three analyses to select signal event candidates [9]. Trigger inefficiencies are then applied to all acceptances calculated from simulation, for both signal and the background processes derived from simulation.
The offline lepton selection efficiencies in data and simulation are measured using Z-boson events to derive simulation-to-data correction factors. The correction factors applied to sim-ulation are about 0.94 (0.98) for pT > 20 GeV for electrons (muons). The uncertainty in the
per-lepton selection efficiency is about 1.5% (0.3%) for electrons (muons) with pT > 20 GeV.
An additional systematic uncertainty is assigned to account for potential mismodelling of the lepton isolation efficiency due to the larger hadronic activity in signal events than in Z-boson events. This uncertainty is in the 2–3% range. These per-lepton uncertainties are propagated to calculate the uncertainties in the selection efficiency of signal events, which are found to be in the 4–8% range depending on the leptonic final state.
Another source of systematic uncertainty is associated with the jet energy scale correction. This systematic uncertainty varies between 5% and 2% in the pT range 40–100 GeV for jets with |η| < 2.4 [22]. It is evaluated on a single-jet basis, and its effect is propagated to HT, the
number of jets, and the number of b-tagged jets. In addition, there is a contribution to the total uncertainty arising from limited knowledge of the resolution of the jet energy, but this effect is generally of less importance than the contribution from the jet energy scale.
The b-tagging efficiency for b-quark jets, and the mistagging probabilities for charm-quark jets and for jets originating from light-flavour quarks or gluons, are estimated from data [38]. The corresponding correction factors, dependent on jet flavour and kinematic properties, are applied to simulated jets to account for the differences in the tagging efficiency between simu-lation and data. The total uncertainty in the signal acceptance caused by the b-tagging selection is determined by varying the correction factors up and down by their uncertainties.
In the simulation of signal events, different pileup conditions have been probed varying the cross section for inelastic pp collisions by±5%. Comparing the signal selection efficiency for
16 8 Results
these different conditions, the uncertainty associated to pileup effects is found to be approxi-mately 1%. The uncertainty in the signal acceptance due to the PDF choice [13, 39–42] is found to be 1.5%. An uncertainty of the order of 5% in the signal acceptance is also assigned to the finite-order calculation employed to generate signal events. This last uncertainty, which cov-ers also the uncertainty in the effects of initial- and final-state radiation, is estimated varying from their nominal values the matrix-element/parton-shower matching scale (with the nomi-nal value of 20 GeV), and the renormalization and factorization scales (with the nominomi-nal value equal to Q2in the event). For the up and down variations of the matching scale, thresholds of 40 and 10 GeV are used, respectively. Renormalization and factorization scales are varied be-tween 4Q2and Q2/4. The signal model uncertainty also includes the difference in acceptance between signal events simulated with MADGRAPH5 and aMC@NLO[15] generators.
8
Results
To extract the cross sections for the ttW and ttZ processes, the nine different channels are com-bined to maximize their sensitivity. Cross section central values and corresponding uncertain-ties are evaluated from a scan of the profile likelihood ratio. The adopted statistical procedure is the same that was used for the observation of the Higgs boson candidate in CMS, and is described in detail in Ref. [29].
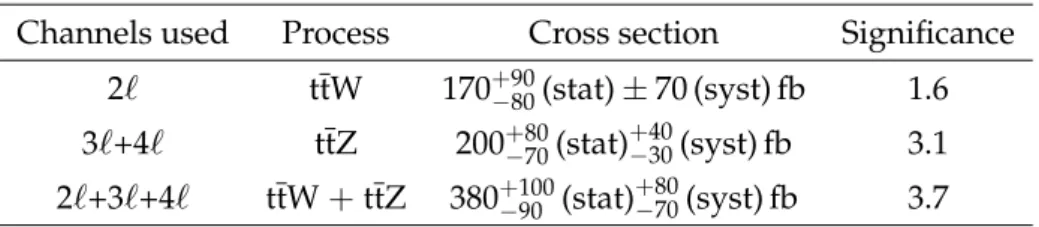
The results of the measurements are summarized in Table 5. Two one-dimensional fits are performed to measure ttW and ttZ separately using the channels most sensitive to each process. Using only the same-sign dilepton channels, the extracted ttW cross section is measured to be 170+−9080(stat)±70 (syst) fb, corresponding to a significance of 1.6 standard deviations over the background-only hypothesis. The three and four lepton channels are combined to extract a ttZ cross section of 200+−8070(stat)+−4030(syst) fb, with a significance of 3.1 standard deviations.
Table 5: Results of the extraction of cross sections, from single and combined channels. The significance is expressed in terms of standard deviations.
Channels used Process Cross section Significance 2` ttW 170+−9080(stat)±70 (syst) fb 1.6 3`+4` ttZ 200−+8070(stat)+−4030(syst) fb 3.1 2`+3`+4` ttW+ttZ 380−+10090 (stat)+−8070(syst) fb 3.7
When calculating the one-dimensional fit of one process, the cross section of the other process is constrained to have the theoretical SM value with a systematic uncertainty of 50%.
As visible from Fig. 2 and Table 1, less than 10% of the events selected by the same-sign dilepton channels are expected to stem from ttZ production. The extracted ttW cross section varies by approximately 10% when the used ttZ cross section is altered to as much as 0.5–1.5 times its nominal theoretical value. For an equivalent modification of the ttW production rate, the variation of the extracted ttZ cross section is less than 2%. The dependence of the measured cross section on the assumed cross section of the other ttV process is solved by performing a simultaneous fit of the cross sections of the two processes using all dilepton, trilepton, and four-lepton channels at the same time.
The result of the fit is shown visually in Fig. 5 and the cross sections are summarized numeri-cally in Table 6. The cross sections extracted from this two-dimensional fit are identical to those obtained from the two one-dimensional fits.
17 [fb] W t t σ 0 100 200 300 400 500 600 [fb] Zt t σ 0 100 200 300 400 500 CMS (8 TeV) -1 19.5 fb 2-D best fit 68% contour 95% contour 1-D best fit σ 1 ± Z t 1-D t σ 1 ± W t 1-D t Z theory t t W theory t t
Figure 5: The result of the two-dimensional best fit for ttW and ttZ cross sections (cross sym-bol) is shown along with its 68 and 95% confidence level contours. The result of this fit is superimposed with the separate ttW and ttZ cross section measurements, and the correspond-ing 1 standard deviation (1σ) bands, obtained from the dilepton, and the trilepton/four-lepton channels, respectively. The figure also shows the predictions from theory and the correspond-ing uncertainties.
Table 6: Results for the two dimensional fit of the ttW and ttZ cross sections. Channels used ttW cross section ttZ cross section
2`+3`+4` 170+−110100(total) fb 200±90 (total) fb
Finally, a one-dimensional fit of all channels is performed to extract a combined cross section σttV =380+−10090 (stat)+−8070(syst) fb with a significance of 3.7 standard deviations.
9
Summary
A measurement with the CMS detector of the cross section of top quark-antiquark pair produc-tion in associaproduc-tion with a W or Z boson at√s = 8 TeV has been presented. Results from three independent channels, and their combination, have been reported. In the same-sign dilepton channel, the ttW cross section has been measured to be σttW = 170+−9080(stat)±70 (syst) fb, cor-responding to a significance of 1.6 standard deviations over the background-only hypothesis. In the trilepton and four-lepton channels the ttZ signal has been established with a significance of 2.3 and 2.2 standard deviations, respectively. From the combination of these two channels, a significance of 3.1 standard deviations has been obtained and the cross section has been mea-sured to be σttZ=200+−8070(stat)+−4030(syst) fb.
Combining the total of nine sub-channels from the three lepton decay modes, a ttV cross section (V equal W or Z) of σttV = 380+−10090 (stat)+−8070(syst) fb has been obtained, corresponding to a combined significance of 3.7 standard deviations. The measured values are compatible within their uncertainties with standard model predictions.
18 References
Acknowledgements
We congratulate our colleagues in the CERN accelerator departments for the excellent perfor-mance of the LHC and thank the technical and administrative staffs at CERN and at other CMS institutes for their contributions to the success of the CMS effort. In addition, we gratefully acknowledge the computing centres and personnel of the Worldwide LHC Computing Grid for delivering so effectively the computing infrastructure essential to our analyses. Finally, we acknowledge the enduring support for the construction and operation of the LHC and the CMS detector provided by the following funding agencies: BMWFW and FWF (Austria); FNRS and FWO (Belgium); CNPq, CAPES, FAPERJ, and FAPESP (Brazil); MES (Bulgaria); CERN; CAS, MoST, and NSFC (China); COLCIENCIAS (Colombia); MSES and CSF (Croatia); RPF (Cyprus); MoER, ERC IUT and ERDF (Estonia); Academy of Finland, MEC, and HIP (Finland); CEA and CNRS/IN2P3 (France); BMBF, DFG, and HGF (Germany); GSRT (Greece); OTKA and NIH (Hungary); DAE and DST (India); IPM (Iran); SFI (Ireland); INFN (Italy); NRF and WCU (Re-public of Korea); LAS (Lithuania); MOE and UM (Malaysia); CINVESTAV, CONACYT, SEP, and UASLP-FAI (Mexico); MBIE (New Zealand); PAEC (Pakistan); MSHE and NSC (Poland); FCT (Portugal); JINR (Dubna); MON, RosAtom, RAS and RFBR (Russia); MESTD (Serbia); SEIDI and CPAN (Spain); Swiss Funding Agencies (Switzerland); MST (Taipei); ThEPCenter, IPST, STAR and NSTDA (Thailand); TUBITAK and TAEK (Turkey); NASU and SFFR (Ukraine); STFC (United Kingdom); DOE and NSF (USA).
Individuals have received support from the Marie-Curie programme and the European Re-search Council and EPLANET (European Union); the Leventis Foundation; the A. P. Sloan Foundation; the Alexander von Humboldt Foundation; the Belgian Federal Science Policy Of-fice; the Fonds pour la Formation `a la Recherche dans l’Industrie et dans l’Agriculture (FRIA-Belgium); the Agentschap voor Innovatie door Wetenschap en Technologie (IWT-(FRIA-Belgium); the Ministry of Education, Youth and Sports (MEYS) of the Czech Republic; the Council of Sci-ence and Industrial Research, India; the HOMING PLUS programme of Foundation for Polish Science, cofinanced from European Union, Regional Development Fund; the Compagnia di San Paolo (Torino); the Thalis and Aristeia programmes cofinanced by EU-ESF and the Greek NSRF; and the National Priorities Research Program by Qatar National Research Fund.
References
[1] CDF Collaboration, “Observation of Top Quark Production in pp Collisions with the Collider Detector at Fermilab”, Phys. Rev. Lett. 74 (1995) 2626,
doi:10.1103/PhysRevLett.74.2626, arXiv:hep-ex/9503002.
[2] D0 Collaboration, “Observation of the Top Quark”, Phys. Rev. Lett. 74 (1995) 2632, doi:10.1103/PhysRevLett.74.2632.
[3] S. L. Glashow, “Partial-symmetries of weak interactions”, Nucl. Phys. 22 (1961) 579, doi:10.1016/0029-5582(61)90469-2.
[4] S. Weinberg, “A Model of Leptons”, Phys. Rev. Lett. 19 (1967) 1264, doi:10.1103/PhysRevLett.19.1264.
[5] A. Salam, “Weak and electromagnetic interactions”, in Elementary particle physics: relativistic groups and analyticity, N. Svartholm, ed., p. 367. Almqvist & Wiskell, 1968. Proceedings of the eighth Nobel symposium.
References 19
[6] R. M. Barnett, J. F. Gunion, and H. E. Haber, “Discovering supersymmetry with like-sign dileptons”, Phys. Lett. B 315 (1993) 349, doi:10.1016/0370-2693(93)91623-U, arXiv:hep-ph/9306204.
[7] M. Guchait and D. P. Roy, “Like-sign dilepton signature for gluino production at CERN LHC including top quark and Higgs boson effects”, Phys. Rev. D 52 (1995) 133,
doi:10.1103/PhysRevD.52.133, arXiv:hep-ph/9412329.
[8] H. Baer, C.-h. Chen, F. Paige, and X. Tata, “Signals for minimal supergravity at the CERN large hadron collider. II: Multi-lepton channels”, Phys. Rev. D 53 (1996) 6241,
doi:10.1103/PhysRevD.53.6241, arXiv:hep-ph/9512383.
[9] CMS Collaboration, “Search for new physics in events with same-sign dileptons and jets in pp collisions at√s = 8 TeV”, JHEP 01 (2014) 163,
doi:10.1007/JHEP01(2014)163, arXiv:1311.6736.
[10] CMS Collaboration, “Search for anomalous production of multilepton events in pp collisions at√s=7 TeV”, JHEP 06 (2012) 169, doi:10.1007/JHEP06(2012)169, arXiv:1204.5341.
[11] CDF Collaboration, “Evidence for t¯tγ Production and Measurement of σt¯tγ/σt¯t”, Phys. Rev. D 84 (2011) 031104, doi:10.1103/PhysRevD.84.031104, arXiv:1106.3970. [12] CMS Collaboration, “Measurement of associated production of vector bosons and top
quark-antiquark pairs at√s = 7 TeV”, Phys. Rev. Lett. 110 (2013) 172002, doi:10.1103/PhysRevLett.110.172002, arXiv:1303.3239.
[13] H.-L. Lai et al., “New parton distributions for collider physics”, Phys. Rev. D 82 (2010) 074024, doi:10.1103/PhysRevD.82.074024, arXiv:1007.2241.
[14] J. Alwall et al., “The automated computation of tree-level and next-to-leading order differential cross sections, and their matching to parton shower simulations”, JHEP 07 (2014) 079, doi:10.1007/JHEP07(2014)079, arXiv:1405.0301.
[15] S. Frixione and B. R. Webber, “Matching NLO QCD computations and parton shower simulations”, JHEP 06 (2002) 029, doi:10.1088/1126-6708/2002/06/029, arXiv:hep-ph/0204244.
[16] J. M. Campbell and R. K. Ellis, “t¯tW±production and decay at NLO”, JHEP 07 (2012) 052, doi:10.1007/JHEP07(2012)052, arXiv:1204.5678.
[17] M. V. Garzelli, A. Kardos, C. G. Papadopoulos, and Z. Trocsanyi, “t¯tW±and t¯tZ hadroproduction at NLO accuracy in QCD with Parton Shower and Hadronization effects”, JHEP 11 (2012) 056, doi:10.1007/JHEP11(2012)056,
arXiv:1208.2665.
[18] CMS Collaboration, “The CMS experiment at the CERN LHC”, JINST 3 (2008) S08004, doi:10.1088/1748-0221/3/08/S08004.
[19] CMS Collaboration, “Particle–Flow Event Reconstruction in CMS and Performance for Jets, Taus, and EmissT ”, CMS Physics Analysis Summary CMS-PAS-PFT-09-001, 2009. [20] CMS Collaboration, “Commissioning of the Particle-flow Event Reconstruction with the
first LHC collisions recorded in the CMS detector”, CMS Physics Analysis Summary CMS-PAS-PFT-10-001, 2010.
20 References
[21] M. Cacciari, G. P. Salam, and G. Soyez, “The anti-ktjet clustering algorithm”, JHEP 04
(2008) 063, doi:10.1088/1126-6708/2008/04/063, arXiv:0802.1189.
[22] CMS Collaboration, “Determination of jet energy calibration and transverse momentum resolution in CMS”, JINST 6 (2011) P11002,
doi:10.1088/1748-0221/6/11/P11002, arXiv:1107.4277.
[23] M. Cacciari, G. P. Salam, and G. Soyez, “The catchment area of jets”, JHEP 04 (2008) 005, doi:10.1088/1126-6708/2008/04/005, arXiv:0802.1188.
[24] CMS Collaboration, “Measurements of differential jet cross sections in proton-proton collisions at√s=7 TeV with the CMS detector”, Phys. Rev. D 87 (2013) 112002, doi:10.1103/PhysRevD.87.112002, arXiv:1212.6660.
[25] CMS Collaboration, “Pileup Jet Identification”, CMS Physics Analysis Summary CMS-PAS-JME-13-005, 2013.
[26] CMS Collaboration, “Performance of b tagging at√s=8 TeV in multijet, ttbar and boosted topology events”, CMS Physics Analysis Summary CMS-PAS-BTV-13-001, 2013. [27] CMS Collaboration, “Performance of CMS muon reconstruction in pp collision events at√
s =7 TeV”, JINST 7 (2012) P10002, doi:10.1088/1748-0221/7/10/P10002, arXiv:1206.4071.
[28] CMS Collaboration, “Electron Reconstruction and Identification at√s=7 TeV”, CMS Physics Analysis Summary CMS-PAS-EGM-10-004, 2010.
[29] CMS Collaboration, “Observation of a new boson with mass near 125 GeV in pp collisions at√s = 7 and 8 TeV”, JHEP 06 (2013) 081,
doi:10.1007/JHEP06(2013)081, arXiv:1303.4571.
[30] J. Alwall et al., “MADGRAPH5: going beyond”, JHEP 06 (2011) 128, doi:10.1007/JHEP06(2011)128, arXiv:1106.0522.
[31] T. Sj ¨ostrand, S. Mrenna, and P. Z. Skands, “PYTHIA6.4 physics and manual”, JHEP 05
(2006) 026, doi:10.1088/1126-6708/2006/05/026, arXiv:hep-ph/0603175. [32] GEANT4 Collaboration, “GEANT4 – a simulation toolkit”, Nucl. Instrum. Meth. A 506
(2003) 250, doi:10.1016/S0168-9002(03)01368-8.
[33] P. M. Nadolsky et al., “Implications of CTEQ global analysis for collider observables”, Phys. Rev. D 78 (2008) 013004, doi:10.1103/PhysRevD.78.013004,
arXiv:0802.0007.
[34] Particle Data Group Collaboration, “Review of Particle Physics”, Phys. Rev. D 86 (2012) 010001, doi:10.1103/PhysRevD.86.010001.
[35] CMS Collaboration, “Study of double parton scattering using W + 2-jet events in proton-proton collisions at√s = 7 TeV”, JHEP 03 (2014) 032,
doi:10.1007/JHEP03(2014)032, arXiv:1312.5729.
[36] CMS Collaboration, “CMS Luminosity Based on Pixel Cluster Counting - Summer 2013 Update”, CMS Physics Analysis Summary CMS-PAS-LUM-13-001, 2013.
References 21
[37] CMS Collaboration, “Measurement of B ¯B Angular Correlations based on Secondary Vertex Reconstruction at√s=7 TeV”, JHEP 03 (2011) 136,
doi:10.1007/JHEP03(2011)136, arXiv:1102.3194.
[38] CMS Collaboration, “Identification of b-quark jets with the CMS experiment”, JINST 8 (2013) P04013, doi:10.1088/1748-0221/8/04/P04013, arXiv:1211.4462. [39] S. Alekhin et al., “The PDF4LHC Working Group Interim Report”, (2011).
arXiv:1101.0536.
[40] M. Botje et al., “The PDF4LHC Working Group Interim Recommendations”, (2011). arXiv:1101.0538.
[41] NNPDF Collaboration, “Impact of heavy quark masses on parton distributions and LHC Phenomenology”, Nucl. Phys. B 849 (2011) 296,
doi:10.1016/j.nuclphysb.2011.03.021, arXiv:1101.1300.
[42] A. D. Martin, W. J. Stirling, R. S. Thorne, and G. Watt, “Parton distributions for the LHC”, Eur. Phys. J. C 63 (2009) 189, doi:10.1140/epjc/s10052-009-1072-5,
23
A
The CMS Collaboration
Yerevan Physics Institute, Yerevan, Armenia
V. Khachatryan, A.M. Sirunyan, A. Tumasyan
Institut f ¨ur Hochenergiephysik der OeAW, Wien, Austria
W. Adam, T. Bergauer, M. Dragicevic, J. Er ¨o, C. Fabjan1, M. Friedl, R. Fr ¨uhwirth1, V.M. Ghete, C. Hartl, N. H ¨ormann, J. Hrubec, M. Jeitler1, W. Kiesenhofer, V. Kn ¨unz, M. Krammer1, I. Kr¨atschmer, D. Liko, I. Mikulec, D. Rabady2, B. Rahbaran, H. Rohringer, R. Sch ¨ofbeck,
J. Strauss, A. Taurok, W. Treberer-Treberspurg, W. Waltenberger, C.-E. Wulz1
National Centre for Particle and High Energy Physics, Minsk, Belarus
V. Mossolov, N. Shumeiko, J. Suarez Gonzalez
Universiteit Antwerpen, Antwerpen, Belgium
S. Alderweireldt, M. Bansal, S. Bansal, T. Cornelis, E.A. De Wolf, X. Janssen, A. Knutsson, S. Luyckx, S. Ochesanu, B. Roland, R. Rougny, M. Van De Klundert, H. Van Haevermaet, P. Van Mechelen, N. Van Remortel, A. Van Spilbeeck
Vrije Universiteit Brussel, Brussel, Belgium
F. Blekman, S. Blyweert, J. D’Hondt, N. Daci, N. Heracleous, J. Keaveney, S. Lowette, M. Maes, A. Olbrechts, Q. Python, D. Strom, S. Tavernier, W. Van Doninck, P. Van Mulders, G.P. Van Onsem, I. Villella
Universit´e Libre de Bruxelles, Bruxelles, Belgium
C. Caillol, B. Clerbaux, G. De Lentdecker, D. Dobur, L. Favart, A.P.R. Gay, A. Grebenyuk, A. L´eonard, A. Mohammadi, L. Perni`e2, T. Reis, T. Seva, L. Thomas, C. Vander Velde, P. Vanlaer, J. Wang
Ghent University, Ghent, Belgium
V. Adler, K. Beernaert, L. Benucci, A. Cimmino, S. Costantini, S. Crucy, S. Dildick, A. Fagot, G. Garcia, J. Mccartin, A.A. Ocampo Rios, D. Ryckbosch, S. Salva Diblen, M. Sigamani, N. Strobbe, F. Thyssen, M. Tytgat, E. Yazgan, N. Zaganidis
Universit´e Catholique de Louvain, Louvain-la-Neuve, Belgium
S. Basegmez, C. Beluffi3, G. Bruno, R. Castello, A. Caudron, L. Ceard, G.G. Da Silveira, C. Delaere, T. du Pree, D. Favart, L. Forthomme, A. Giammanco4, J. Hollar, P. Jez, M. Komm, V. Lemaitre, C. Nuttens, D. Pagano, L. Perrini, A. Pin, K. Piotrzkowski, A. Popov5, L. Quertenmont, M. Selvaggi, M. Vidal Marono, J.M. Vizan Garcia
Universit´e de Mons, Mons, Belgium
N. Beliy, T. Caebergs, E. Daubie, G.H. Hammad
Centro Brasileiro de Pesquisas Fisicas, Rio de Janeiro, Brazil
W.L. Ald´a J ´unior, G.A. Alves, L. Brito, M. Correa Martins Junior, T. Dos Reis Martins, C. Mora Herrera, M.E. Pol
Universidade do Estado do Rio de Janeiro, Rio de Janeiro, Brazil
W. Carvalho, J. Chinellato6, A. Cust ´odio, E.M. Da Costa, D. De Jesus Damiao, C. De Oliveira Martins, S. Fonseca De Souza, H. Malbouisson, D. Matos Figueiredo, L. Mundim, H. Nogima, W.L. Prado Da Silva, J. Santaolalla, A. Santoro, A. Sznajder, E.J. Tonelli Manganote6, A. Vilela Pereira
24 A The CMS Collaboration
Universidade Estadual Paulistaa, Universidade Federal do ABCb, S˜ao Paulo, Brazil
C.A. Bernardesb, S. Dograa, T.R. Fernandez Perez Tomeia, E.M. Gregoresb, P.G. Mercadanteb, S.F. Novaesa, Sandra S. Padulaa
Institute for Nuclear Research and Nuclear Energy, Sofia, Bulgaria
A. Aleksandrov, V. Genchev2, P. Iaydjiev, A. Marinov, S. Piperov, M. Rodozov, S. Stoykova, G. Sultanov, V. Tcholakov, M. Vutova
University of Sofia, Sofia, Bulgaria
A. Dimitrov, I. Glushkov, R. Hadjiiska, V. Kozhuharov, L. Litov, B. Pavlov, P. Petkov
Institute of High Energy Physics, Beijing, China
J.G. Bian, G.M. Chen, H.S. Chen, M. Chen, R. Du, C.H. Jiang, S. Liang, R. Plestina7, J. Tao, X. Wang, Z. Wang
State Key Laboratory of Nuclear Physics and Technology, Peking University, Beijing, China
C. Asawatangtrakuldee, Y. Ban, Y. Guo, Q. Li, W. Li, S. Liu, Y. Mao, S.J. Qian, D. Wang, L. Zhang, W. Zou
Universidad de Los Andes, Bogota, Colombia
C. Avila, L.F. Chaparro Sierra, C. Florez, J.P. Gomez, B. Gomez Moreno, J.C. Sanabria
Technical University of Split, Split, Croatia
N. Godinovic, D. Lelas, D. Polic, I. Puljak
University of Split, Split, Croatia
Z. Antunovic, M. Kovac
Institute Rudjer Boskovic, Zagreb, Croatia
V. Brigljevic, K. Kadija, J. Luetic, D. Mekterovic, L. Sudic
University of Cyprus, Nicosia, Cyprus
A. Attikis, G. Mavromanolakis, J. Mousa, C. Nicolaou, F. Ptochos, P.A. Razis
Charles University, Prague, Czech Republic
M. Bodlak, M. Finger, M. Finger Jr.8
Academy of Scientific Research and Technology of the Arab Republic of Egypt, Egyptian Network of High Energy Physics, Cairo, Egypt
Y. Assran9, A. Ellithi Kamel10, M.A. Mahmoud11, A. Radi12,13
National Institute of Chemical Physics and Biophysics, Tallinn, Estonia
M. Kadastik, M. Murumaa, M. Raidal, A. Tiko
Department of Physics, University of Helsinki, Helsinki, Finland
P. Eerola, G. Fedi, M. Voutilainen
Helsinki Institute of Physics, Helsinki, Finland
J. H¨ark ¨onen, V. Karim¨aki, R. Kinnunen, M.J. Kortelainen, T. Lamp´en, K. Lassila-Perini, S. Lehti, T. Lind´en, P. Luukka, T. M¨aenp¨a¨a, T. Peltola, E. Tuominen, J. Tuominiemi, E. Tuovinen, L. Wendland
Lappeenranta University of Technology, Lappeenranta, Finland
T. Tuuva
DSM/IRFU, CEA/Saclay, Gif-sur-Yvette, France