Jet and photon measurements from ATLAS
J. G. SaraivaaOn behalf of the ATLAS CollaborationLIP (Laborat´orio de Instrumentac¸˜ao e F´ısica Experimental de Particulas), Av. Elias Garcia 14-1◦, 1000-149 Lisboa, Portugal
Abstract. Differential cross-section measurements of inclusive-jet and di-jet production provide stringent tests
of perturbative QCD predictions and provide inputs for determination of parton density functions. Ratios of jet multiplicities are sensitive to αs and have reduced theoretical uncertainties. Measurements of the inclusive
isolated-photon and di-photon cross-sections provide a direct probe of short-distance physics, complementary to that from measurements of jets or vector-bosons and are sensitive to the gluon density in the proton. The measurements are compared to next-to-leading-order or higher-order QCD calculations.
1 Introduction
ATLAS is a general purpose detector operating within the LHC experiment. The main goals of ATLAS are searches of the Higgs boson, study of the properties of the top quark and search for new physics. High-precision measurements to make novel tests of perturbative QCD (pQCD) will also be possible due to the higher centre-of-mass energy (√s) available at LHC than in previous accelerators. In this pa-per, measurements of jets and photons at ATLAS are pre-sented. These measurements are one of the tools that can be used at LHC to increase the understanding of QCD in-teractions. In particular, they allow the testing of pQCD down to the shortest accessible distances. Their sensitivity to the proton parton distribution functions (PDFs) make them adequate to measure the strong coupling constant αs and to the improvement of the determination of the PDFs. Photons are colorless probes to QCD and can be used to constrain the proton PDFs. Di-photons processes are in ad-dition an important background for the identification of the Higgs boson in the H → γγ channel. Comparison of data and next-to-leading-order (NLO) and next-to-next-leading-order (NNLO) QCD theoretical calculations are the main focus of this paper.
2 inclusive-jet measurements
2.1 cross-section for √s= 2.76 TeV
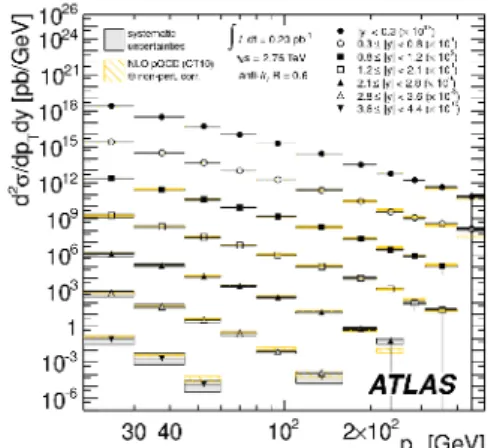
The inclusive-jet cross-section was measured [1] using an integrated luminosity of L = 0.20 pb−1. Jets are recon-structed using the anti-ktalgorithm with a distance param-eter R = 0.6. The jets were required to have a transverse momentum pT ⊂ [20,430] GeV and rapidity |y| < 4.4. The data are compared with theoretical calculations from NLO QCD predictions using NLOJ++ with the CT10 PDF set, to which non-perturbative corrections have been applied. Figure 1 shows the results for the double-differential jet cross-section dσ2/dpTdy. Figure 2 shows the ratios of the
a e-mail: [email protected]. Acknowledgments are due to
GRICES and FCT. With the FCT grant SFRH/BPD/73474/2010.
Fig. 1. Measured double-differential inclusive-jet cross sections as functions of pT in different regions of rapidity (markers). The
measurements are scaled by the factors shown in parentheses to aid visibility. The shaded areas are the experimental systematic uncertainties. The hashed areas represent the QCD predictions and their uncertainties [1].
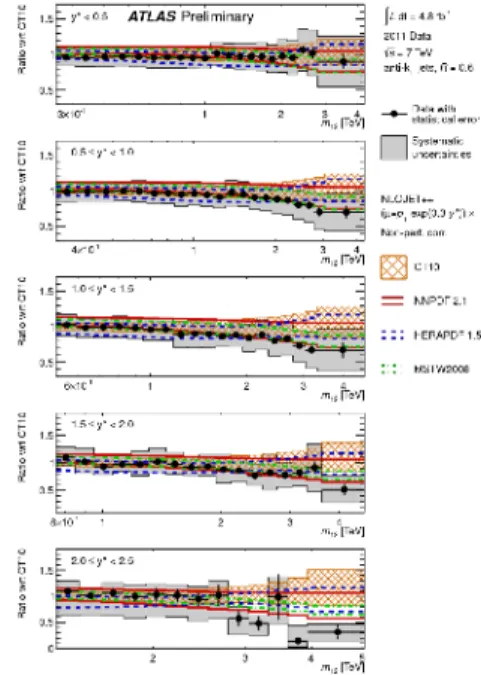
measured cross-section and the QCD predictions in di ffer-ent rapidity regions. Theoretical predictions using different PDF sets, namely MSTW 2008, NNPDF 2.1 and HER-APDF 1.5 and ABM 11 NLO, are also included in this figure. The agreement between data and theory is within 10% for |y| < 2.8. For the two highest rapidity regions, 2.8 < |y| < 3.6 and 3.6 < |y| < 4.4, the agreement be-tween data and theory is worse. The prediction based on the ABM 11 NLO PDF set gives a worse agreement for high pT values and the lowest rapidity regions. The mea-surements with √s= 2.76 TeV are compared to those with √
s = 7 TeV [2] in the double ratio presented in Figure 3. The small experimental uncertainty is due to the cancel-lation of the uncertainties between the two measurements. Figure 3 also includes other theoretical predictions with the different PDF sets already mentioned above. The data are generally slightly higher than the predictions in the central rapidity regions and slightly lower in the forward rapidity regions. A larger deviation is seen for ABM 11 NLO for the central rapidity region, as mentioned above.
This is an Open Access article distributed under the terms of the Creative Commons Attribution License 2.0, which permits unrestricted
DOI: 10.1051/epjconf/201360
© Owned by the authors, published by EDP Sciences, 2013 14007
Fig. 2. Ratio of the measurements of Figure 1 and the predictions of NLOJ++ based on the CT10 PDF set. The predictions using different PDF sets are also shown. Other details as in the caption to Figure 1 [1] .
Fig. 3. Ratio of the inclusive-jet cross section at √s= 2.76 TeV to the one at√s= 7 TeV, shown as double ratio to the theoretical prediction calculated with the CT10 PDFs as a function of pT in
different rapidity regions. Theoretical predictions using different PDFs sets are also shown [1] .
2.2 NLO QCD analysis combining HERA+ATLAS data
The previous results have shown that due to the correla-tions at different center-of-mass energies, it is possible to increase the precision of the data. These can then be used to constrain the PDF uncertainties in a global fit within the NLO QCD framework. The analysis [1] was performed using a combination of data from the HERA experiments together with ATLAS data using the HERAFitter package with the DGLAP formalism and based on a χ2 minimiza-tion. In this analysis, care was taken to avoid regions of low pT and low Q2, where the non-perturbative descrip-tions have a large uncertainty. The results of the fit for xg(x) and xS (x) are shown in Figures 4 and 5, respectively, at the scale Q2 = 1.9 GeV2. The combination of ATLAS and HERA data results in a harder gluon distribution with smaller uncertainty at high Bjorken-x than for HERA data alone. The sea quark distribution is softer at high Bjorken-xand has larger uncertainty.
3 Di-jet cross-sections
The di-jet cross-section was measured using data from 2011 with√s= 7 TeV, corresponding to an integrated luminos-ity of L = 4.8 fb−1 [3]. The jets were reconstructed us-ing the anti-ktalgorithm with distance parameter R= 0.6. The leading jet was selected with pT > 100 GeV and
Fig. 4. The extracted gluon xg(x) momentum distribution and the relative experimental uncertainty as a function of x for Q2 = 1.9
GeV2[1].
Fig. 5. The extracted sea quark xS (x) momentum distribution and the relative experimental uncertainty as a function of x for Q2 =
1.9 GeV2[1].
Fig. 6. Ratio of the measured double-differential di-jet cross sec-tion and NLOJ++ based on the CT10 PDF set as a funcsec-tion of the di-jet mass in different regions of y∗. The predictions based
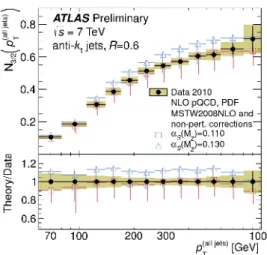
Fig. 7. The measured cross-section fraction N3/2as a function of
pT. The NLOJ++ predictions for αs(MZ) = 0.110 and 0.130
based on MSTW2008NLO and including non-perturbative cor-rections arealso included. The error bars in the predictions in-clude the full theoretical uncertainty and are shifted to aid visi-bility [4].
the sub-leading jet was required to have pT > 50 GeV. Both jets were required to have rapidities |y| < 2.8. The dijet cross-section was measured as a function of the in-variant mass and y∗ = |yj1 −yj2|/2. The measurements span invariant masses from 260 GeV to 4.6 TeV. Theoret-ical predictions calculated with NLOJ++ based on the CT10 PDF set and including non-perturbative corrections are compared to the data. Figure 6 shows the ratio between the measurements and the predictions. Comparisons with theoretical predictions using different PDF sets, namely MSTW2008, NNPDF 2.1 and HERAPDF 1.5, are also in-cluded in the figure. For all y∗regions, data and theory, in-dependently of the PDF set used, show a good agreement for m12 < 2.5 TeV. Above this value the theory predicts a higher cross-section.
4 Multi-jet cross-sections and
determination of
α
sThe multi-jet cross-section was also measured using 2010 data with a √s= 7 TeV [4]. Jets were reconstructed using the anti-kt algorithm with ae distance parameter R = 0.6 and were required to have rapidities |y| < 2.8. The lead-ing jet was required to have pT > 60 GeV and the other jets should have pT > 40 GeV. The ratio of cross-sections for multi-jets is a quantity sensitive to the strong coupling constant αs. The ratio
N3/2(pT)= Pn 0 jet i dσNjet≥3/dpT,i Pn 00 jet i dσNjet≥2/dpT,i
was measured as a function of pT. The measured N3/2 is presented in Figure 7. The NLO QCD predictions using NLOJ++ based on MSTW2008NLO including non--perturbative corrections with αs(MZ) = 0.110 and 0.130 are also shown in this figure. A least-squares fit to the mea-surements results in the value
αs(MZ)= 0.111 ± 0.006 (exp.)+0.016−0.003(theory).
Table 1. The values of αsdetermined using different PDF sets in
the NLO predictions. The uncertainty includes only the experi-mental source [4]. PDF αs MSTW08 0.111 ± 0.006 CT10 0.109 ± 0.006 HERAPDF 1.5 0.114 ± 0.005 ABM 1.5 0.116 ± 0.005 NNPDF 2.3 0.112 ± 0.005
Fig. 8. The strong coupling constant αsfrom ATLAS [4], DØ [8],
ZEUS [9] and H1 [10] as a function of the scale Q. For ATLAS, the error bars correspond to the experimental uncertainties while the shaded region is the total uncertainty. For the other experi-ments the error bars correspond to the total uncertainty [4].
This result is in agreement with the world average and with determinations from other experiments:
0.1184 ± 0.0007 (world average) [5] 0.1178 ± 0.0001 (stat.)+0.0081−0.0095(syst.) (CDF) [7]
0.1191+0.0048−0.0071(DØ) [8]
In Table 1 the results of αsusing different PDF sets show an independence on the PDF input used in the theoretical predictions. The results for the running of αsare shown in Figure 8. ATLAS data covers the region of Q ⊂ [200,800] GeV, compatible with the predictions from the Renormal-ization Group Equation (RGE) [6] based on the world av-erage αs.
5 Isolated-photon cross-sections
Measurements of the isolated-photon differential cross--sections as functions of EγT and ηγwere made using 2011 data with an intergrated luminosity of L = 4.7 fb−1 for √
s = 7 TeV [11]. The photons were selected with 100 < EγT < 1000 GeV and |ηγ| < 1.37 and 1.52 ≤ |ηγ| ≤ 2.37. The data are compared to NLO and LO theoretical pre-dictions: (i) NLO QCD J 1.3 + BFG set II that in-cludes direct and fragmentation processes and using two proton PDF sets, namely CT10 and MSTW2008 NLO (ii) leading-logarithm parton shower predictions of P 6.4
Fig. 9. Measured isolated-photon differential cross section as a function of EγT. The inner error bars show statistical uncertainties while the outer bars are the full uncertainties. The LO and NLO theoretical predictions detailed in the text are also included. The shaded region represent the full theoretical uncertainty [11].
Fig. 10. Measured isolated-photon differential cross section as a function of ηγ. Other details as in the caption to Figure 9 [11].
and H 6.5, which include the 2 → 2 processes qg → qγ and qq → qγ, based on MRST2007LO proton PDF sets. The AMBT2 and AUET2 tunes were used for P and H, respectively. Figure 9 shows the differential cross-section as a function of ETγ. The theoretical predic-tions describe the data. Figure 10 shows the differential cross-section as a function of ηγ; the theoretical predictions underestimate the measurements in all the regions consid-ered. The measured integrated cross-section for isolated-photons is σ(pp → γ+ X) = 234 ± 2 (stat)+13−9 (syst) ± 4 (lumi) pb for |ηγ| < 1.37 and σ(pp → γ + X) = 122 ± 2 (stat)+9−7(syst)±2 (lumi) pb for 1.52 < |ηγ|< 2.37. Table 1 summarizes the total cross-section for these two pseudora-pidity regions for the four theoretical predictions consid-ered in this study.
6 Di-photon cross-sections
For the di-photon cross-section measurements [12], the com-plete 2011 data set of √s= 7 TeV was used, correspond-ing to L = 4.9 fb−1. The photon selection required two
Table 2. Predicted integrated cross sections for isolated-photon production [11]. Model σ(pp → γ + X) (pb) |η| < 1.37 1.52 < |η| < 2.37 PYTHIA 224 118 HERWIG 187 99 JETPHOX CT10 203 ± 25 105 ± 15 JETPHOX MSTW2008 212 ± 24 109 ± 15
Table 3. Predicted integrated cross sections for isolated-photon pair production [12]. Model σ(pp → γγ + X) (pb) 2γNNLO MSTW2008 NNLO 44+6−5 DIPHOX+GAMMA2MC CT10 NLO 39+7−6 PYTHIA MRST2007LO 36 SHERPA CTEQ6L1 36
isolated-photons with EγT > 25(22) GeV for the (sub-)leading photon and an angular separation of ∆R > 0.4 and within the same pseudorapidity range mentioned in Section 5. The measured integrated cross-section measured is σ(pp → γγ + X) = 44+3.2
−4.2pb. The theoretical predictions are shown in Table 3. The LO models underestimate the data by 20%. The NLO D+G2MC prediction underestimates the data by 10% whereas the 2γNNLO reproduces the data well. Figures 11 and 12 show the measured differential
Fig. 11. Measured differential cross section as a function of pγγ T.
The predictions from D+G2MC and 2γNNLO are also shown [12].
cross-sections as functions of pT,γγand ∆φγγtogether with the higher-order theoretical predictions. The D calcu-lation underestimates the data in the full range considered whereas 2γNNLO prediction is much closer to the mea-sured results, except in the regions where the
fragmenta-Fig. 12. Measured differential cross section as a function of ∆φγγ.
Other details as in the caption to Figure 11 [12].
tion component (not included in this calculation) is still significant.
References
1. ATLAS Collaboration, CERN-PH-EP-2013-036 (sub-mitted to: Eur. Phys. J. C) [arXiv:1304.4739v1], 2013 2. ATLAS Collaboration, Phys. Rev. D 86 (2012) 014022,
arXiv:1112.6297
3. ATLAS Collaboration, ATLAS-CONF-2012-021, 2012 (http://cds.cern.ch/record/1430730/files/ ATLAS-CONF-2012-021.pdf)
4. ATLAS Collaboration, ATLAS-CONF-2013-041, 2013 (http://cds.cern.ch/record/1543225/files/ ATLAS-CONF-2013-041.pdf)
5. S. Bethke, Eur. Phys. J.C64(2009) 689-703
6. J. Beringer et al., Review of Particle Physics, Phys.Rev.D86(2012) 010001
7. T. Affolder et al., Phys. Lett. 88(2002) 042001 8. V. M. Abazov et al., Phys. Rev. D 80 (2009) 111107 9. H. Abramowicz et al., Nucl.Phys. B864 (2012) 1 10. Aktas, A. et al., Eur.Phys.J. C65 (2010) 363-383 11. ATLAS Collaboration, ATLAS-CONF-2013-022,
2013 (http://cds.cern.ch/record/1525723/ files/ATLAS-CONF-2013-022.pdf)
12. ATLAS Collaboration, CERN-PH-EP-2012-300 (sub-mitted to: JHEP) [arXiv:1211.1913v2], 2013
![Fig. 11. Measured differential cross section as a function of p γγ T . The predictions from D + G 2MC and 2γNNLO are also shown [12].](https://thumb-eu.123doks.com/thumbv2/123dok_br/15696477.1066486/4.892.501.767.642.993/measured-differential-cross-section-function-predictions-γnnlo-shown.webp)
![Fig. 12. Measured di ff erential cross section as a function of ∆φ γγ . Other details as in the caption to Figure 11 [12].](https://thumb-eu.123doks.com/thumbv2/123dok_br/15696477.1066486/5.892.122.383.94.445/measured-erential-cross-section-function-details-caption-figure.webp)
