BGD
8, 1–25, 2011 N retention in a Mediterranean maquis T. Dias et al. Title Page Abstract Introduction Conclusions References Tables Figures J I J I Back CloseFull Screen / Esc
Printer-friendly Version Interactive Discussion Discussion P a per | Dis cussion P a per | Discussion P a per | Discussio n P a per | Biogeosciences Discuss., 8, 1–25, 2011 www.biogeosciences-discuss.net/8/1/2011/ doi:10.5194/bgd-8-1-2011
© Author(s) 2011. CC Attribution 3.0 License.
Biogeosciences Discussions
This discussion paper is/has been under review for the journal Biogeosciences (BG). Please refer to the corresponding final paper in BG if available.
The strength of the biotic compartment
to retain nitrogen additions prevents
nitrogen losses from a Mediterranean
maquis
T. Dias1, M. A. Martins-Louc¸ ˜ao1, L. Sheppard2, and C. Cruz1
1
Universidade de Lisboa, Faculdade de Ci ˆencias, Centro de Biologia Ambiental (CBA), Campo Grande, 1749-016 Lisboa, Portugal
2
Centre of Ecology and Hydrology (CEH), Bush Estate, Penicuik, EH26 OQB, UK Received: 7 July 2011 – Accepted: 1 August 2011 – Published:
Correspondence to: T. Dias ([email protected])
BGD
8, 1–25, 2011 N retention in a Mediterranean maquis T. Dias et al. Title Page Abstract Introduction Conclusions References Tables Figures J I J I Back CloseFull Screen / Esc
Printer-friendly Version Interactive Discussion Discussion P a per | Dis cussion P a per | Discussion P a per | Discussio n P a per | Abstract
Nitrogen (N) is one of the nutrients most limiting to ecosystem productivity. However, N availability is increasing globally, which may affect ecosystem functions and stability. To understand the role of each ecosystem compartment in the cycling of increased N, we studied the initial response of a nutrient-poor ecosystem, a Mediterranean maquis, 5
to increased N. N availability (dose and forms) was modified by three N additions along the year (spring, summer and middle autumn/winter). Soil inorganic N pools (nitrate in particular) strongly reflected the N additions in autumn, almost matching the total N added along the three additions. Cistus ladanifer, the dominant plant species, re-sponded to the increased N (cover and N concentration in leaves and litter), and given 10
that leaf shedding occurs in the summer, the importance of this N pool returning to the soil through litter decomposition on the total soil inorganic N in autumn was in-vestigated. Data suggest that living plants and litter have a crucial role in preventing N losses from Mediterranean maquis. This is the first integrated field study on how European Mediterranean ecosystems retain increased N of different forms and doses, 15
however longer-term studies are needed to explore the generality of this study’s obser-vations.
1 Introduction
Temporal patterns of inorganic nitrogen (N) turnover and plant growth can influence important aspects of plant community and ecosystem dynamics; e.g. N losses, plant 20
productivity, community composition, changes in N and/or phosphorus (P) limitation, decomposition rates and N niche complementarity (Augustine and McNaughton, 2004). Anthropogenic activities have led to global N enrichment (Galloway et al., 2008), threat-ening ecosystems at local, regional and global scales (Cassman et al., 2003), since availability has become decoupled from demand. Nutrient availability is a key determi-25
BGD
8, 1–25, 2011 N retention in a Mediterranean maquis T. Dias et al. Title Page Abstract Introduction Conclusions References Tables Figures J I J I Back CloseFull Screen / Esc
Printer-friendly Version Interactive Discussion Discussion P a per | Dis cussion P a per | Discussion P a per | Discussio n P a per |
When N availability exceeds an ecosystem’s N retention capacity, a shift from a closed internal N cycle to an open and leaky cycle occurs, with the N in excess being leached and/or emitted from the ecosystem (de Schrijver et al., 2008). Most research on the effects of N enrichment on ecosystems has focused on temperate synchronous sys-tems (availability of resources coincides with plant growth) from northern Europe and 5
America (Bobbink et al., 2010; Phoenix et al., 2006). Therefore not much is known about asynchronous ecosystems (availability of distinct resources and plant growth do not occur at the same time) such as those in Mediterranean regions (Jackson et al., 1988). Mediterranean-type ecosystems occur worldwide and are characterized by the Mediterranean climate: hot dry summers, and mild wet winters (Rivas-Mart´ınez et al., 10
2004). The few studies of the N retention capacity of Mediterranean-type ecosystems have been made in California (e.g. Holub and Lajtha, 2004), while, as far as we are aware, none have been made of the Mediterranean Basin.
We hypothesize that the mild temperatures and non-limiting water availabilities, which result in intense biological activity during the Mediterranean spring, coincide 15
with periods of low soil inorganic N pools. During this period, most additional N is likely to be taken up by plants and microorganisms, and retained within the ecosystem’s bi-otic compartment. However, during the dry summer, a significant proportion of the N will return to the soil through leaf shedding. In autumn, when water no longer limits biological activity, N returns to the inorganic form through decomposition processes. 20
As a result, soil inorganic N pools are expected to be the highest in autumn. For this reason we studied soil inorganic N along time, plant community and the N stored in plants and litter in a Mediterranean maquis in response to N additions. Our objective was to evaluate the short-term N retention capacity of a Mediterranean maquis and un-derstand which ecosystem compartments are involved in the cycling of the increased N 25
in such an asynchronous ecosystem. Specifically, we examined relationships between the N-driven response of the N concentrations in the soil, leaves and litter through two consecutive springs (2007 and 2008).
BGD
8, 1–25, 2011 N retention in a Mediterranean maquis T. Dias et al. Title Page Abstract Introduction Conclusions References Tables Figures J I J I Back CloseFull Screen / Esc
Printer-friendly Version Interactive Discussion Discussion P a per | Dis cussion P a per | Discussion P a per | Discussio n P a per |
2 Material and methods
2.1 Study site
The study site (38◦290N–9◦010W) is in Serra da Arr ´abida in the Arr ´abida Natural Park, south of Lisbon, Portugal (a Natura 2000 site – PTCON0010 Arr ´abida/Espichel). It is located in a sub-humid thermomediterranean bioclimatic domain (Rivas-Mart´ınez 5
et al., 2004). According to records (1971–2000 – Instituto Nacional de Meteorolo-gia e Geof´ısica), mean annual precipitation is 730 mm; mean maximum temperature, 27.8◦C (August); and mean minimum temperature, 8.1◦C (January). Estimated back-ground N deposition is 5.2 kg ha−1yr−1(2.9 kg NOx+ 2.3 kg NHy– http://webdab.emep. int/Unified Model Results/AN/).
10
The study site is located on a southeast-facing slope (5 %) at 130 m a.s.l. that is pro-tected from public access and has not been affected by human activity in recent years. Soil is skeletal (15 cm depth) so that true profiles cannot be discerned and soil den-sity is 1.3 g cm−3. Silt predominates in the soil (50 %), while sand and clay contents are 32 % and 18 %, respectively (silt-sand-loam texture). The vegetation consists of 15
a dense maquis (Eunis class F5.2 – Mediterranean maquis), which developed after a fire event (summer 2003) four years before the first N addition. The vegetation is domi-nated by summer semi-deciduous species which exhibit leaf dimorphism, shedding an important fraction of their leaves and twigs in the summer, and whose development is coupled to water availability in the upper soil layers (Correia and Catarino, 1994; Cruz 20
et al., 2008). At the moment the dominant plant species is Cistus ladanifer L. (Dias et al., 2011). Other abundant plant species include Erica scoparia L., Calluna vulgaris (L.) Hull, Genista triacanthos Brot., Ulex densus Welw. ex Webb, Dittrichia viscosa L., and Myrtus communis L. Herbaceous species comprise ≈10 % of the total plant cover, of which many are annual plants.
BGD
8, 1–25, 2011 N retention in a Mediterranean maquis T. Dias et al. Title Page Abstract Introduction Conclusions References Tables Figures J I J I Back CloseFull Screen / Esc
Printer-friendly Version Interactive Discussion Discussion P a per | Dis cussion P a per | Discussion P a per | Discussio n P a per |
2.2 Experimental design and fertilization schedule
The criteria for choosing the N doses and forms used in the experiment were: (a) N doses lower than the N deposition reported for other areas in Mediterranean-type ecosystems (145 kg N ha−1yr−1 – Fenn et al., 2003; Meixner and Fenn, 2004) but high enough to establish “worst case” scenarios of N enrichment in this type of habi-5
tat; and (b) mimic the most likely N pollution scenarios in the experimental area, i.e. combined inputs from urban/industrial sites and agricultural and predominantly agricultural sources. Therefore, N availability was modified by the addition of 40 and 80 kg N ha−1yr−1 in the form of NH4NO3 (doses designated 40AN and 80AN) and 40 kg N ha−1yr−1 as a 1:1 mixture of N-NH4Cl and N-(NH4)2SO4 (designated 40A). 10
Control plots were not fertilized. Beginning in January 2007, the dry N salts were ho-mogenously added, by hand, in three equal applications over a year: spring, summer and middle autumn/winter. The N granules dissolved rapidly (1–7 days depending on the N addition period). N additions were scheduled so that no precipitation was pre-dicted for at least one week after the N addition. N additions took place in January, April 15
and August 2007; and January 2008, always following the corresponding soil sampling. Each treatment was replicated three times, 3 plots each of 400 m2. In order to restrict boundary effects and dilution processes, all measurements, analyses and sample col-lection were performed within an internal 100 m2square. To prevent N “contamination” through runoff from N-plots, the experimental plots were distributed in three rows along 20
the 5 % slope, with the controls being located in the top row.
2.3 Soil and plant sampling and plant assessment
Soil was sampled from the four corners and the centre of the internal 100 m2square of each plot. Soil samples (2 cm diameter and 15 cm depth) were removed, sieved (2 mm) and stored at 4◦C until analysis. Sampling took place in May, August and October 2007; 25
and February and April 2008, corresponding to the distinct seasons. Individual soil samples (five per plot) were used to determine soil pH, moisture and concentrations
BGD
8, 1–25, 2011 N retention in a Mediterranean maquis T. Dias et al. Title Page Abstract Introduction Conclusions References Tables Figures J I J I Back CloseFull Screen / Esc
Printer-friendly Version Interactive Discussion Discussion P a per | Dis cussion P a per | Discussion P a per | Discussio n P a per |
of nitrate (N-NO−3), ammonium (N-NH+4) and inorganic N. Bulk soil samples (equal mixtures of the five soil samples from each experimental plot) collected in May 2007 and April 2008 were used for soil characterization (Table 1, see below for methods).
The vegetation at the study site was assessed within one 5 × 5 m square per plot (within the internal 100 m2) during spring (June 2007, May 2008). C. ladanifer plant 5
cover was calculated from the total projected crown area (calculated from two perpen-dicular diameters, assuming elliptical shape).
C. ladanifer ’s leaves were sampled in spring. Samples consisted of twigs containing
approximately 4–5 pairs of fully expanded leaves. One twig per plant was sampled from ten random C. ladanifer plants within the internal 100 m2square. The leaves from 10
the ten twigs were bulked to form a composite sample per plot. Litter was sampled near to each of the five soil sampling points in each plot. Litter sampling took place on summer. Only leaf litter from C. ladanifer was analyzed.
2.4 Chemical analysis
From each individual soil sample (five per plot and per sampling time), 10 g fwt of soil 15
were used to gravimetrically determine soil water content (Kern EG300 3M). Five g (fwt) of soil were used to prepare soil water extracts (1:10 – w/v ). Soil extracts were shaken (Cassel Agitator, 600 rpm) for one hour at room temperature, centrifuged (Eppendorf Centrifuge 5403) at 5000 g for 20 min at 4◦C. The supernatant was collected and an-alyzed colorimetrically (spectrophotometer Tecan Spectra Rainbow A-5082) for nitrate 20
(Matsumura and Witjaksono, 1999), ammonium (Cruz and Martins-Louc¸ ˜ao, 2000), and for soil pH (Crison micro pH 2002). Soil inorganic N was the sum of the water ex-tracted N-NH+4 and N-NO−3, and was expressed as µg N per g of dry soil. The bulk soil samples used for determining organic matter and concentrations of total N and extractable P, potassium (K) and magnesium (Mg) were dried at 35◦C until constant 25
dry weight. Organic matter was determined according to ISO standard 10694 by loss on ignition overnight at 600◦C (Nabertherm L3/11/C6). Analysis of total N was carried out according to ISO standard 13878 by dry combustion using an elemental analyzer
BGD
8, 1–25, 2011 N retention in a Mediterranean maquis T. Dias et al. Title Page Abstract Introduction Conclusions References Tables Figures J I J I Back CloseFull Screen / Esc
Printer-friendly Version Interactive Discussion Discussion P a per | Dis cussion P a per | Discussion P a per | Discussio n P a per |
(Leco CNS). Extractable phosphorus and potassium were quantified by a modification of the Egner-Riehm method using plasma emission spectrophotometer with an opti-cal detector (ICP-OES), following extraction using ammonium lactate 0.1 M and acetic acid 0.4 M, pH 3.65–3.75. Mg was extracted with ammonium acetate 1 M, pH 7 and quantified by atomic absorption spectrophotometry with flame atomization. Leaf and 5
leaf litter samples were dried at 60◦C, grounded (MM 2000) and analyzed for total N and carbon (C – the same procedure as for soil samples).
2.5 Calculations
Changes in the cover of Cistus ladanifer over time (t0, t1) were calculated as follows: Changes over time (%)= (Parameter1−Parameter0)
(Parameter1+Parameter0)/2· 100 10
Changes in the treatments (mn) in relation to the control (Mc) were calculated as fol-lows:
Changes in relation to the control (µg g−1)=mn−MC
Where “m” corresponds to each individual value (e.g. concentration of N as soil in-organic N and litter N); “MC” corresponds to the mean value of the control for each 15
parameter; and “n” corresponds to the distinct experimental plots.
Transformation of the applied N doses into soil inorganic N concentrations (µg N g−1dwt) was based on the following soil characteristics: 15 cm depth and 1.3 g cm3 of density, resulting in ∼2000 t of soil per ha. Therefore, the addition of 40 and 80 kg N per ha corresponded to doses of 20 and 40 µg N g−1, respectively. The 20
transformation of the applied N doses into soil inorganic N concentrations will be re-ferred to as “total N added”, while the concentration of soil inorganic N in relation to the control determined in autumn will be referred to as “measured N”.
The possible contributions to the soil inorganic N concentration determined in au-tumn were identified as: inorganic N present in the soil in the previous season – [N] 25
BGD
8, 1–25, 2011 N retention in a Mediterranean maquis T. Dias et al. Title Page Abstract Introduction Conclusions References Tables Figures J I J I Back CloseFull Screen / Esc
Printer-friendly Version Interactive Discussion Discussion P a per | Dis cussion P a per | Discussion P a per | Discussio n P a per |
summer; the subsequent N addition – [N] addition; and the extra N present in the litter (in relation to the control) which was shed during the summer – [N] litter. The [N] addition and the [N] litter were also transformed into soil inorganic N in the soil (µg g−1soil dwt). The effects of the N additions on the three contributors were then compared to the control. The changes of litter N concentration in relation to the control 5
were estimated assuming an annual litter production of 2.3 t ha−1 in a Mediterranean maquis (Schultz, 2002). Then we calculated the sum of the soil inorganic N determined in the summer, the summer N application and the N contained in the litter (“calculated N”).
2.6 Statistics
10
Summary statistics of soil and plant parameters were compared for the different treat-ments. The repeated measures test (General Linear Model) was applied to assess the existence of significant interactions between time and treatment for soil and plant pa-rameters and differences per treatment in leaf and litter parameters were analyzed by a one-way ANOVA. In both cases, these were followed by a Bonferroni test (p < 0.05 for 15
all comparisons except for the changes in C. ladanifer cover p < 0.1), or by a Games-Howell test whenever homogeneity of variances was not confirmed by a Levene’s test. Differences between “total N added” and “measured N” and between “measured N” and the “calculated N” were analyzed by the t-student test (p < 0.01). In all cases, preliminary analyses were performed to ensure that there was no violation of the as-20
sumptions regarding the tests’ application. SPSS software, version 19.0, was used for all tests.
BGD
8, 1–25, 2011 N retention in a Mediterranean maquis T. Dias et al. Title Page Abstract Introduction Conclusions References Tables Figures J I J I Back CloseFull Screen / Esc
Printer-friendly Version Interactive Discussion Discussion P a per | Dis cussion P a per | Discussion P a per | Discussio n P a per | 3 Results
3.1 Soil responses to N additions
In the first spring after the beginning of the experiment (2007), concentrations of N, P, K and Mg in the soil were similar irrespective of the treatment (Table 1); the soil was very poor in N and P. Soil analyses in the first and second springs after the beginning of the N 5
additions showed that total N concentrations were not related to the applied N doses (0, 40 or 80 kg N ha−1yr−1) since they were similar for all treatments. In contrast, soil P and Mg decreased significantly by the second spring irrespective of the treatment. Although not significantly different, the decrease in K concentrations was most pronounced in 40A plots. The K and Mg concentrations were still within the range normally found in 10
agricultural soils, therefore not expected to be limiting. Soil organic matter in springs 2007 and 2008 were similar, while soil pH (in water) decreased in the second spring.
Soil total N, inorganic N, NO−3 and NH+4 concentrations in spring 2007 and 2008 were not related to the treatments. On the first sampling occasion (May 2007), the N-plots had only received 1/3 of the annual dose: 40A and 40AN ≈ 13 kg N ha−1 and 15
80AN ≈ 27 kg N ha−1, but by spring 2008, the fertilized plots had received 4/3 of the annual dose: 40A and 40AN ≈ 53 kg N ha−1and 80AN ≈ 107 kg N ha−1.
However, when the concentrations of soil inorganic N and NO−3 were determined on several occasions between the two springs, it could be seen that in autumn (late Octo-ber 2007) they reflected the N added to the system (Fig. 1). NO−3 was the predominant 20
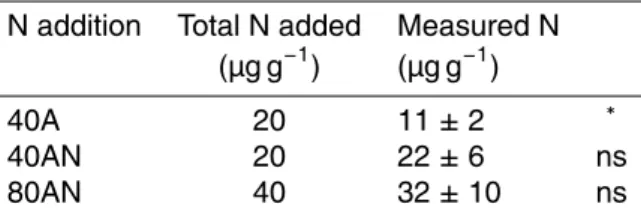
form of inorganic N in the soil, except in summer (August 2007 – Fig. 1). The temporal pattern of soil total inorganic N (Fig. 1b) therefore resembled that of NO−3 (Fig. 1c), reflecting the N additions in autumn when the three annual N additions had already been applied. In autumn, soils from fertilized plots had more inorganic N than the con-trols (40A < 40AN < 80AN plots), corresponding to 11, 22 and 32 µg of N g−1 of soil 25
dwt more than the control (see materials and methods). After transforming the applied N doses (40 and 80 kg N ha−1yr−1) into soil inorganic N concentrations (see materials and methods – µg N g−1 soil dwt), the comparison between the “total N added” and
BGD
8, 1–25, 2011 N retention in a Mediterranean maquis T. Dias et al. Title Page Abstract Introduction Conclusions References Tables Figures J I J I Back CloseFull Screen / Esc
Printer-friendly Version Interactive Discussion Discussion P a per | Dis cussion P a per | Discussion P a per | Discussio n P a per |
the “measured N” showed significant differences for the 40A plots but not the 40AN and 80AN plots. Therefore, the N added to 40AN and 80AN plots appears to have been retained by the system, becoming detectable in soil total inorganic N measured in autumn. In 40A plots the total soil inorganic N measured in autumn was significantly lower than the total N added (Table 2).
5
3.2 Cistus ladanifer responses to N additions
At the beginning of the experiment (Spring 2007), C. ladanifer plant cover was similar in all treatments (Fig. 2a). However, differences between treatments were observed one year later, in Spring 2008 (Fig. 2a, b). The 80AN treatment caused a decreased of the C. ladanifer (Dias et al., 2011) plant cover in relation to the control (Fig. 2b). 10
The N concentration of C. ladanifer leaves was also affected by the N form, since only the additions of ammonium nitrate (40AN and 80AN) led to a significant increase in relation to the control (Fig. 3b). In contrast, the N concentration of C. ladanifer leaf litter responded to the N dose, with only the litter from the 80AN plots having significantly higher N concentrations than the control. The C/N ratio C. ladanifer leaves 15
also depended significantly on the N form applied (Fig. 3c).
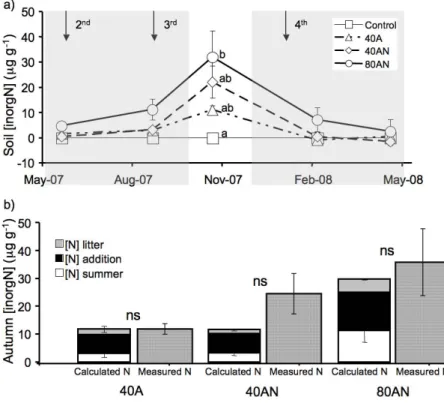
3.3 Components of soil inorganic N concentration in autumn
To understand why soil inorganic N concentration was highest in autumn, the possible components of this N pool were assessed: inorganic N present in the soil in the previ-ous season ([N] summer), the subsequent N addition ([N] addition) and the N present 20
in the litter which was shed during the summer ([N] litter – see materials and meth-ods). The N contained in C. ladanifer leaf litter produced in 40A had 2.9 mg more N per gram of litter than the control (data not shown), which corresponded to an addition of 3.5 µg N g−1 soil (Fig. 4). Similarly, litter produced in 40AN and 80AN corresponded to the addition of 3.1 and 6.4 µg N g−1soil. When the three possible components of the 25
autumn soil inorganic N concentration were combined as “calculated N”, there were no significant differences between this and the “measured N”.
BGD
8, 1–25, 2011 N retention in a Mediterranean maquis T. Dias et al. Title Page Abstract Introduction Conclusions References Tables Figures J I J I Back CloseFull Screen / Esc
Printer-friendly Version Interactive Discussion Discussion P a per | Dis cussion P a per | Discussion P a per | Discussio n P a per | 4 Discussion
4.1 Short-term response of a Mediterranean soil to N enrichment
Soil fertility of the Mediterranean Basin is considered to be moderate to high within the Mediterranean-type ecosystems (Cowling et al., 1996). However, soils at the experi-mental site (Table 1) had lower N concentration than those reported in other studies in 5
the Mediterranean Basin (e.g. Gallardo et al., 2000; Ferran et al., 2005; Sardans et al., 2008; Rutigliano et al., 2009). The level of extractable P was low in comparison with other Mediterranean Basin soils (Dumontet et al., 1996; Carreira et al., 1997; Ferran et al., 2005; Saura-Mas et al., 2009) but comparable with those from Australian and South African Mediterranean-type ecosystems (Milewski, 1983; Mitchell et al., 1984; Hobbs, 10
1995). Soil organic matter values were within the range observed in other Mediter-ranean Basin soils (Pe ˜nuelas et al., 1999; Gallardo et al., 2000; Cruz et al., 2008) but so low that these soils are at risk of desertification due to soil erosion (L ´opez-Berm ´udez and Garc´ıa-G´omez, 2006). Soil acidification (Table 1) is among the most commonly reported effects of N enrichment and may result from cation loss, aluminum 15
release and nitrification. Although soils at the experimental site were slightly acidic, ni-trification occurred since NO−3 was the predominant N source present in the soil, even in the treatments where N was added as NH+4 (Fig. 1). However, soil acidification tends to be less intense in soils of the Mediterranean Basin than of other ecosystems due to the high cation exchange capacity of these soils and of the alkaline sands transported 20
from North Africa by winds (Ochoa-Hueso et al., 2011).
Many studies of soil inorganic N availability sampled soils in spring, when water and temperature do not limit biological activities (Fig. 1a), and therefore conditions are optimal for plant growth, and concluded that the values obtained could be used as indicators of the N availability in the system. However, comparison of soil inorganic 25
N concentrations determined in the two consecutive springs (2007 and 2008) showed no differences between treatments or between years (Fig. 1b). This may imply that the N added to the system was either lost (NO−3 leaching, runoff, NH+4 volatilization,
BGD
8, 1–25, 2011 N retention in a Mediterranean maquis T. Dias et al. Title Page Abstract Introduction Conclusions References Tables Figures J I J I Back CloseFull Screen / Esc
Printer-friendly Version Interactive Discussion Discussion P a per | Dis cussion P a per | Discussion P a per | Discussio n P a per |
denitrification) or incorporated in the biota (microbial community and vegetation). If most of the added N had been lost from the system, the peak of soil inorganic N ob-served in autumn (Fig. 1b) should only reflect (if at all) the previous N addition (summer 2007). However, the observed increase in soil inorganic N in autumn was related not only with the previous N addition, but also with the “total N added” at that sampling time 5
(Table 2). The mild temperatures and the adequate water availability (Fig. 1a) may have stimulated the decomposition of the large litter input derived from the leaf shedding of summer semi deciduous plants (Correia, 1988) and the death of annual plants in the summer. In fact, N mineralization has been shown to peak in early autumn in Mediter-ranean maquis soils (Rutigliano et al., 2009; Sim ˜oes et al., 2009). Thus, the reduced 10
biological activity in the summer that allowed inorganic N to accumulate, combined with the summer N fertilization and the high autumn N mineralization (Rutigliano et al., 2009), all appear to contribute to the peak of soil inorganic N in autumn (Fig. 4). The inorganic N concentrations detected in the soil in autumn suggest that the ecosystem was more efficient in retaining N-NH4NO3than solely N-NH+4. This shows that although 15
undetectable as soil inorganic N along the year, most of the added N was used and conserved in the system as would be expected in a nutrient limited ecosystem (Craine, 2009). These results clearly show that early autumn is the best time of the year to measure soil inorganic N as an indicator of the N fluxes between the biotic and abiotic compartments. The N incorporation into the biotic compartments is in agreement with 20
the fast responses of the ecosystem structure and function to increased N availability (Dias et al., 2011). If a large fraction of the N added to the system is moving through the biotic and abiotic compartments of the ecosystem, then large impacts on ecosystem processes can be expected (e.g. Emmett, 2007; Bobbink et al., 2010).
4.2 Short-term response of the plant community to N additions
25
The cover of C. ladanifer (a slow growing conservative species) (Dias et al., 2011) increased under all treatments except 80AN (Fig. 2). In nutrient limited ecosystems, N additions tend to induce changes in the plant community promoting a decrease in
BGD
8, 1–25, 2011 N retention in a Mediterranean maquis T. Dias et al. Title Page Abstract Introduction Conclusions References Tables Figures J I J I Back CloseFull Screen / Esc
Printer-friendly Version Interactive Discussion Discussion P a per | Dis cussion P a per | Discussion P a per | Discussio n P a per |
the plant cover of the slow growing species and an increase in that of the fast growing species.
Under conditions of nutrient limitation, the efficiency of a plant using limiting nutri-ents depends not only on the uptake efficiency but also on the retention time (Emmett, 2007). Accordingly, the N-driven response of the N concentration in C. ladanifer ’s 5
leaves points to this species’ efficient N uptake (Fig. 3b) and was in agreement with the use of plant tissue N concentration as an N accumulation indicator (Sutton et al., 2005). However, if plants were only N limited, the extra N would have been used to produce biomass so that the N content would have increased but not the N concentration. Thus, increased leaf N concentration together with decreased soil P concentration (Table 1) 10
may be a symptom of N and P co-limitation (Bishop et al., 2010). On the other hand, plants characteristic of nutrient-poor ecosystems have efficient ways of reabsorbing nutrients from old leaves (Craine, 2009), depriving the litter of N and consequently giving rise to high C/N ratios in the litter (litter from control plots – Fig. 3c). As the N limitation was alleviated by the N additions, the N resorption efficiency from the old 15
leaves may have decreased (Kobe et al., 2005), resulting in increased N concentration in the litter (Fig. 3b), i.e. improved litter quality (Witkowski, 1989; O’Connel and Grove, 1993; Vourlitis et al., 2009). The overall N-driven response of leaf and litter N concen-trations and the C/N ratio was similar to that observed in two other Mediterranean-type ecosystems with different plant communities: one dominated by summer semi decidu-20
ous (coastal sage scrub), the other by evergreen sclerophylls (chaparral – Vourlitis et al., 2007; Vourlitis and Pasquini, 2009). Therefore, litter N concentration should be a good indicator of the N availability in Mediterranean-type ecosystems.
4.3 N cycling through biotic and abiotic compartments
Combined analysis of the soil inorganic N concentrations (Fig. 1) and the changes in 25
the N concentration (and C/N ratio) of C. ladanifer leaves and litter (Fig. 3) suggest that under these Mediterranean conditions, the N cycling through biotic and abiotic compartments allowed soil inorganic N to reflect cumulative N additions in autumn
BGD
8, 1–25, 2011 N retention in a Mediterranean maquis T. Dias et al. Title Page Abstract Introduction Conclusions References Tables Figures J I J I Back CloseFull Screen / Esc
Printer-friendly Version Interactive Discussion Discussion P a per | Dis cussion P a per | Discussion P a per | Discussio n P a per |
(Fig. 1b). This suggests that the N added to the system is rapidly taken up by the biota so that only after leaf shedding in summer and litter decomposition in autumn can the added N be detected in the soil. The fact that there were no differences between the soil inorganic N in 40AN and 80AN plots and the respectivee total N added (Table 2) can only be explained by efficient internal cycling of the previously added N within the 5
ecosystem. If the soil sampling had occurred in late autumn it is likely that the peak in soil inorganic N availability would be missed, since N concentration in C. ladanifer litter increases through the autumn and winter (Sim ˜oes et al., 2009). The retention of N by litter has also been shown in other Mediterranean communities (e.g. Fioretto et al., 2005; Holub and Lajtha, 2004), and could contribute to explain the sharp decline in 10
soil inorganic N availability in winter (Fig. 1b).
An inverse relationship between litter C/N ratio and decomposition rate (Bosatta and Staaf, 1982; Taylor et al., 1989) has also been established for Mediterranean plant species (Rutigliano et al., 2009), so that the N-driven lower litter C/N ratio (Fig. 3c) may have stimulated decomposition. Also, the decomposition of higher quality litter 15
has been shown to result in a rapid (∼2 months) increase of inorganic N (Sirulnik et al., 2007). Litter decomposition, together with the soil inorganic N concentration in the summer and the following N addition contributed to the observed autumn inorganic N (Fig. 4), explaining the inorganic N concentrations measured in autumn. Litter decom-position may be an important component of the soil inorganic N measured in autumn. 20
Data suggest that living plants and litter have a crucial role in preventing N losses from Mediterranean maquis.
5 Conclusions
The results of this study suggest that most of the added inorganic N was retained in this N-limited Mediterranean maquis, affecting its structure and function. Also, the form of 25
the added N influenced the overall N retention during the study period: NH+4 additions resulted in lower N recovery from the soil than the additions of NH4NO3. The added
BGD
8, 1–25, 2011 N retention in a Mediterranean maquis T. Dias et al. Title Page Abstract Introduction Conclusions References Tables Figures J I J I Back CloseFull Screen / Esc
Printer-friendly Version Interactive Discussion Discussion P a per | Dis cussion P a per | Discussion P a per | Discussio n P a per |
N was retained in the biotic compartment during the growth season, then returned to the soil after the dry period through litter decomposition (autumn). The data highlight the sensitivity to N of Mediterranean Basin ecosystems, which constitute an important worldwide biodiversity hotspot. Thus, the present N-manipulation study points to the role of N availability as a driving force for biodiversity changes, especially in Natura 5
2000 sites such as the study site. However, caution should be used when extrapolating data to other Mediterranean-type ecosystems, which may differ in soil fertility, and even to other Mediterranean habitats that differ in plant community. Finally, this is the first integrated field study of how European Mediterranean ecosystems retain N enrichment of different forms and doses, however longer-term studies are needed to explore the 10
generality of this study’s observations.
Acknowledgements. This study was supported by the Fundac¸ ˜ao para a Ci ˆencia e Tecnologia
(FCT) through the project PTDC/BIA-BEC/099323/2008 and Ph.D. grant BD/25382/2005 to Teresa Dias. We are grateful to Arr ´abida Natural Park for making the experimental site available and allowing the N manipulation experiment to which this paper refers. Finally we are grateful
15
to Steve Houghton for helping with the manuscript’s preparation.
References
Augustine, D. J. and McNaughton, S. J.: Temporal asynchrony in soil nutrient dynamics and plant production in a semiarid ecosystem, Ecosystems, 7, 829–840, 2004.
Bishop, J. G., O’Hara, N. B., Titus, J. H., Apple, J. L., Gill, R. A., and Wynn, L.: N-P co-limitation
20
of primary production and response of arthropods to N and P in early primary succession on Mount St. Helens volcano, PosOne, 510, 1–9, 2010.
Bobbink, R., Hornung, M., and Roelofs, J. G. M.: The effects of air-borne nitrogen pollutants on species diversity in natural and semi-natural European vegetation, J. Ecol., 86, 717–738, 1998.
25
Bobbink, R., Hicks, K., Galloway, J., Spranger, T., Alkemade, R., Ashmore, M., Bustamante, M., Cinderby, S., Davidson, E., Dentener, F., Emmett, B., Erisman, J.-W., Fenn, M., Gilliam, F., Nordin, A., Pardo, L., and De Vries, W.: Global assessment of nitrogen deposition effects on terrestrial plant diversity: a synthesis, Ecol. Appl., 20, 30–59, 2010.
BGD
8, 1–25, 2011 N retention in a Mediterranean maquis T. Dias et al. Title Page Abstract Introduction Conclusions References Tables Figures J I J I Back CloseFull Screen / Esc
Printer-friendly Version Interactive Discussion Discussion P a per | Dis cussion P a per | Discussion P a per | Discussio n P a per |
Bosatta, E. and Staaf, H.: The control of nitrogen turnover in forest litter, Oikos, 39, 143–151, 1982.
Carreira, J. A., Lajtha, K., and Niell, F. X.: Phosphorus transformations along a soil/vegetation series of fire-prone, dolomitic, semi-arid shrublands of southern Spain, Biogeochemistry, 39, 87–120, 1997.
5
Cassman, K. G., Dobermann, A., Walters, D. T., and Yang, H.: Meeting cereal demand while protecting natural resources and improving environmental quality, Annu. Rev. Env. Resour., 28(1), 315–358, 2003.
Correia, O. A.: Contribuic¸ ˜ao da fenologia e ecofisiologia em estudos da sucess ˜ao e din ˆamica da vegetac¸ ˜ao mediterr ˆanica, Ph.D. thesis, Dep. de Biol. Veget., Universidade de Lisboa,
10
Lisboa, Portugal, 1988.
Correia, O. A. and Catarino, F. M.: Seasonal changes in soil-to-leaf resistance in Cistus sp. and
Pistacea lentiscus, Acta Oecol., 15, 289–300, 1994.
Cowling, R. M., Rundel, P. W., Lamont, B. B., Arroyo, M. K., and Arianoutsou, M.: Plant diversity in Mediterranean-climate regions, Tree, 11, 362–366, 1996.
15
Craine, J. M.: Resource strategies of wild plants, Princeton University Press, Princeton and Oxford, 2009.
Cruz, C. and Martins-Louc¸ ˜ao, M. A.: Nitrogen in a sustainable environment: a matter of inte-gration, in: Nitrogen in a sustainable ecosystem, edited by: Martins-Louc¸ ˜ao, M. A. and Lips, S. H., Backhuys, The Netherlands, 415–419, 2000.
20
Cruz, C., Bio, A. M. F., Jullioti, A., Dias, T., and Martins-Louc¸ ˜ao, M. A.: Heterogeneity of soil sur-face ammonium concentration and other characteristics, related to plant specific variability in a Mediterranean-type ecosystem, Environ. Pollut., 154, 414–423, 2008.
de Schrijver, A., Verheyen, K., Mertens, J., Staelens, J., Wuyts, K., and Muys, B.: Nitrogen saturation and net ecosystem production, Nature, 451, E1, doi:10.1038/nature06578, 2008.
25
Dias, T., Malveiro, S., Martins-Louc¸ ˜ao, M. A., Sheppard, L. J., and Cruz, C.: Linking N-driven biodiversity changes with soil N availability in a Mediterranean ecosystem, Plant Soil, 34, 125–136, doi:10.1007/s11104-010-0628-3, 2011.
Dumontet, S., Dinel, H., Scopa, A., Mazzatura, A., and Saracino, A.: Post-fire soil microbial biomass and nutrient content of a pine forest soil from a dunal Mediterranean environment,
30
Soil Biol. Biochem., 28, 1467–1475, 1996.
Emmett, B. A.: Nitrogen saturation of terrestrial ecosystems: some recent findings and their implications for our conceptual framework, Water Air Soil Poll., 7, 99–109, 2007.
BGD
8, 1–25, 2011 N retention in a Mediterranean maquis T. Dias et al. Title Page Abstract Introduction Conclusions References Tables Figures J I J I Back CloseFull Screen / Esc
Printer-friendly Version Interactive Discussion Discussion P a per | Dis cussion P a per | Discussion P a per | Discussio n P a per |
Fenn, M. E., Baron, J. S., Allen, E. B., Rueth, H. M., Nydick, K. R., Geiser, L., Bowman, W. D., Sickman, J. O., Meixner, T., Johnson, D. W., and Neitlich, O.: Ecological effects of nitrogen deposition in the western United States, Biosciences, 53, 404–420, 2003.
Ferran, A., Delitti, W., and Vallejo, V. R.: Effects of fire recurrence in Quercus coccifera L. shrublands of the Valencia Region (Spain): II. Plant and soil nutrients, Plant Ecol., 177,
5
71–83, 2005.
Fioretto, A., Di Nardo, C., Papa, S., and Fuggi, A.: Lignin and cellulose degradation and nitro-gen dynamics during decomposition of three leaf litter species in a Mediterranean ecosys-tem, Siol Biol. Biochem., 37, 1083–1091, 2005.
Gallardo, A., Rodr´ıguez-Saucedo, J. J., Covelo, F., and Fern´andez-Al´es, R.: Soil nitrogen
het-10
erogeneity in a Dehesa ecosystem, Plant Soil, 222, 71–82, 2000.
Galloway, J. N., Townsend, A. R., Erisman, J. W., Bekunda, M., Cai, Z., Freney, J. R., Martinelli, L. A., Seitzinger, S. P., and Sutton, M. A.: Transformations of the nitrogen cycle: recent trends, questions, and potential solutions, Science, 320, 889–892, 2008.
Hobbs, R. J., Richardson, D. M., and Davis, G. W.: Mediterranean-type ecosystems:
opportu-15
nities and constraints for studying the function of biodiversity, in: Mediterranean-type ecosys-tems: the function of biodiversity, edited by: Davis, G. W. and Richardson, D. M., Springer, Heidleberg, 1–42, 1995.
Holub, S. M. and Lajtha, K.: The fate and retention of organic and inorganic15N nitrogen in an old-growth forest soil in western Oregon, Ecosystems, 7, 368–380, 2004.
20
Jackson, L. E., Strauss, R. B., Firestone, M. K., and Bartolome, J. W.: Plant and soil nitrogen dynamics in California annual grassland, Plant Soil, 110, 9–17, 1988.
Kobe, R. K., Lepczyk, C. A., and Iyer, M.: Resorption efficiency decreases with increasing green leaf nutrients in a global data set, Ecology, 86, 2780–2792, 2005.
L ´opez-Berm ´udez, F. and Garc´ıa-G´omez, J.: Desertification in the arid and semiarid
Mediter-25
ranean regions. A food security issue, in: Desertification in the Mediterranean region. A security issue, edited by: Kepner, W. G., Rubio, J. L., Mouat, D. A., and Pedrazzini, D. A., Springer, The Netherlands, 401–428, 2006.
Matsumura, S. and Witjaksono, G.: Modification of the Cataldo method for the determination of nitrate in soil extracts by potassium chloride, Soil Sci. Plant Nutr., 45, 231–235, 1999.
30
Meixner, T. and Fenn, M. E.: Biogeochemical budgets in a Mediterranean catchment with high rates of atmospheric N deposition – importance of scale and temporal asynchrony, Biogeo-chemistry, 70, 331–356, 2004.
BGD
8, 1–25, 2011 N retention in a Mediterranean maquis T. Dias et al. Title Page Abstract Introduction Conclusions References Tables Figures J I J I Back CloseFull Screen / Esc
Printer-friendly Version Interactive Discussion Discussion P a per | Dis cussion P a per | Discussion P a per | Discussio n P a per |
Milewski, A. V.: A comparison of ecosystems in Mediterranean Australia and Southern Africa: nutrient-poor sites at the barrens and the Caledon coast, Annu. Rev. Ecol. Syst., 14, 57–76, 1983.
Mitchell, D. T., Brown, G., and Jongens-Roberts, S. M.: Variation of forms of phosphorus in the sandy soils of coastal fynbos, south-western Cape, J. Ecol., 72, 575–584, 1984.
5
Pe ˜nuelas, J., Filella, I., and Terradas, J.: Variability of plant nitrogen and water use in a 100-m transect of a subdesertic depression of the Ebro valley (Spain) characterized by leaf δ13C and δ15N, Acta Oecol., 20, 119–123, 1999.
Ochoa-Hueso R., Allen, E. B., Branquinho, C., Cruz, C., Dias, T., Fenn, M. E., Manrique, E., Perez-Corona, M. E., Sheppard, L. J., and Stock, W. D.: Nitrogen effects on
Mediterranean-10
type ecosystems: an ecological assessment, Environ. Pollut., in press, 2011.
Phoenix, G. K., Hicks, W. K., Cinderby, S., Kuylenstierna, J. C. I., Stock, W. D., Dentener, F. J., Giller, K. E., Austin, A. T., Lefroy, R. D. B., Gimeno, B. S., Ashmore, M. R., and Ineson, P.: Atmospheric nitrogen deposition in world biodiversity hotspots: the need for a greater global perspective in assessing N deposition impacts, Glob. Change Biol., 12, 470–476, 2006.
15
Rivas-Mart´ınez, S., Penas, A., and D´ıaz, T. E.: Bioclimatic map of Europe-Thermoclimatic belts, University of Le ´on, Spain, http://www.globalbioclimatics.org/form/maps.htm, access: January 2010, 2004.
Rutigliano, F. A., Castaldi, S., D’Ascoli, R., Papa, S., Carfora, A., Marzaioli, R., and Fioretto, A.: Soil activities related to nitrogen cycle under three plant cover types in Mediterranean
20
environment, Appl. Soil Ecol., 43, 40–46, 2009.
Sardans, J., Pe ˜nuelas, J., Estiarte, M., and Prieto, P.: Warming and drought alter C and N con-centration, allocation and accumulation in a Mediterranean shrubland, Glob. Change Biol., 14, 2304–2316, 2008.
Saura-Mas, S. and Lloret, F.: Linking post-fire regenerative strategy and leaf nutrient content in
25
Mediterranean woody plants, Perspect. Plant Ecol., 11, 219–229, 2009.
Schultz, J.: The ecozones of the world: the ecological divisions of the geosphere, Springer, The Netherlands, 2002.
Sim ˜oes, M. P., Madeira, M., and Gazarini, L.: Ability of Cistus L. shrubs to promote soil re-habilitation in extensive oak woodlands of Mediterranean areas, Plant Soil, 323, 249–265,
30
2009.
Sirulnik, A. G., Allen, E. B., Meixner, T., and Allen, M. F.: Impacts of anthropogenic N additions on nitrogen mineralization from plant litter in exotic annual grasslands, Soil Biol. Biochem.,
BGD
8, 1–25, 2011 N retention in a Mediterranean maquis T. Dias et al. Title Page Abstract Introduction Conclusions References Tables Figures J I J I Back CloseFull Screen / Esc
Printer-friendly Version Interactive Discussion Discussion P a per | Dis cussion P a per | Discussion P a per | Discussio n P a per | 39, 24–32, 2007.
Sutton, M. A., Pitcairn, C. E. R., Leith, I. D., Sheppard, L. J., van Dijk, N., Tang, Y. S., Skiba, U., Smart, S., Mitchell, R., Wolseley, P., James, P., Purvis, W., and Fowler, D.: Bioindicator and biomonitoring methods for assessing the effects of atmospheric nitrogen on statutory nature conservation sites, JNCC Report No: 356, edited by: Sutton, M. A., Pitcairn, C. E. R., and
5
Whitfield, C. P., 2004.
Taylor, B. R., Parkinson, D., and Parsons, W. F. J.: Nitrogen and lignin content as predictors of litter decay rates: a microcosm test, Ecology, 70, 97–104, 1989.
Vourlitis, G. L. and Pasquini, S.: Experimental dry-season N deposition alters species com-position in southern Californian Mediterranean-type shrublands, Ecology, 90, 2183–2189,
10
2009.
Vourlitis, G. L., Pasquini, S., and Zorba, G.: Plant and soil N response of southern Californian semi-arid shrublands after 1 year of experimental N deposition, Ecosystems, 10, 263–279, 2007.
Vourlitis, G. L., Pasquini, S., and Mustard, R.: Effects of dry-season N input on the productivity
15
an N storage of Mediterranean-type shrublands, Ecosystems, 12, 473–488, 2009.
Witkowski, E. T. F.: Effects of nutrient additions on litter production and nutrient return in a nutrient-poor Cape fynbos ecosystem, Plant Soil, 117, 227–235, 1989.
BGD
8, 1–25, 2011 N retention in a Mediterranean maquis T. Dias et al. Title Page Abstract Introduction Conclusions References Tables Figures J I J I Back CloseFull Screen / Esc
Printer-friendly Version Interactive Discussion Discussion P a per | Dis cussion P a per | Discussion P a per | Discussio n P a per |
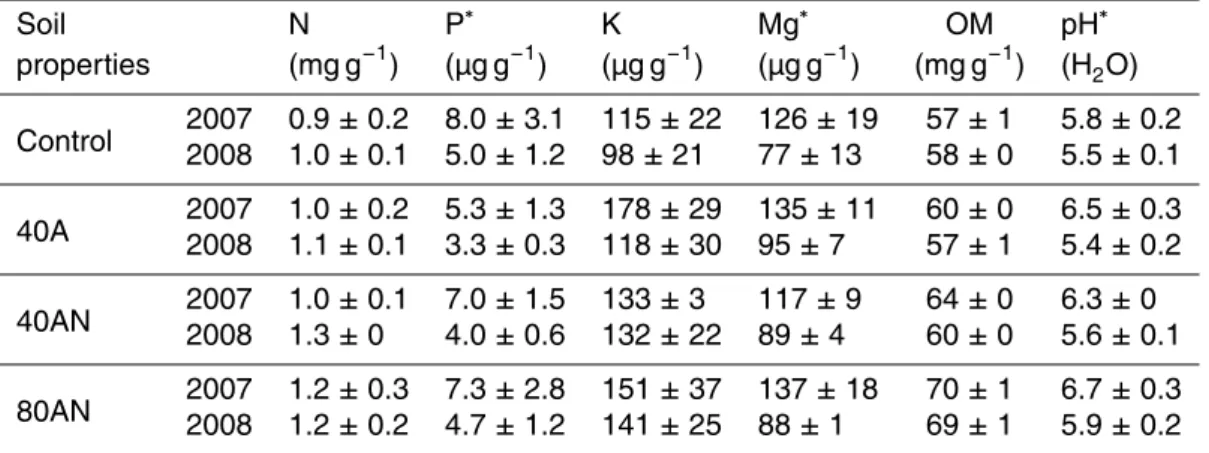
Table 1. Soil surface (0–15 cm) properties (N, phosphorus – P, potassium – K, magnesium –
Mg – and organic matter concentrations – OM – and pH) at the first (May 2007) and second (April 2008) springs after the beginning of the experiment according to the distinct N additions (Control, 40A, 40AN and 80AN).
Soil N P∗ K Mg∗ OM pH∗ properties (mg g−1) (µg g−1) (µg g−1) (µg g−1) (mg g−1) (H2O) Control 20072008 0.9 ± 0.21.0 ± 0.1 8.0 ± 3.15.0 ± 1.2 115 ± 2298 ± 21 126 ± 1977 ± 13 57 ± 158 ± 0 5.8 ± 0.25.5 ± 0.1 40A 20072008 1.0 ± 0.21.1 ± 0.1 5.3 ± 1.33.3 ± 0.3 178 ± 29118 ± 30 135 ± 1195 ± 7 60 ± 057 ± 1 6.5 ± 0.35.4 ± 0.2 40AN 20072008 1.0 ± 0.11.3 ± 0 7.0 ± 1.54.0 ± 0.6 133 ± 3132 ± 22 117 ± 989 ± 4 64 ± 060 ± 0 6.3 ± 05.6 ± 0.1 80AN 20072008 1.2 ± 0.31.2 ± 0.2 7.3 ± 2.84.7 ± 1.2 151 ± 37141 ± 25 137 ± 1888 ± 1 70 ± 169 ± 1 6.7 ± 0.35.9 ± 0.2 ∗
refers to statistically significant differences between the two years; there were no significant interactions between treatment and time (p < 001). Values represent the mean (n= 3 experimental plots per treatment) ± SE.
BGD
8, 1–25, 2011 N retention in a Mediterranean maquis T. Dias et al. Title Page Abstract Introduction Conclusions References Tables Figures J I J I Back CloseFull Screen / Esc
Printer-friendly Version Interactive Discussion Discussion P a per | Dis cussion P a per | Discussion P a per | Discussio n P a per |
Table 2. Total N added to the soil and the soil inorganic N concentrations in relation to the
control determined in autumn (measured N) according to the N additions (40A, 40AN and 80AN).
N addition Total N added Measured N (µg g−1) (µg g−1)
40A 20 11 ± 2 ∗ 40AN 20 22 ± 6 ns 80AN 40 32 ± 10 ns
∗refers to significant differences between total N added and measured N (t-student p < 0.01). Values represent the
BGD
8, 1–25, 2011 N retention in a Mediterranean maquis T. Dias et al. Title Page Abstract Introduction Conclusions References Tables Figures J I J I Back CloseFull Screen / Esc
Printer-friendly Version Interactive Discussion Discussion P a per | Dis cussion P a per | Discussion P a per | Discussio n P a per |
Fig. 1.Mean monthly temperature (grey), total monthly precipitation (black) and time of N additions (arrows) and soil sampling (asterisks) from May 2007 to May 2008(a). Soil inorganic N (b), nitrate (c) and ammonium (d) concentrations
according to the distinct N additions (Control, 40A, 40AN, and 80AN). Different letters refer to statistically significant differences between the between treatments (ANOVA p < 0.05 followed by a Bonferroni test). There were no significant interactions between treatment and time (p < 001). Values represent the mean (n= 3 experimental plots per treatment) ± SE.
BGD
8, 1–25, 2011 N retention in a Mediterranean maquis T. Dias et al. Title Page Abstract Introduction Conclusions References Tables Figures J I J I Back CloseFull Screen / Esc
Printer-friendly Version Interactive Discussion Discussion P a per | Dis cussion P a per | Discussion P a per | Discussio n P a per |
Fig. 2. C. ladanifer plant cover (a) and its response to the distinct N additions (Control, 40A,
40AN, and 80AN). Plant cover (%) was assessed on the first and second springs after the beginning of the N fertilizations. Different letters refers to statistically significant differences between the two springs (ANOVA p < 0.1 followed by a Bonferroni test). There were no sig-nificant interactions between treatment and time (p < 0.01). Values represent the mean (n= 3 experimental plots per treatment) ± SE.
BGD
8, 1–25, 2011 N retention in a Mediterranean maquis T. Dias et al. Title Page Abstract Introduction Conclusions References Tables Figures J I J I Back CloseFull Screen / Esc
Printer-friendly Version Interactive Discussion Discussion P a per | Dis cussion P a per | Discussion P a per | Discussio n P a per |
Fig. 3. C and N concentrations and the C/N ratio of leaves and leaf litter of C. ladanifer in
response to the distinct N additions (Control, 40A, 40AN and 80AN). Different letters refers to statistically significant differences between treatments (ANOVA p < 0.05 followed by a Bonfer-roni test). Values represent the mean (n= 3 experimental plots per treatment) ± SE.
BGD
8, 1–25, 2011 N retention in a Mediterranean maquis T. Dias et al. Title Page Abstract Introduction Conclusions References Tables Figures J I J I Back CloseFull Screen / Esc
Printer-friendly Version Interactive Discussion Discussion P a per | Dis cussion P a per | Discussion P a per | Discussio n P a per |
Fig. 4. Soil inorganic N concentration in relation to the control along the experimental period
in response to distinct N additions(a) and comparison between the “calculated N” (stacked
columns – see material and methods) and the “measured N” (dashed columns) concentrations of soil inorganic N in autumn and according to the N additions (40A, 40AN and 80AN –b). There
were no significant differences between “calculated N” and “measured N” (t-student p < 0.001). Values represent the mean (n= 3 experimental plots per treatment) ± SE.