This is an open-access article
SUFFICIENT NUMBER OF REPLICATES FOR
ESTIMATION OF DISSIMILARITY MEASURES
AMONG MAIZE CULTIVARS
Abstract – The objective of this work was to determine the sufficient number of replicates for estimation of dissimilarity measures among maize cultivars. Data of five variables were used, which were evaluated in an experiment with 15 maize cultivars, in randomized block design with nine replicates. A number of 511 data files were formed, being 9, 36, 84, 126, 126, 84, 36, 9, and 1 obtained, respectively from 1, 2, 3, 4, 5, 6, 7, 8, and 9 replicates. Three dissimilarity matrices were determined between i and i’ (dii’) cultivars containing, respectively, Euclidean, Manhattan, and Chebyshev distances. For each of the 105 distances between cultivars, in each dissimilarity measure, the power function was adjusted for the coefficient of variation of the dii’ (dependent variable) as
a function of the number of replicates (independent variable), totaling 315 equations. For each equation, the abscissa axis value (Xs, sufficient number of replicates) was determined, corresponding to the maximum curvature point. With the increase of the number of replicates, there is an improvement in the accuracy of the estimates of dissimilarity measures among maize cultivars, however, the gains in precision decrease gradually.Six replicates are sufficient to estimate the dissimilarity measures among maize cultivars expressed by the Euclidean, Manhattan, and Chebyshev distances. Keywords: Zea mays L., measures of resemblance, Euclidean, Manhattan, Chebyshev.
NÚMERO SUFICIENTE DE REPETIÇÕES
PARA ESTIMAÇÃO DE MEDIDAS DE
DISSIMILARIDADE ENTRE CULTIVARES DE
MILHO
Resumo - O objetivo deste trabalho foi determinar o número suficiente de repetições para estimação de medidas de dissimilaridade entre cultivares de milho. Foram utilizados os dados de cinco variáveis avaliadas em experimento com 15 cultivares de milho em blocos ao acaso com nove repetições. Formaram-se 511 arquivos de dados, sendo 9, 36, 84, 126, 126, 84, 36, 9 e 1 provenientes, respectivamente, de 1, 2, 3, 4, 5, 6, 7, 8 e 9 repetições. Foram determinadas três matrizes de dissimilaridade entre as cultivares i e i’ (dii’) contendo, respectivamente, as distâncias Euclidiana, Manhattan e Chebyshev. Para cada uma das 105 distâncias entre cultivares, em cada medida de dissimilaridade, ajustou-se a função potência do coeficiente de variação de dii’ em função do número de repetições, totalizando 315 equações. Para cada equação foi determinado o valor no eixo das abscissas (Xs, número suficiente de repetições) correspondente ao ponto de curvatura máxima. Com o aumento do número de repetições há melhoria na precisão das estimativas das medidas de dissimilaridade entre cultivares de milho, porém os ganhos em precisão diminuem gradativamente. Seis repetições são suficientes para estimar as medidas de dissimilaridade entre as cultivares de milho expressas pelas distâncias Euclidiana, Manhattan e Chebyshev.
Palavras-chave: Zea mays L., medidas de parecença, Euclidiana, Manhattan, Chebyshev.
ISSN 1980 - 6477
Journal homepage: www.abms.org.br/site/paginas
Alberto Cargnelutti Filho1 ( ) and Marcos Toebe2
(1)Universidade Federal de Santa Maria - Departamento de Fitotecnia - Santa Maria (RS), Brasil.
E-mail: [email protected] (2)Universidade Federal de Santa Maria - Departamento de Ciências Agronômicas e Ambientais - Frederico Westphalen (RS), Brasil. Email: [email protected]
How to cite
CARGNELUTTI FILHO, A.; TOEBE, M. Sufficient number of replicates for estimation of dissimilarity measures among maize cultivars. Revista Brasileira de Milho e Sorgo, v. 19, e1181, 2020.
Brazilian Journal of Maize and Sorghum
Revista Brasileira de Milho e Sorgo, v.19, e1181, 2020 DOI: https://doi.org/10.18512/1980-6477/rbms 2020.v19.e1181
In plant breeding programs, cultivar comparison experiments are conducted with the objective of selecting the best genotypes and discarding the least promising ones. Commonly, several variables are evaluated in genotypes. These variables can be used in multivariate procedures with the purpose of quantifying the genetic dissimilarity among the cultivars.
Numerous algorithms are used in cluster analysis for the group’s formation with maximum homogeneity between the individuals (cultivars) of the group and maximum heterogeneity among the individuals (cultivars) of the groups. The results of the clustering pattern serve as a basis for directing crosses among plants with the greatest genetic divergence. For the clustering algorithms to be applied, some measure of dissimilarity among cultivars, such as distances, is required. The greater the distance, the greater the genetic divergence among the cultivars.
Among the distances, the generalized Mahalanobis distance has been suggested for the data obtained in experimental designs with replicates (Cruz et al., 2012; Cruz et al., 2014). Other distances originated from the Minkowski metric, such as Euclidean, Manhattan (city block), and Chebyshev (maximum or supreme) can be estimated from a replicate (without experimental design) or from the mean value of replicates (in an experimental design). In this sense, Grenier et al. (2013) used six dissimilarity measures, including the standard Euclidean distance, to study climate differences in Canada. The authors highlighted that the standardized Euclidean distance had adequate performance, although lower than the Zech-Aslan energy statistics. In a study to evaluate the cluster pattern consistency, Cargnelutti Filho et al. (2010a), using eight dissimilarity measures and eight clustering methods, concluded that the highest consistency in the clustering patterns of bean cultivars was verified with the average linkage between groups
method obtained from the Euclidean distance matrix. According to Cargnelutti Filho & Guadagnin (2011a), the Euclidean distance provides greater consistency in the grouping pattern in relation to the Manhattan distance.
Regardless of the algorithm used, the clustering pattern is the reflection of the distance matrix that was used among cultivars. Thus, for the grouping pattern to have reliability, it’s critical that the distances are estimated accurately. Although some distances can be estimated with one replicate (without experimental design), it’s important to investigate whether increasing the number of replicates improves the accuracy of distance estimates. Moreover, it’s important to investigate whether there is a possibility of defining the sufficient number of replicates to estimate these dissimilarity measures.
Studies on the number of replicates have been performed in maize (Cargnelutti Filho et al., 2010b; Nesi et al., 2010; Cargnelutti Filho & Guadagnin, 2011b; Mendoza & Buitrago, 2015; Cargnelutti Filho et al., 2018), showing promising gains in experimental accuracy with the increase in the number of replicates. However, an aspect that has not yet been explored is whether it’s possible to improve the precision of the dissimilarity measures, used for cluster analysis studies, with the increase of the number of replicates, even for those measures that can be obtained from a replicate. An insufficient number of replicates can generate inaccurate estimates. On the other hand, too many replicates may result in a waste of time, labor, and financial resources, since the gain in accuracy from a given number of replicates can be unimpressive. In this sense, Xu et al. (2012) assessed sampling sufficiency for analyzing taxonomic relatedness of periphytic ciliate communities in coastal waters of the Yellow Sea in northern China, using one to 20 replicates to determine dissimilarity. Already Cao et al. (1997) had used a resampling process with replacement to determine the number of replicates
in similarity measures in river benthic Aufwuchs community analysis. Recently, Greenacre (2017) published a study on the concepts of size and shape of multivariate (dis)similarity measures in ecological studies. It is assumed that it’s possible to increase the precision of estimates of dissimilarity measures among cultivars with the increase in the number of replicates. The important question to be investigated is to what extent it’s important to increase the number of replicates to increase accuracy, since as from a given number of replicates, the gain may be negligible. Thus, the objective of this work was to determine the sufficient number of replicates for estimation of dissimilarity measures among maize cultivars.
Material and Methods
An experiment was conducted with 15 maize cultivars (Zea mays L.), in the randomized block design, with nine replicates, in the 2012/2013 agricultural year. The experiment was carried out in the Department of Plant Science of the Federal University of Santa Maria, in the municipality of Santa Maria, state of Rio Grande do Sul, Brazil (latitude 29º42’S, longitude 53º49’W and altitude of 95 m). The experimental units (plots) consisted of two 5.0 m rows, spaced 0.8 m apart, for a density of 62,500 plants per hectare.
In each experimental unit, the number of days of sowing up to 50% of male flowering (MF) and the number of days of sowing up to 50% of female flowering (FF) were counted. At harvest, based on all the plants of the experimental unit, plant height (PH) and ear height (EH) were measured, and grain yield (GY) determined, corrected to 13% moisture.
For each of the five variables (MF, FF, PH, EH, and GY), the analysis of variance was performed based on the mathematical model Yij = μ + Ci + Bj + εij , where
Yij is the observed value for variable Y of the ith cultivar
(i = 1, 2, ..., n) in the jth replicate (block)(j = 1, 2, ..., r); μ
is the overall mean; Ci is the effect of the ith cultivar
(i = 1, 2,..., n), in this study considered as a fixed effect; Bj is the effect of the jth replicate (block) (j = 1, 2, ..., r); and
εij is the effect of the experimental error for Yij, assumed to be normal and independently distributed with a zero mean and common variance σ2 (Storck et al., 2016). The
overall mean, coefficient of variation (CV), and F-test values for cultivar (F) were presented. The selective accuracy was calculated using the expression SA = (1-1/F)0.5 (Resende & Duarte, 2007). The p-values of the
Kolmogorov-Smirnov test for error normality and of the Levene’s test for homogeneity of residual variances were also presented. The cultivar means were grouped by the Scott-Knott test, at 5% probability.
For the study of the sufficient number of replicates to estimate dissimilarity measures among maize cultivars, from the reference experiment, that is, with all replicates (r = 9), new experiments (data files) were formed by combinations of 1, 2, 3, ..., r-1 replicates. Therefore, an experiment (file) formed with the 9 replicates [reference; C(9.9)=1 experiment] was obtained, while the others were obtained by the combination of the 9 replicates in groups of one [C(9.1)=9], two [C(9.2)=36], three [C(9.3)=84], four [C(9.4)=126], five [C(9.5)=126], six [C(9.6)=84], seven [C(9.7)=36], and eight [C(9.8)=9] replicates, totaling 511 experiments (511 data files).
For each experiment (file), the means of MF, FF, PH, EH, and GY were calculated between the replicates of each cultivar, obtaining an original matrix (phenotype matrix) with 15 rows (cultivars) and 5 columns (variables). Then, in order to overcome the impact of the measurement scales with different quantities, the means of each column (variable) were standardized, in order to obtain a new variable with mean zero and one standard deviation, thus obtaining a matrix of standardized means.
Revista Brasileira de Milho e Sorgo, v.19, e1181, 2020 DOI: https://doi.org/10.18512/1980-6477/rbms 2020.v19.e1181
Then, in each experiment (file), Pearson’s linear correlation coefficient matrix was determined between the standard variables. In this matrix, the diagnosis of multicollinearity (Hair et al., 2009; Cruz et al., 2014) was performed by condition number (CN), determinant of the correlation matrix (DET), and variance inflation factor (VIF). According to Montgomery & Peck (1982), there is weak multicollinearity among the variables when CN ≤ 100; moderate to strong when 100 < CN < 1,000; and severe when CN ≥ 1,000. There is multicollinearity when the DET value is less than 0.00001 (Field, 2009), and, when VIF is greater than 10, it’s considered severe multicollinearity (Hair et al., 2009; Cruz et al., 2014). CN and DET are indicators with interpretation for all variables, while VIF has the advantage of reporting the inflation of variance for each variable and, therefore, in this study, the highest VIF value among the variables was considered.
In each experiment (file), the dissimilarity measures, expressed by the Euclidean (E), Manhattan (M), and Chebyshev (C) distances, were determined between the cultivars i and i’ (dii’ ) by the following expressions (Cruz et al., 2012; Cruz et al., 2014; Ferreira, 2018): Euclidean distance: d ii’= √(∑ p
k=1(Yik - Yi’k )2
;Manhattan distance: dii’ = ∑ p
k=1|Yik -Yi’k| ; and Chebyshev
distance: dii’ = max k |Yik-Yi’k |, where Yik is the standardized mean of the ith cultivar (i = 1, 2, 3, ..., n; in this study, n
= 15 cultivars) for the kth variable (k = 1, 2, ..., p; in this
study, p = 5 variables). Therefore, for each experiment (file), three matrices of distances (E, M, and C) were obtained, each one being composed of 105 distances among the n cultivars [C(15.2)=105]. These distance matrices are used as dissimilarity measures in cultivar clustering analysis. In these matrices, it’s interpreted that the greater the distance between two cultivars, the smaller is the similarity between them.
Thus, for each dissimilarity measure (E, M, and
C) and for each of the 105 distances between cultivars (315 cases), 511 distance estimates were obtained, being 9, 36, 84, 126, 126, 84, 36, 9, and 1, respectively, from the experiments (data files) with 1, 2, 3, 4, 5, 6, 7, 8, and 9 replicates. So, for example, for the Euclidean distance between cultivars 1 and 2, i.e., i = 1 and i’ = 2, 511 distance estimates were obtained, being 9, 36, 84, 126, 126, 84, 36, 9, and 1, respectively, from the experiments with 1, 2, 3, 4, 5, 6, 7, 8, and 9 replicates.
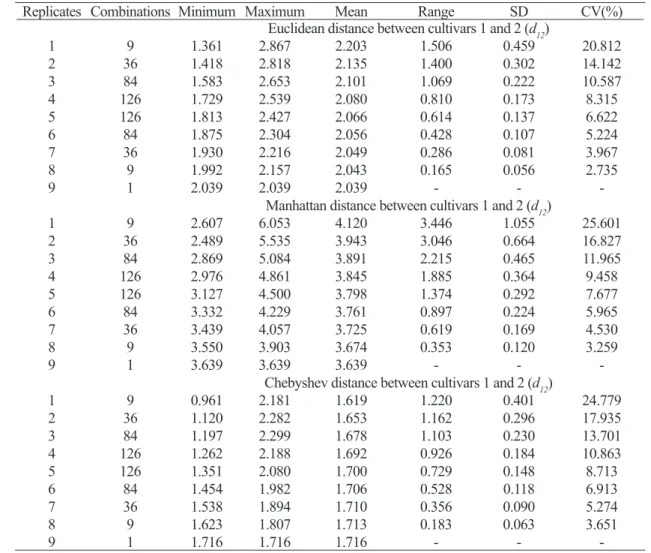
Then, for each measure of dissimilarity (E, M, and C) and for each of the 105 distances between cultivars (315 cases), the minimum, maximum, mean, amplitude (maximum-minimum), standard deviation, and coefficient of variation of the distance estimates within the 1, 2, 3, 4, 5, 6, 7, 8, and 9 replicates combinations were calculated. In order to show the pattern of distance behavior among cultivars, with variation of the number of replicates, the results of the distances between cultivars 1 and 2 (d12) were presented, due to the limited space to present the results for all distances.
For each dissimilarity measure (E, M, and C) and for each of the 105 distances between cultivars (315 cases), the parameters A and B of the power model (Y=A/XB) and the coefficient of determination
(R2) were estimated for the coefficient of variation
(dependent variable, Y), as a function of the number of replicates (independent variable, X). The estimates of A, B, and R2 were obtained by an iterative process using
the Gauss-Newton algorithm, until convergence, in order to minimize the sum of squares of the error. The values established for the convergence criterion were: a maximum number of iterations = 200 and tolerance = 0.000099.
Thus, 315 equations (three dissimilarity measures × 105 distances between cultivars) were obtained. For each equation, the value of the abscissa axis (Xs, sufficient number of replicates ) corresponding to the
maximum curvature point ( Meier and Lessman, 1971 ) was determined by the expression
Xs = [A2 B2 (2B+1)/(B+2)]1/(2B+2). The coefficients of
variation decrease gradually with the increase of the number of replicates, that is, there is an increase in the accuracy of the estimates of distances between cultivars (dii’). This decrease in the CV is accentuated to Xs, then decreases, tending to stabilize, and with this, gains in precision become inexpressive.
The mean of the 105 estimates of Xs was calculated for each dissimilarity measure (E, M, and C), thus obtaining a representative value of Xs for each dissimilarity measure. The highest value among the three means of Xs, rounded to the upper integer, was adopted as a criterion for the determination of the number of replicates to estimate dissimilarity measures among maize cultivars, in order to guarantee precision for the dii’ estimates of the three dissimilarity measures (E, M, and C). The statistical analyses were performed using the Microsoft Office Excel application, Genes program (Cruz, 2016), and R software (R Development Core Team, 2019).
Results and Discussion
For the five variables (MF, FF, PH, EH, and GY) from the experiment with the nine replicates, the Kolmogorov-Smirnov test p-value ranged from 0.310 to 0.980 and the Levene’s test p-value from 0.021 to 0.880 (Table 1). In these tests, the higher the p-value the greater the evidence of residual normality and homogeneity of residual variances, respectively. Hence, assuming the significance level of 2.1%, it can be inferred that these assumptions were met for the five variables. Therefore, the results of the variance analysis and, consequently, the Scott-Knott test have statistical validity (Storck et al., 2016).
The coefficient of variation (CV) ranged from
1.76% to 10.75% (Table 1). The CV is a statistic commonly used by researchers as an experimental accuracy measure. For agricultural trials, Pimentel-Gomes (2009) established the following classes of CV: low (CV less than 10%); medium (CV between 10 and 20%); high (CV between 20 and 30%); and very high (CV higher than 30%). Thus, it can be inferred that for MF, FF, PH, and EH, the experimental precision was high (CV less than 10%) and for GY, the experimental precision was medium (CV between 10 and 20%). The values of the F-test for cultivar (F ≥ 14.67) and selective accuracy (SA ≥ 0.97) confer very high experimental accuracy (F ≥ 5.2632; SA ≥ 0.90), according to Resende & Duarte (2007).
From the data of the experiment with the 15 cultivars evaluated in nine replicates, in this study considered as a reference, the F-test of the variance analysis revealed a significant effect (p ≤ 0.05) of cultivars for all variables. This shows that it’s possible to discriminate the cultivars because of the genetic variability present in this group of genotypes. Thus, by the Scott-Knott test, the cultivars were divided into 4, 6, 7, 7, and 5 groups, respectively, for MF, FF, PH, EH, and GY (Table 1). It’s still possible to infer that grouping analysis, through some of the possible combinations of dissimilarity measures, such as the Euclidean, Manhattan, and Chebyshev distances, with the clustering algorithms, is an adequate procedure in this database.
In the 511 matrices of Pearson’s linear correlation coefficients between the standard variables, the minimum values of condition number (CN), correlation matrix determinant (DET) and variance inflation factor (VIF) increased with the increment from 1 to 9 replicates. On the other hand, the maximum values decreased and, consequently, the amplitudes (maximum-minimum) diminished, which reveals
Revista Brasileira de Milho e Sorgo, v.19, e1181, 2020 DOI: https://doi.org/10.18512/1980-6477/rbms 2020.v19.e1181
Table 1. Summary of the variance analysis [degrees of freedom (DF) and mean square for the sources of variation: block, cultivar, and error], mean, coefficient of experimental variation (CV), F-test value for cultivar (F), selective accuracy (SA), p-value of the Kolmogorov-Smirnov test for errors normality, and p-value of the Levene’s test for residual variances homogeneity for five variables (MF, FF, PH, EH, and GY) evaluated in 15 maize cultivars. Mean of the variables in 15 maize cultivars evaluated in nine replicates.
1
Sources of Variation DF Mean Square
MF (days) FF (days) PH (cm) EH (cm) GY (t ha-1) Block 8 1.19ns 2.62* 781.52* 244.48* 13.14* Cultivar 14 16.78* 36.30* 1777.70* 1158.06* 27.36* Error 112 1.14 1.18 28.15 14.47 0.81 Mean 60.76 64.82 243.04 145.68 8.40 CV(%) 1.76 1.68 2.18 2.61 10.75 F 14.67 30.65 63.14 80.02 33.62 SA 0.97 0.98 0.99 0.99 0.99 Kolmogorov-Smirnov 0.310 0.863 0.413 0.980 0.439 Levene 0.367 0.880 0.021 0.234 0.510
Cultivar Mean of the variables (1)
Number Name MF FF PH EH GY 1 20A55HX 60.89 b 66.67 b 258.62 b 148.21 c 8.043 d 2 P30F53H 61.00 b 65.22 c 253.16 c 156.54 b 11.034 b 3 1H768 62.89 a 68.44 a 241.24 e 163.20 a 7.845 d 4 AG5011 60.56 c 65.33 c 226.56 f 143.99 d 7.698 d 5 P1630H 58.56 d 61.00 f 239.90 e 119.17 g 8.114 d 6 P2530 60.11 c 62.67 e 239.17 e 139.14 e 6.165 e 7 BG7046 61.44 b 65.00 c 253.09 c 147.82 c 9.691 c 8 LG 6304 YG 60.33 c 64.11 d 243.70 d 146.09 d 7.371 d 9 2B688HX 62.56 a 66.00 c 237.83 e 138.27 e 7.884 d 10 KSP3248 59.67 c 65.00 c 224.41 f 145.06 d 6.024 e 11 BG7049H 62.11 a 67.33 b 253.51 c 150.85 c 9.309 c 12 AG9045 58.67 d 61.89 e 250.34 c 150.21 c 11.959 a 13 KSP04 59.33 d 63.67 d 212.53 g 131.36 f 6.197 e 14 BG7051H 60.89 b 64.00 d 245.05 d 142.40 d 8.581 d 15 BG7060HR 62.44 a 66.00 c 266.43 a 162.95 a 10.015 c
MF: number of days of sowing up to 50% of male flowering; FF: number of days of sowing up to 50% of female flowering;
PH: plant height; EH: ear height; and GY: grain yield at 13% moisture. (1) Cultivars with means not followed by the same
improvement in the precision of the CN, DET, and VIF estimates with the increase in the number of replicates (Figure 1). The mean of these three multicollinearity indicators presented slight oscillations with the increase of the number of replicates, remaining in the following ranges: 26.22 ≤ CN ≤ 32.05; 0.0581 ≥ DET ≥ 0.0273; and 5.04 ≤ VIF ≤ 6.12. These bands characterize correlation matrices with a low degree of multicollinearity according to established criteria, i.e., CN ≤ 100 (Montgomery & Peck, 1982), VIF ≤ 10 (Hair et al., 2009; Gujarati and Porter, 2011), and DET > 0.00001 (Field, 2009). Therefore, they can provide grouping patterns free of the multicollinearity impact (Hair et al., 2009).
In relation to the nine Euclidean distance estimates between cultivars 1 and 2 (d12), obtained from 9 files with one replicate, the minimum value was 1.361 and the maximum was 2.867, with an amplitude of 1.506, and a mean of 2.203. Among these nine estimates, the standard deviation was 0.459 and the coefficient of variation was 20.812% (Table 2). With the increase of the number of replicates, there was an increment in the minimum values, reduction of the maximum values and mean stabilization. There was also a reduction in amplitude, standard deviation, and coefficient of variation, which indicates improvement in the accuracy of the d12 estimates with the increase of the number of replicates (Table 2 and Figure 2). Thus, with 1, 2, 3, 4, 5, 6, 7, and 8 replicates, the coefficients of variation were 20.812%, 14.142%, 10.587%, 8.315%, 6.622%, 5.224%, 3.967%, and 2.735%, respectively. This decreasing behavior of the coefficients of variation (dependent variable, Y) as a function of the number of replicates (independent variable, X) was adjusted to the power model (Y=21.6104/X0.749609, R² = 0.9662) (Figure 2).
This pattern of decrease in the variation coefficient and, consequently, the increase of the precision in the dii’ estimate with the increment in the number of replicates,
was similar for the other 104 Euclidean distances between cultivars and with a good fit to the power model (0.3488 ≤ R² ≤ 0.9879). The mean of the 105 estimates of R² was 0.9359, which reveals the suitability of this model to represent the variation of the dii’ coefficient of variation (Y) as a function of the number of replicates (X). Thus, the maximum curvature model value can be used for calculating the Xs value, which represents the sufficient number of replicates, since, up to this value, the gains in precision in the estimation of dii’ are high and after each time less expressive, with a tendency to stabilize, which may indicate that expenditure of labor, time and financial resources with more replicates in the experiment may not compensate for the accuracy of dii’.
Still, in relation to the Euclidean distance between cultivars 1 and 2 (d12), the abscissa axis value (Xs, sufficient number of replicates) corresponding to the maximum curvature point (Meier and Lessman, 1971) was estimated by the expression Xs = [21.61042×0.7496092 (2×0.749609+1)/(0.749609+2)]1/ (2×0.749609+2)=4.78 replicates (Figure 2). Among the 105
Euclidean distances, the number of replicates varied between 1.60 (distance between cultivars 5 and 10) and 10.17 (distance between cultivars 7 and 11), with a mean of 5.06 (Table 3). So, rounding this value to the upper integer, it can be inferred that six replicates are sufficient to estimate the dissimilarity measure among the cultivars expressed by the Euclidean distance. In a study developed by Xu et al. (2012), the authors found differences in the number of replicates (samples) for the dissimilarity assessment between young communities (3 to 10 replicates) and adult communities (2 to 4 replicates) of ciliate protozoa. According to the authors, a greater number of replicates is required for the characterization of dissimilarity among young communities, in which dissimilarity indices are more sensitive. Already Cao et al. (1997) had observed that most of the 11 measures of
Revista Brasileira de Milho e Sorgo, v.19, e1181, 2020 DOI: https://doi.org/10.18512/1980-6477/rbms 2020.v19.e1181
Figure 1. Condition number, determinant, and variance inflation factor of Pearson’s linear correlation coefficient matrix, among five standard variables, in the 511 data files, being 9, 36, 84, 126, 126, 84, 36, 9, and 1, respectively, from the experiments with 1, 2, 3, 4, 5, 6, 7, 8, and 9 replicates. Minimum, maximum, and mean values in each number of replicates.
1 0 1 2 3 4 5 6 7 8 9 10 Number of replicates 0 10 20 30 40 50 60 70 80 90 100 Co nd iti on n um be
r Replicates Minimum Maximum Mean 1 12.83 64.78 26.22
2 14.59 56.12 28.02 3 16.44 55.39 29.55 4 18.61 56.13 30.46 5 20.63 48.58 31.05 6 23.16 48.03 31.45 7 25.78 42.89 31.72 8 28.73 37.15 31.91 9 32.05 32.05 32.05 0 1 2 3 4 5 6 7 8 9 10 Number of replicates 0.00 0.01 0.02 0.03 0.04 0.05 0.06 0.07 0.08 0.09 0.10 Det erm in an t
Replicates Minimum Maximum Mean 1 0.0219 0.0985 0.0581 2 0.0131 0.0760 0.0419 3 0.0152 0.0607 0.0359 4 0.0144 0.0512 0.0327 5 0.0154 0.0446 0.0308 6 0.0172 0.0389 0.0295 7 0.0188 0.0351 0.0286 8 0.0213 0.0320 0.0279 9 0.0273 0.0273 0.0273 0 1 2 3 4 5 6 7 8 9 10 Number of replicates 0 1 2 3 4 5 6 7 8 9 10 11 12 Var ian ce in fla tio n f act
or Replicates Minimum Maximum Mean
1 3.11 11.52 5.04 2 3.21 11.93 5.39 3 3.49 11.07 5.64 4 3.79 10.66 5.81 5 4.02 9.02 5.92 6 4.41 8.69 5.99 7 4.87 7.61 6.05 8 5.34 6.83 6.09 9 6.12 6.12 6.12
dissimilarity studied were strongly influenced by sample size (number of replicates).
In relation to the Manhattan and Chebyshev distances between cultivars 1 and 2 (d12), it was noted a pattern similar to that already observed for Euclidean distance, that is, with the increase of the number of replicates, there was an increment in minimum values, decrease of maximum values, stabilization of the mean and reduction of amplitude, standard deviation and coefficient of variation (Table 2 and Figure 2). The reduction of the coefficient of variation (Y) as a function
of the number of replicates (X) was adjusted by power model for Manhattan distance ( Y= 26.4225/ X0.789781, R² = 0.9762) and Chebyshev distance
(Y=25.9925/X0.695035, R² = 0.9517) (Figure 2). The values
of the coefficient of determination for the 105 Manhattan distances (0.4770 ≤ R² ≤ 0.9915; mean = 0.9400) and for the 105 Chebyshev distances (0.3514 ≤ R² ≤ 0.9921; mean = 0.9155) confirm the suitability of the power model to represent the variation of the dii’ coefficient of variation as a function of the number of replicates. Table 2. Minimum, maximum, mean, range, standard deviation (SD), and coefficient of variation (CV) of Euclidean, Manhattan, and Chebyshev distances between cultivars 1 and 2 (d12) , obtained in the experiment combinations with 1, 2, 3, 4, 5, 6, 7, 8, and 9 replicates.
Replicates Combinations Minimum Maximum Mean Range SD CV(%)
Euclidean distance between cultivars 1 and 2 (d12)
1 9 1.361 2.867 2.203 1.506 0.459 20.812 2 36 1.418 2.818 2.135 1.400 0.302 14.142 3 84 1.583 2.653 2.101 1.069 0.222 10.587 4 126 1.729 2.539 2.080 0.810 0.173 8.315 5 126 1.813 2.427 2.066 0.614 0.137 6.622 6 84 1.875 2.304 2.056 0.428 0.107 5.224 7 36 1.930 2.216 2.049 0.286 0.081 3.967 8 9 1.992 2.157 2.043 0.165 0.056 2.735 9 1 2.039 2.039 2.039 - -
-Manhattan distance between cultivars 1 and 2 (d12)
1 9 2.607 6.053 4.120 3.446 1.055 25.601 2 36 2.489 5.535 3.943 3.046 0.664 16.827 3 84 2.869 5.084 3.891 2.215 0.465 11.965 4 126 2.976 4.861 3.845 1.885 0.364 9.458 5 126 3.127 4.500 3.798 1.374 0.292 7.677 6 84 3.332 4.229 3.761 0.897 0.224 5.965 7 36 3.439 4.057 3.725 0.619 0.169 4.530 8 9 3.550 3.903 3.674 0.353 0.120 3.259 9 1 3.639 3.639 3.639 - -
-Chebyshev distance between cultivars 1 and 2 (d12)
1 9 0.961 2.181 1.619 1.220 0.401 24.779 2 36 1.120 2.282 1.653 1.162 0.296 17.935 3 84 1.197 2.299 1.678 1.103 0.230 13.701 4 126 1.262 2.188 1.692 0.926 0.184 10.863 5 126 1.351 2.080 1.700 0.729 0.148 8.713 6 84 1.454 1.982 1.706 0.528 0.118 6.913 7 36 1.538 1.894 1.710 0.356 0.090 5.274 8 9 1.623 1.807 1.713 0.183 0.063 3.651 9 1 1.716 1.716 1.716 - -
-Revista Brasileira de Milho e Sorgo, v.19, e1181, 2020 DOI: https://doi.org/10.18512/1980-6477/rbms 2020.v19.e1181
For the estimation of the Manhattan and Chebyshev distances between cultivars 1 and 2 (d12), the sufficient number of replicates was 5.34 and 5.32,
respectively (Figure 2). Among the 105 Manhattan distances, the number of replicates varied between 2.93 (distance between cultivars 5 and 15) and 10.82 (distance
0 1 2 3 4 5 6 7 8 9 10 Number of replicates 1.2 1.4 1.6 1.8 2.0 2.2 2.4 2.6 2.8 3.0 Euc lid ea n dis ta nc e 1 2 3 4 5 6 7 8 Number of replicates 0 3 6 9 12 15 18 21 24 CV o f E ucl id ean d ist an ce (% ) Y=21.6104/X0.749609 R2 = 0.97 Xs = 4.78 0 1 2 3 4 5 6 7 8 9 10 Number of replicates 2.0 2.5 3.0 3.5 4.0 4.5 5.0 5.5 6.0 6.5 Ma nha tta n d ist anc e 1 2 3 4 5 6 7 8 Number of replicates 0 3 6 9 12 15 18 21 24 27 30 CV o f M an ha tta n d ist an ce (% ) Y=26.4225/X0.789781 R2 = 0.98 Xs = 5.34 0 1 2 3 4 5 6 7 8 9 10 Number of replicates 0.8 1.0 1.2 1.4 1.6 1.8 2.0 2.2 2.4 Che by she v dis ta nc e 1 2 3 4 5 6 7 8 Number of replicates 0 3 6 9 12 15 18 21 24 27 30 CV o f C he by sh ev d ist an ce (% ) Y=25.9925/X0.695035 R2 = 0.95 Xs = 5.32
Figure 2. Euclidean, Manhattan, and Chebyshev distances relationship, between cultivars 1 and 2 (d12) , in the 511 data files, being 9, 36, 84, 126, 126, 84, 36, 9, and 1, respectively, of the experiments with 1, 2, 3, 4, 5, 6, 7, 8, and 9 replicates. Xs = sufficient number of replicates.
Revista Brasileira de Milho e Sorgo, v.19, e1181, 2020 DOI: https://doi.org/10.18512/1980-6477/rbms 2020.v19.e1181 between cultivars 7 and 11), with a mean of 5.44 (Table
3). Among the 105 Chebyshev distances, the number of replicates varied between 2.39 (distance between cultivars 5 and 15) and 9.50 (distance between cultivars 7 and 11), with a mean of 5.01.
Therefore, the mean of the 105 Xs estimates for
the dissimilarity measures expressed by the Euclidean, Manhattan, and Chebyshev distances were 5.06, 5.44, and 5.01, respectively. Thus, adopting the criterion of considering the largest among the three Xs mean values, rounded up to the upper integer, in order to guarantee precision for the (dii’) estimates of the three dissimilarity
Table 3. Sufficient number of replicates (Xs) for estimation of the dissimilarity measures - Euclidean,
Manhattan, and Chebyshev distances - between i and i’ maize cultivars.
i i' Euclidean Manhattan Chebyshev i i' Euclidean Manhattan Chebyshev i i' Euclidean Manhattan Chebyshev
1 2 4.78 5.34 5.32 3 12 4.16 4.01 4.70 7 9 7.38 7.84 7.22 1 3 5.42 6.36 2.50 3 13 3.81 4.07 3.02 7 10 5.97 6.11 5.85 1 4 4.08 4.69 4.13 3 14 4.73 5.35 4.32 7 11 10.17 10.82 9.50 1 5 4.45 4.45 4.66 3 15 5.26 5.60 5.16 7 12 6.24 5.91 6.48 1 6 4.99 5.54 5.35 4 5 3.45 3.43 4.34 7 13 5.04 5.15 4.74 1 7 6.67 6.92 6.86 4 6 5.30 5.54 5.77 7 14 6.20 6.11 7.29 1 8 6.02 5.92 6.11 4 7 6.22 6.93 6.04 7 15 7.45 8.21 6.40 1 9 5.16 4.53 5.39 4 8 5.08 5.70 4.88 8 9 7.33 7.27 7.80 1 10 4.64 4.95 5.30 4 9 6.13 6.39 6.60 8 10 5.31 5.72 5.09 1 11 7.70 7.69 7.80 4 10 3.53 4.76 4.92 8 11 6.33 6.64 5.84 1 12 4.57 4.17 4.76 4 11 6.00 6.72 4.62 8 12 4.74 5.63 3.99 1 13 3.54 4.10 3.79 4 12 3.49 3.61 3.61 8 13 4.42 4.97 4.81 1 14 5.90 5.97 6.07 4 13 5.71 5.93 5.09 8 14 3.27 3.33 3.89 1 15 2.82 3.24 4.81 4 14 5.11 5.24 5.77 8 15 3.89 4.45 4.64 2 3 5.43 5.63 4.91 4 15 3.38 4.13 2.94 9 10 5.68 5.55 6.42 2 4 4.52 4.93 4.21 5 6 5.30 5.65 4.62 9 11 5.65 6.01 5.67 2 5 3.37 3.92 3.33 5 7 5.30 5.67 4.85 9 12 4.62 4.58 4.60 2 6 3.93 3.83 4.97 5 8 3.57 4.02 3.27 9 13 4.69 5.01 4.96 2 7 6.95 8.48 5.34 5 9 4.57 4.57 4.80 9 14 7.34 7.85 6.59 2 8 3.53 5.17 3.89 5 10 1.60 2.97 3.79 9 15 3.19 3.15 4.26 2 9 6.20 6.53 5.53 5 11 4.72 5.18 4.05 10 11 5.55 6.00 4.78 2 10 4.20 4.98 3.53 5 12 3.04 3.05 2.51 10 12 4.17 5.31 3.98 2 11 6.47 7.50 5.52 5 13 3.88 3.86 4.48 10 13 7.12 7.51 6.48 2 12 5.69 5.88 5.83 5 14 5.30 5.47 4.38 10 14 4.76 4.62 5.39 2 13 3.50 3.87 3.52 5 15 2.57 2.93 2.39 10 15 3.93 3.74 2.64 2 14 5.11 5.32 5.35 6 7 6.59 7.01 6.35 11 12 5.15 4.97 5.11 2 15 4.41 4.75 3.76 6 8 6.48 7.54 6.06 11 13 4.75 5.01 3.83 3 4 4.78 5.55 4.02 6 9 5.86 5.67 6.32 11 14 8.07 8.74 7.47 3 5 3.09 3.39 2.67 6 10 6.31 6.19 6.82 11 15 6.87 7.43 6.36 3 6 5.08 5.48 4.83 6 11 5.44 6.09 5.01 12 13 2.98 3.10 4.07 3 7 4.50 5.51 4.19 6 12 4.39 5.99 3.66 12 14 5.17 4.97 5.57 3 8 4.84 4.87 5.30 6 13 5.48 5.53 5.93 12 15 3.86 3.99 4.59 3 9 4.54 5.42 4.22 6 14 7.35 7.82 7.49 13 14 4.84 5.51 4.01 3 10 4.87 5.45 4.91 6 15 4.13 4.46 3.85 13 15 3.05 3.41 3.51 3 11 5.52 6.25 5.79 7 8 7.05 6.87 7.45 14 15 4.83 6.15 3.72
Revista Brasileira de Milho e Sorgo, v.19, e1181, 2020 DOI: https://doi.org/10.18512/1980-6477/rbms 2020.v19.e1181 measures (E, M, and C), it can be inferred that six replicates are sufficient for estimation of dissimilarity measures among maize cultivars. Experiments with six replicates have been encouraged by Resende & Duarte (2007) and Cargnelutti Filho et al. (2008), and the increase in the number of replicates has evidenced improvement in the experimental precision (Cargnelutti Filho et al., 2010b; Nesi et al., 2010; Cargnelutti Filho & Guadagnin, 2011b; Mendoza & Buitrago, 2015).
Thus, even if these measures of dissimilarity can be estimated with only one replicate, it’s possible to obtain more precise estimates with the increase of the number of replicates. Theoretically, higher reliability of the cultivar groupings formed from these similarity measures will be obtained with a greater number of replicates, due to the better precision of the estimates. However, the deepening of this subject, through the clustering algorithms, was not the focus of this work.
Then, from a practical point of view, when planning an experiment for evaluating cultivars, it’s important to establish a sufficient number of replicates to generate confidence in the dissimilarity measure estimates and, consequently, in clustering patterns. It’s important to consider that few replicates can lead to greater uncertainties in the inferences and many replicates may be unviable in relation to the experiment execution. In this study, it was shown that, for the three dissimilarity measures (Euclidean, Manhattan, and Chebyshev), there was an improvement in the accuracy of the estimates of distances among cultivars with the increase of the number of replicates. This can be explained by the gradual reduction of the amplitude, the standard deviation and the coefficient of variation, with stabilization tendency as from a certain number of replicates. Thus, six replicates can be assumed as a reference, but before generalizing this information, more studies of this nature are suggested, involving more
dissimilarity measures and more scenarios formed by the combination of different numbers of cultivars, numbers of variables and replicates, in maize and other crops.
Conclusions
1. With the increase of the number of replicates, there is an improvement in the accuracy of the dissimilarity measure estimates, among maize cultivars, but the gains in precision (reduction of the coefficient of variation between the estimates) decrease gradually.
2. Six replicates (six plots of 50 plants by cultivar) are sufficient to estimate the dissimilarity measures among maize cultivars expressed by the Euclidean, Manhattan, and Chebyshev distances.
Acknowledgements
To the Brazilian National Council for Scientific and Technological Development (CNPq – Process number 304652/2017-2). To scholarship students and volunteers, for assistance in data collection.
References
CAO, Y.; WILLIAMS, W. P.; BARK, A. W. Effects of sample size (replicate number) on similarity measures in river benthic Aufwuchs community analysis. Water Environment Research, v. 69, n. 1, p. 107-114, 1997. CARGNELUTTI FILHO, A.; GUADAGNIN, J. P. Clustering pattern consistency of corn cultivars. Ciência Rural, v. 41, n. 9, p. 1503-1508, 2011a. DOI: 10.1590/ S0103-84782011005000116
CARGNELUTTI FILHO, A.; GUADAGNIN, J. P. Experimental design in corn. Revista Ciência
Agronômica, v. 42, n. 4, p. 1009-1016, 2011b.
CARGNELUTTI FILHO, A.; RIBEIRO, N. D.; BURIN, C. Clustering pattern consistency of common bean cultivars by dissimilarity measures and clustering methods. Pesquisa Agropecuária Brasileira, v. 45, n. 3, p. 236-243, 2010a. DOI: 10.1590/S0100-204X2010000300002
CARGNELUTTI FILHO, A.; STORCK, L.; GUADAGNIN, J. P. Number of replications for the comparison in corn cultivars. Ciência Rural, v. 40, n. 5, p. 1023-1030, 2010b. DOI: 10.1590/S0103-84782010005000073.
CARGNELUTTI FILHO, A.; TOEBE, M.; ALVES, B. M.; KLEINPAUL, J. A.; NEU, I. M. M. Number of replicates and experimental precision statistics in corn. Pesquisa Agropecuária Brasileira, v. 53, n. 11, p. 1213-1221, 2018. DOI: 10.1590/s0100-204x2018001100003 CRUZ, C. D. Programa Genes - Ampliado e integrado aos aplicativos R, Matlab e Selegen. Acta Scientiarum Agronomy, v. 38, n. 4, p. 547-552, 2016.
CRUZ, C. D.; CARNEIRO, P. C. S.; REGAZZI, A. J. Modelos biométricos aplicados ao melhoramento genético. Viçosa: UFV, 2014.
CRUZ, C. D.; CARNEIRO, P. C. S.; REGAZZI, A. J. Modelos biométricos aplicados ao melhoramento genético. . 4. ed. Viçosa, MG: Universidade Federal de Viçosa, 2012.
FERREIRA, D. F. Estatística Multivariada. Lavras: Universidade Federal de Lavras, 2018.
FIELD, A. Descobrindo a estatística utilizando o
SPSS. Porto Alegre: Artmed, 2009.
GREENACRE, M. ‘Size’ and ‘shape’ in the measurement of multivariate proximity. Methods in Ecology and Evolution, v. 8, p. 1415-1424, 2017. DOI: 10.1111/2041-210X.12776.
GRENIER, P.; PARENT, A. C.; HUARD, D.; ANCTIL, F.; CHAUMONT, D. An assessment of six dissimilarity metrics for climate analogs. Journal of Applied Meteorology and Climatology, v. 52, p. 733-752, 2013. DOI: 10.1175/JAMC-D-12-0170.1
GUJARATI, D. N.; PORTER, D. C. Econometria básica. Porto Alegre: AMGH Editora Ltda, 2011. HAIR, J. F.; BLACK, W. C.; BABI, B. J. ANDERSON, R. E.; TATHAM, R. L. Análise multivariada de dados. Porto Alegre: Bookman, 2009.
MEIER, V. D.; LESSMAN, K. J. Estimation of optimum field plot shape and size for testing yield in Crambe abyssinica Hochst. Crop Science, v. 11, n. 5, p. 648-650, 1971. DOI: 10.2135/ cropsci1971.0011183X001100050013x
MENDOZA, R. G.; BUITRAGO, I. C. Selección de estadísticos para la estimación de la precisión experimental en ensayos de maíz. Agronomía Mesoamericana, v. 26, n. 1, p. 55-63, 2015.
MONTGOMERY, D. C.; PECK, E. A. Introduction to linear regression analysis. New York: John Wiley & Sons, 1982.
NESI, C. N.; BÓ, H. C. D.; GUIDONI, A. L.; BRINGHENTI, C. Minimum number of replications
Revista Brasileira de Milho e Sorgo, v.19, e1181, 2020 DOI: https://doi.org/10.18512/1980-6477/rbms 2020.v19.e1181 in maize hybrid competition experiments. Revista de Ciências Agroveterinárias, v. 9, n. 1, p. 74-81, 2010. PIMENTEL-GOMES, F. Curso de estatística experimental. 15. ed. Piracicaba: FEALQ, 2009.
R DEVELOPMENT CORE TEAM. R: A Language and Environment for Statistical Computing. Vienna: R Foundation for Statistical Computing, 2019.
RESENDE, M. D. V.; DUARTE, J. B. Precision and quality control in variety trials. Pesquisa Agropecuária Tropical, v. 37, n. 3, p. 182-194, 2007.
STORCK, L.; GARCIA, D. C.; LOPES, S. J.; ESTEFANEL, V. Experimentação vegetal. Santa Maria: UFSM, 2016.
XU, H.; ZHANG, W.; JIANG, Y.; ZHU, M.; AL-RASHEID, K. A. S. Sampling sufficiency for analyzing taxonomic relatedness of periphytic ciliate communities using an artificial substratum in coastal waters. Journal of Sea Research, v. 72, n. 1, p. 22-27, 2012. DOI: 10.1016/j.seares.2012.04.010
![Table 1. Summary of the variance analysis [degrees of freedom (DF) and mean square for the sources of variation: block, cultivar, and error], mean, coefficient of experimental variation (CV), F-test value for cultivar (F), selective accuracy (SA), p-valu](https://thumb-eu.123doks.com/thumbv2/123dok_br/15565436.1047386/6.892.91.807.262.927/summary-variance-analysis-variation-coefficient-experimental-variation-selective.webp)