1
Universidade de Lisboa
Faculdade de Ciências
Departamento de Química e Bioquímica
Structural and functional characterization of the bacterial ferrous
homeostasis protein FeoA
Vanessa Vieira
Dissertação
Mestrado em Bioquímica
Especialização em Bioquímica
2
Universidade de Lisboa
Faculdade de Ciências
Departamento de Química e Bioquímica
Structural and functional characterization of the bacterial ferrous
homeostasis protein FeoA
Vanessa Vieira
Dissertação
Mestrado em Bioquímica
Especialização em Bioquímica
2012
3
Acknowledgments
I would like to thank all that contributed to the conclusion of my master´s thesis. First, I have to mention my supervisor in ITQB, Manolis Matzapetakis, which gave me the opportunity to work in this project.
Second, to my lab colleagues Meire Almeida and Ana Pereira that helped me in the laboratory work and in the NMR analysis.
At last, I must also thank my friends and family, especially my parents, for their financial and emotional support.
4
Contents
Acknowledgments ... 3 Table of Figures ... 6 Abstract ... 8 Sumário ... 91.Introduction ...Error! Bookmark not defined. 1.1 Role and properties of Iron ... 11
1.2-Iron acquisition ... 12
1.2.1 Iron acquisition: The import of ferric Iron (Fe3+) ... 12
Iron acquisition: The import of ferrous Iron (Fe 2+) ... 13
1.3- The Feo operon in E. coli ... 14
1.4- Control of the feo operon in E.coli. ... 14
1.5-The FeoB protein ... 15
1.6- The FeoC protein ... 16
1.7- The FeoA protein ... 17
1.7.1- FeoA crystal structure ... 17
1.7.2-FeoA function ... 18
1.8-Protein structure determination from NMR data ... 19
2. Plan and Methods ... 21
2.1. Expression ... 21
2.1.1. Expression system ... 21
2.1.2. Optimization of the expression conditions ... 22
2.1.3. Overexpression of isotope-labelled proteins ... 23
2.1.4. Expression protocol ... 24
2.2. Purification ... 25
2.2.1. Optimization of purification protocol ... 25
2.3.NMR sample preparation and data collection ... 27
2.4 Data Processing and Analysis ... 27
3. Results and Discussion ... 28
3.1. Expression of FeoA protein ... 28
3.1.1-Growth Curve ... 28
5
3.1.3 –Time and temperature of induction ... 29
3.2. Purification of FeoA protein ... 30
3.2.1.Optimization of the purification scheme ... 31
Proeminent form ... 36 Concentration... 36 Area (Dimer) ... 36 mAU*ml ... 36 Area (Monomer)... 36 mAU*ml ... 36 Dimer ... 36 3.2 mg/ml ... 36 144 ... 36 38 ... 36
3.2.2. Purification of the single labelled 15N and double 13C/15N labelled forms of FeoA ... 41
3.3.- NMR data analysis ... 44
3.3.1-Backbone assignment ... 48
3.3.2-Side chain assignment ... 55
3.3.3.-FeoA structure ... 60
3.3.4-NMR differences between dimer and monomer forms ... 63
4. Conclusions... 68
4.1 The presence of the FeoA dimer in solution ... 68
4.2-FeoA from E.coli has an SH3 domain-like fold ... 70
4.3-FeoA Dimer ... 70
5. Future Perspectives ... 71
6
Table of Figures
Figure 1: Organization of siderophore excretion and internalization in gram-positive and gram-negative bacteria.(5) __________________________________________________________________________ 13 Figure 2: Gene organization of the Feo system in E.coli. The size, molecular weight and pI of each of the proteins encoded is also shown. _________________________________________________________ 14 Figure 3: Graphical depiction of the proposed function of the Feo system. The question marks denote unconfirmed interactions. ______________________________________________________________ 16 Figure 4: pET-21c (+) vector from Novagen used to clone the FeoA gene ________________________ 22 Figure 5: Growth curve of BL21 transformed with pET 21c(+). _________________________________ 28 Figure 6: SDS-PAGE (Tris-Glycine 12.5%), A soluble/insoluble test, E. coli induced at 25°C. Lane 1: Marker. Lane 2-6: soluble fractions from 0 to 4h of induction. Lane 7-11: insoluble fractions from 0h to 4h of induction. B: Soluble/insoluble test. E. coli, induced at 37°C. Lane 1: Marker.Lane2-6 Soluble fractions from 0 to 4h of induction. Lane 7-11: Insoluble fraction from 0 to 4h of induction. _________________ 29 Figure 7: SDS-PAGE (Tris-Tryc 12.5%), A soluble test, E. coli induced at 25°C for a16 hour period. Lane 1: Marker. Lane 2-6: soluble fractions from 0 to 16h of induction. B: Insoluble test. E. coli, induced at 25oC for a 16 hour period. Lane 1: Marker. Lane 2-6 Insoluble fractions from 0h to 16 of induction. _______ 30 Figure 8: SDS-PAGE ( Tris-Glyc 15%) of FeoA expression at 25oC. Soluble fractions from hour 0 to hour 4. ___________________________________________________________________________________ 31 Figure 9: Cation exchange chromatography using a linear gradient of NaCl to elute the FeoA protein. The UV ( protein/blue) and conductivity (salt/red) traces show the elution of protein peaks and the changes in salt concentration during elution. An SDS-PAGE (Tris-Gly 15%) shows the presence of our target protein in the three peaks. ________________________________________________________ 32 Figure 10: The FeoA sequence from E.coli K12 strain. ________________________________________ 33 Figure 11: Size exclusion chromatography of the three peaks collected in the previous ion exchange chromatography, the corresponding SDS-PAGE (15%Tris-Gly) of the dimer and monomer fractions and the calibration curve of the Superdex 75 column. The UV (protein/blue) trace show the elution of protein peaks during the chromatography. _______________________________________________________ 34 Figure 12: Size exclusion chromatography of different solutions with different concentration and the calibration curve of the HiLoad 16/60 Superdex 75 prep column. The UV (protein/blue) trace shows the elution of protein peaks during the chromatography. ________________________________________ 35 Figure 13: Size exclusion chromatography performed without the presence of salt. The UV (protein/blue) trace shows the elution of protein peaks during the chromatography. ___________________________ 37 Figure 14: Comparation between the SDS-PAGE (Tris/Gly 15%) after the cation exchange (A) and size exclusion (B) chromatography in terms of presence of impurities. ______________________________ 38 Figure 15: Comparation between the cation exchange chromatography performed in reducing conditions (2mM B-Mercaptoetanol) and at oxidative conditions (no B-Mercaptoetanol). ____________________ 39 Figure 16: Final optimized purification scheme for the unlabelled FeoA protein. ___________________ 40 Figure 17: Final yield for a two liter culture necessary to achieve the necessary protein concentration for NMR. The final volume of 500 µl is the final volume used in the NMR tubes. ______________________ 41 Figure 18: Purification scheme of the single labelled 15NFeoA. _________________________________ 42 Figure 19: Yield of the single labelled 15N FeoA. _____________________________________________ 42 Figure 20: Purification of the double labelled 15N/13C FeoA. ___________________________________ 43 Figure 21: Yield of the double labelled 15N/13C FeoA. _________________________________________ 43 Figure 22 Display of 1H 1D spectra of FeoA protein at day one (blue) and at day seven (red). The typical Backbone HN region is shown as well as the Hα from the β-sheets. _____________________________ 45
7
Figure 23: Scheme of the 1H-15N-HSQC 2D experiment magnetization pathway. ___________________ 45 Figure 24:1H-15N-HSQC from a FeoA protein sample with a final concentration of 0.64 mM. _________ 46 Figure 25: Overlay of 1H-15N-HSQC with the prevalence of the monomer form 10uM (red) and the prevalence of both forms 0.64mM (blue).__________________________________________________ 47 Figure 26: Scheme showing the correlations of the previous aminoacid CO (blue) and current aminoacid Cα as well as the previous aminoacid (red). ________________________________________________ 49 Figure 27: Scheme of the HNCO 3D magnetization pathway and the corresponding FeoA HNCO. _____ 50 Figure 28: Scheme of the HN(CA)CO 3D magnetization pathway and the corresponding FeoA HN(CA)CO. ___________________________________________________________________________________ 50 Figure 29: Procedure for the sequential alignment of HN(CA)CO strips. __________________________ 51 Figure 30: Chemichal shift variation for the CO, Cα and Cβ in the different aminoacids. _____________ 52 Figure 31: Scheme of the HN(CO)CACB 3D magnetization pathway and the corresponding FeoA
HN(CO)CACB. ________________________________________________________________________ 53 Figure 32: Scheme of the HNCACB 3D magnetization pathway and the corresponding FeoA HNCACB. _ 54 Figure 33: 1H-15N-HSQC where all the H-N peaks were assigned to a FeoA aminoacid. The red H-N group correspond to the side chain H-N groups of Glutamine and Asparagine. _________________________ 55 Figure 34: Scheme of the HBHA(CO)NH 3D experiment magnetization pathway and the respective FeoA HBHA(CO)NH. ________________________________________________________________________ 56 Figure 35: Scheme of the hCCH-TOCSY 3D experiment magnetization pathway. __________________ 57 Figure 36: FeoA hCCH-TOCSY 3D spectrum. Isoleucine is here used as an example showing the
correlations between carbon and proton resonances of the aliphatic chain. ______________________ 57 Figure 37: Scheme of the 13C-NOESY 3D experiment magnetization pathway and the corresponding FeoA 13
C-NOESY. __________________________________________________________________________ 58 Figure 38: Scheme of the 1H-13C-HSQC 3D experiment magnetization pathway and the corresponding FeoA 1H-13C-HSQC. ____________________________________________________________________ 59 Figure 39: The FeoA 15N-NOESY. Isoleucine 49 is here shown as an example.______________________ 60 Figure 40: Final statistics of FeoA structure determination by NMR. ____________________________ 62 Figure 41: Experimental restraints for FeoA protein, including sequential, short- and medium-range NOEs and Hα, Cα, CO and Cβ secondary shits along with the secondary structure deduced from the data. The amino acid sequence and numbering are shown at the top. Sequential N-N and a-N NOEs are indicated by black bars; the thickness of the bar represents the strength of the observed NOE. The presence of medium-range N-N and a-N NOEs is indicated by solid lines. The chemical shift indices shown for Cα, Cβ, CO and Ha are also shown by black bars at the bottom. The locations of the secondary structure
elements identified in the calculated family of structures are shown at the bottom. ________________ 62 Figure 42: Solution structure of FeoA. a) Backbone ribbon display of the average structure of FeoA. b) The FeoA tertiary structure in sausage model. ______________________________________________ 63 Figure 43: FeoA 1H-15N-HSQC showing the dimer monomer pairs. The identification of the peak is always closer to the monomer peak. ____________________________________________________________ 64 Figure 44: 1H and 15N combined shift difference between the 15N-HSQC spectrum from monomer and dimer forms of FeoA protein. The horizontal black line at 0.2 combined shift difference aims to identify the residues that shifted the most. _______________________________________________________ 65 Figure 45: The number of restraints per residue in the FeoA sequence. The chart legend and color is shown above. ________________________________________________________________________ 66 Figure 46: Structure of FeoA with the aminoacids affected by the dimer interaction shown in different colors. The yellow color represents those aminoacids that suffer chemical shift perturbation lower than 0.1 ppm. The color orange shows an intermediate level of perturbation of equal or higher than 0.1 ppm and finally the red color shows the strongest perturbation of equal or higher than 0.2 ppm. _________ 67
8
Abstract
The goal of this project was to study the FeoA protein from E.coli, in terms of both structure and function as the title suggests.
FeoA is a component of one of the major systems responsible for bacterial ferrous iron uptake, the Feo (ferrous iron-transport) system. In addition to FeoA it also contains the, FeoB and FeoC proteins.
FeoB acts as a GTP dependent ferrous permease spanning the cytoplasmatic membrane of E.coli. Its N-terminal domain is a GTPase which regulates the ferrous influx.
FeoC is believed to be a transcriptional activator or repressor which was recently found in in-vitro experiments to be directly interacting with FeoB potentially modulating its action.
The FeoA function that is an important goal of this project was also further elucidated in June 2012 while this project was ongoing. It was shown in vivo that FeoA also interacts with FeoB protein being involved in its import of Fe (II).
This agrees with our group’s hypothesis that the FeoA protein might stimulate the GTPase activity of FeoB.
Our strategy was to probe the mode of interaction of the proteins of the feo operon in vitro using NMR spectroscopy. The first step in this task was to characterize each of its components.
In order to determine the FeoA structure through NMR spectroscopy it was necessary to optimize its expression and purification conditions. During the process of purification it was reported for the first time the presence in solution of the FeoA homodimer.
The FeoA monomer was structurally characterize by NMR analysis, where it was verified that the structure is an SH3-domain-like fold in agreement with the crystal structure (16). The residues affected by the dimerization were also determined by NMR.
9
Sumário
O objectivo deste trabalho intitulado ““Structural and functional characterization of the bacterial ferrous homeostasis protein FeoA” consistiu na determinação da estrutura e função da proteina FeoA da bacteria E.coli.
A principal via bacteriana de entrada do ferro ferroso é através do sistema Feo que deriva das palavras inglesas ferrous iron transport.
O ferro é um elemento essencial para a maioria dos organismos participando em vias metabólicas essenciais. Os sistemas de importação de ferro seja ele ferro ferroso(Fe2+) ou ferro férrico (Fe3+ ) são importantes alvos terâpeuticos limitando o crescimento celular e são por essas razões alvo de estudos científicos.
O sistema Feo é o principal responsável pela importaçãode ferro ferroso nas bacterias E.coli quando estas habitam ambientes anaerobicos e de baixo pH ricos em ferro ferroso.
O operão feo na E.coli codifica tres proteinas a FeoA, FeoB e a proteina FeoC.
A proteina FeoB é o principal componente deste sistema actuando como uma permease pela qual o ferro ferroso é transportado para o interior do citoplasma da bacteria.
A sua função de permease está dependente do seu dominio” N-terminal G-protein” que possui actividade enzimática GTPase. A hidrolíse de GTP ocorre a uma taxa extremamente baixa e por isso é especulado que a proteina FeoA seja o factor utilizado para aumentar a sua taxa de hidrolíse.
Recentemente a função da FeoA foi esclarecida num artigo cientifico publicado em Junho de 2012 durante o decurso deste projecto. Revelou-se neste artigo que a proteina FeoA é essencial para a função da FeoB. Sem interacção entre as duas proteinas não ocorre o influxo de Fe2+ para citoplasma.
Para determinar a estrutura da proteina FeoA atraves de RMN foi necessario um longo processo de optimização das condições de expressão e purificação.
A analise de proteinas através de RMN pressupõe que estas estejam isotopicamente marcadas seja com 15N ou 15N /13C de forma a diminuir a complexidade dos espectros obtidos. Esta marcação só foi possivel através da expressão de da proteina FeoA em meios marcados com os respectivos elementos químicos. Os meios minímos foram utilizados neste processo visto que possibilitavam a substituição das fontes de carbono e nitrogénio pelos respectivos reagentes equivalentes (13C-Glucose e 15NH4Cl)
10
Durante o processo de optimização da purifição foi detectada a presença do dimero de FeoA (17kDa) em solução. Este resultado foi muito importante pois foi a primeira que foi detectada a presença do dimero de FeoA em solução, apesar de existirem algumas estruturas de FeoA em dimero cuja relevância fisiológica é ainda pouco clara.
A concentração total de proteina afecta a proporção do monomero e do dimero de FeoA. Foi também determinado ao longo deste projecto a impossibilidade de separar ambas as formas visto que se encontram num equilibrio dinâmico.
Nas fases preliminares deste projecto foi produzida uma amostra cuja concentração era muito baixa 10uM que continha maioritariamente o monomero. Esta amostra era inicialmente mais concentrada mas com o tempo a amostra degradou-se e precipitou levando a uma diminuição da concentração total. Esta amostra apenas possibilitou a obtenção de um 1H-15N-HSQC que devido á sua diluição não permitiu a obtenção de espectros essenciais á determinação da estrutura.
O 1H-15N-HSQC obtido quando comparado com o 1H-15N-HSQC na qual se encontram ambas as formas possibilitou a distinção dos picos relativos ao monomero e ao dimero.
Para determinar a estrutura da FeoA foi utilizado o 1H-15N-HSQC como guia para identificar os picos em vários outros espectros. Os espectros HNCO,HN(CA)CO, HNCACB e HN(CO)CACB foram utilizados para a identificação dos atomos do backbone da proteina ao mesmo tempo que nos permitiram ligar os varios picos de acordo com a sequência da proteina FeoA.
Por outro lado os espectros 15N-TOCSY, hCCH-TOCSY, 1H-13C-HSQC permitiram a identificação dos atomos da cadeia lateral dos aminoacidos.
No fim este conjunto de picos identificadfos foram utilzados nos espectros NOESY que nos permitem identificar interaçãoes até um maximo de 5 A entre H-H. Esta informação permitiu-nos produzir a estruttura da FeoA ao fim de um longo processo de analise por parte de vários softwares e fases finais de refinamento.
A estrutura final da FeoA da E.coli possui uma estrutura SH3 domain-like fold semelhante á estrutura determinada através de cristalografia do organismo Stenotrophomonas maltophilia.
11
1. Introduction
The purpose of this project entitled “Structural and functional characterization of the
bacterial ferrous homeostasis protein FeoA” is the study of FeoA protein from E.coli.
This protein is one of three comprising the feo operon, which is believed to be one of the main paths of ferrous iron influx in bacteria. It is a small, 8.5 kDa protein and the only structure of this protein described in the literature so far, is of a possibly non physiological dimeric form, obtained by X-Ray Crystallography. the structure is reminiscent of SH3 domains, which suggests that it might be involved in protein-protein interactions.
In this work it was possible to determine the FeoA structure in solution with the use of NMR spectroscopy. The project included the sample preparation, establishing and optimizing the expression and purification protocols, the NMR data collection and structure determination.
1.1 Role and properties of Iron
Iron is an essential element for most forms of life, although there are some organisms like the prokaryotes Lactobacillus plantarum and Borrelia burgdorferii that can grow in the total absence of iron. In these bacteria the Mn 2+ substitutes for iron as the metal component of enzymes that normally contain Fe2+. (1; 2)
For the organisms that depend on iron, this element is responsible for the biological activity of many proteins and enzymes participating in essential metabolic pathways such as amino acid synthesis, respiration and DNA biosynthesis.
Despite being one of the most abundant metals on earth, there is practically no free iron available for bacteria, in most of the environment they colonize. In order to meet their iron needs bacteria evolved multiple iron acquisition systems, reflecting the diversity of their potential iron sources. (3)
Thus, in order to achieve effective iron homeostasis, organisms must balance their need to efficiently scavenge iron from their surroundings to ensure that adequate supplies are maintained, with the careful management of cellular free iron levels to guard against iron induced toxicity.(3)
Due to its importance iron depletion inhibits the growth of many microorganisms, including that of pathogenic bacteria. In addition to the low availability of iron in most environments, the pathogenic bacteria have also to deal with the host iron-withdrawal
12
responses. In the case of E.coli most strains are not pathogenic, however, there are still 200 E.coli strains that can cause life-threatening diseases such as diarrhea and urinary infections. For these pathogenic strains as well as for other pathogenic species, their iron import systems in all their variety are potential therapeutic targets to limit cell growth. (4) Hence, the research within this project may have direct impact in the design of novel therapeutic strategies.
1.2-Iron acquisition
1.2.1 Iron acquisition: The import of ferric Iron (Fe3+)
In bacteria the transport of iron into the cytoplasm is accomplished via multiple routes, depending on the oxidation state of iron.
To better understand the role of iron on the multiple import systems of bacteria, we need to discriminate between its two readily inter-convertible redox states: the Fe3+ ferric iron and the Fe2+ ferrous iron. These two distinct oxidation states exist under different conditions; with the ferric form Fe(III) dominating at what we perceive as ambient conditions (neutral pH and oxygen rich atmosphere), while the ferrous form Fe(II) is predominant in acidic and/or anaerobic environments.(3)
Although the ferric form is the most abundant due to its prevalence in aerobic and neutral pH environments, it is characterized by its poor solubility (10-18 M at pH 7.0 for ferric state versus 0.1 M at pH 7.0 for ferrous) making the bioavailability only possible in the form of various insoluble minerals.
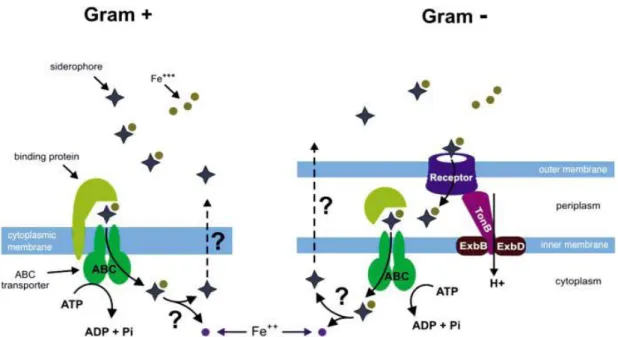
This low solubility of ferric iron has driven the majority of bacteria to produce or secrete iron-binding agents called siderophores (molecules that chelate ferric iron with high affinity) that bind iron and transport it into the cell in the form of ferric complexes. In Gram-negative bacteria, such as E. coli, siderophore-bound Fe(III) is recognized by outer membrane receptors and is then transported into cells in a process that requires the TonB–ExbB–ExbD protein complexes.(5) (Figure 1)
13
Figure 1: Organization of siderophore excretion and internalization in gram-positive and gram-negative bacteria. (5)
Iron acquisition: The import of ferrous Iron (Fe 2+)
Under anaerobic conditions and acidic pH, Fe (II) is the major form of bioavailable iron. This highly soluble ion is the preferred form of iron utilized by bacteria under these conditions since, unlike the ferric form, it can be transported as a free ion. In the case of Gram-negative bacteria the ferrous iron diffuses freely through the outer membrane porins and is then transported through the cytoplasmic membrane by an ABC ferrous ion transporter conserved in many species. (6)
The transport through the cytoplasmatic membrane is accomplished by a transport system like the metal-ABC permeases and Nramp-like transporters such as SitABCD and MntH respectively, that display specificity for divalent metals, such as Fe2+ and Mn2+ but are primarily involved in the uptake of manganese rather than iron. (4) The major route for bacterial-ferrous-iron uptake would appear to be, in many cases, via Feo (Ferrous iron transport) system. The Feo system appears to be unlike any other bacterial ion transporter. However, despite its importance and novelty, surprisingly little research has been performed on the Feo pathway.
While the Feo pathway is not the prevalent mode of iron uptake for most bacteria, it is very important in bacteria that inhabit anaerobic environments like the human intestine, where the ability to import ferrous iron is crucial. (7)
14 1.3- The Feo operon in E. coli
The analysis of the feo locus in E.coli proved the existence of three closely associated genes likely to form an operon, the feoABC . (8;9)
Figure 2: Gene organization of the Feo system in E.coli. The size, molecular weight and pI of each of the proteins encoded is also shown.
The operon encodes three predicted proteins: FeoA, a small 75-residue hydrophilic protein; FeoB, a large 773-residue protein with an integral membrane domain (_270– 773) likely to act as the ferrous permease; and FeoC a small 78-residue hydrophilic protein found so far only associated with c-proteobacterial Feo systems.
The role of FeoB as a GTP gated transmembrane permease is starting to be understood (10), and was shown recently to be essential for transport of periplasmic Fe(II) to the cytoplasm. However, little is known about the function of the two small proteins FeoA and FeoC (6). FeoA is proposed to function in a concerted mechanism with FeoB for transport of ferrous iron and FeoC only recently (September 2012) was shown to interact with FeoB modulating its activity (28).
1.4- Control of the feo operon in E.coli.
Most of the bacterial genes involved in iron assimilation are expressed only under conditions of iron deficiency. When the intracellular iron concentration rises, these genes are repressed. It seems that the iron acquisition systems are not simultaneously induced in response to iron limitation irrespective of the nature of the iron source.
15
Several iron acquisition systems are positively regulated by their respective iron sources.
The expression of the feo operon is regulated by Fur and Fnr transcriptional regulators that activate the expression under anaerobic conditions (Fnr) and repress it at high-iron concentrations (Fur).
The upstream region of feo operon contains the binding site for the regulatory protein Fur, which acts with iron (ll) as a corepressor in all known iron transport systems of
E.coli, switching the operon off when the intracellular levels of Iron (II) are high.
In addition, an Fnr binding site was identified in the promoter region. Fnr is the transcriptional activator of anaerobic respiratory genes. feoABC is anaerobically induced by Fnr, consistent with the induction of Feo activity under anaerobic conditions. Fe(II) has also been shown to influence the activity of Fnr, since iron limitation led to a reduced activity of Fnr.(3)
1.5-The FeoB protein
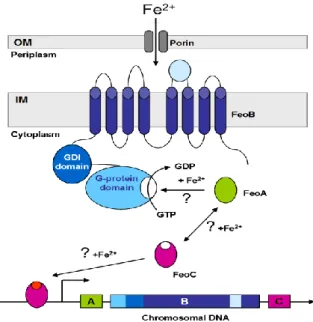
FeoB is the major component of the Feo system. It acts as the permease through which ferrous iron is transported into the cell. In E. coli the FeoB protein is composed of a hydrophilic N-terminal domain (FeoB-N; residues 1 to 270) and a C-terminal integral-membrane domain (FeoB-C; residues _271–773) that is predicted to consist of eight transmembrane α-helices.(6)
FeoB transport activity is strongly dependent on its N-terminal G-protein domain. The N-terminal ‘G-protein region’ has GTPase activity, as observed for the homologous small regulatory G-proteins of eukaryotes.
This hydrophilic domain is starting to be understood and was shown to be essential for transport of periplasmic Fe(II) to the cytoplasm.(11)
The N-terminal GTPase is composed of two regions, the catalytic GTPase (FeoB_G, residue 1 to 160, ~18kDa) and the GDP Dissociation Inhibitor (FeoB_GDI, residue 160 to 270, ~12kDa) domains.(12)
This domain is able to hydrolyze GTP to GDP but at an extremely low rate because of its very high affinity for the reaction product, GDP, which results in inactivation of the enzyme after one turnover cycle. Because of these properties FeoB-N terminal is believed to require some factor or event to increase its hydrolysis rate.
16
Figure 3: Graphical depiction of the proposed function of the Feo system. The question marks denote unconfirmed interactions.
The eukaryotic G-proteins have a similar mechanism of function as the FeoB, they also possess low rate in hydrolyzing GTP. In the eukaryotic G-proteins this is overcome by the interaction with GAPs proteins through their SH3 domain that stimulates GTPase activity.
It is very interesting that in the crystal structure of FeoA an SH3-like-fold- domain was identified that could point to a modulation of FeoB activity by FeoA protein.(15)
1.6- The FeoC protein
In E.coli the feoB gene precedes a gene called feoC which is also found similarly located within the feo locus of other (gamma)-proteobacteria.
Multiple-alignment of the FeoC proteins (15 examples in the NCBI database, Sept 2005) shows that they possess four conserved Cys residues (CxxGxCKxCPx4-7C) likely to provide a binding site for an [Fe–S]-cluster.(6)
Furthermore, the solution structure of FeoC has recently been deposited in the Protein Data Bank revealing that the protein is a monomer with a winged-helix fold (14) within its N-terminal region. This fold belongs to the family of helix-turn-helix folds and is normally DNA (sometimes RNA) binding in function supporting a likely role as a transcriptional regulator directly controlling feoABC expression.
17
Also in a recently new paper it was shown in-vitro that FeoC binds to FeoB disrupting the formation of a potential pore by interfering with FeoB trimerization. These results provide evidences suggesting that FeoC may play a role in regulating Fe2+ transport, in addition to or in conjunction with its presumed gene regulator role. (28)
1.7- The FeoA protein
The function of FeoA is starting to be understood only in recent times (June 2012) and only a few structures of the protein are available, in data banks such as the crystallographic structure of FeoA from Stenotrophomonas maltophilia (15).
This FeoA structure was found to adopt an SH3-domain-like fold similar to that adopted by SH3-domains of eukaryotic proteins, although no sequence identity exists among these proteins.
1.7.1- FeoA crystal structure
The only tertiary structure published of FeoA is the crystal structure from S.
maltophilia (Sm) that revealed a unique prokaryote SH3-domain-like- fold that is rarely
observed in the bacterial kingdom.
Interestingly, in the crytstal structure the Sm FeoA is found as a homodimer that is cross-linked by two zinc ions and six chloride ions.(15) It is likely that this mode of dimerization described in this paper is not physiologically significant since very little or no dimer was observed in solution studies. In addition Chloride is very rarely seen as a ligand in water exposed metal complexes in solution.
The eukaryotic SH-3 domain-like-fold adopted by FeoA bears low sequence identity to eukaryotic proteins that have a similar SH-3 domain. The homology exists at the structural level only. (16)
The SH3 domains are found in a number of eukaryotic proteins involved in signalling (e.g. Ras-GTPase activating protein or GAP) and in cytoskeletal dynamics (e.g. myosin 1B).(16)
These SH3 domains are composed of 50–70 residues that form a barrel with five anti-parallel β-strands and are involved in mediating protein-protein interactions with target proteins that contain 10-residue Proline rich motifs. (17)
18
One of the other prokaryotic proteins that have an SH-3 domain-like-fold in the presence of manganese and cobalt ions is diphtheria toxin regulator, DtxR (18).The SH-3 like domain of DxtR also exhibits structural homology to FeoA.
The diphtheria toxin regulator protein functions as the major iron-responsive regulator in Corynebacterium diphtheriae.
Both FeoA and the SH3-like-domain-fold of DtxR proteins have no clear sequence similarity with eukaryotic SH3- domain proteins, but their common fold does suggest a common role in mediating protein–protein interactions. This raises the possibility that FeoA interacts with its partner protein, FeoB, thereby mediating FeoB-dependent Fe (II)-uptake activity through this SH-3 domain.
1.7.2-FeoA function
The function of FeoA protein recently became clearer with the June 2012 paper “The
FeoA protein is necessary for the FeoB transporter to import ferrous iron”. (19)
With the use of a Bacterial two-hybrid assay it was determined that the FeoA protein directly and specifically binds to the FeoB transporter in vivo. This FeoA-FeoB interaction appeared necessary for FeoB mediated Fe(II) uptake because Salmonella expressing the mutant FeoA that could not interact with FeoB failed to uptake Fe(II) via the FeoB transporter.(19) One of the residues found to be important for FeoA interaction with FeoB is Leucine26. This residue is highly conserved in the FeoA proteins from various bacterial origins as well as the structural homologous DxtR protein.
The absence of a functional FeoA protein resulted in impaired import of Fe(II) by FeoB. As mentioned before the FeoB N-terminus has been demonstrated to possess GTPase activity.
Similar to eukaryotic G-proteins, the FeoB G-protein possesses weak GTPase activity and displays very slow GTP hydrolysis. In the eukaryotic systems the presence of GTPase activating proteins (GAPs) that directly interact with the G- proteins stimulates their GTPase activity. (6)
The results of this recent paper raise the possibility that the FeoA protein might stimulate the GTPase activity of FeoB protein in the same way as the eukaryotic GAPs. Interestingly the presence of the SH3 domain-like fold in FeoA evidenced by the tertiary structure of FeoA from Stenotrophomonas maltophilia gives credit to this
19
hypothesis since in eukaryotes the SH3 domains are present in many signalling proteins including GAPs known to mediate protein–protein interactions. (15)
Therefore it could be suggested that the FeoA protein resembles eukaryotic GAPs, which further supports the hypothesis that the FeoA protein acts as a modulator for the FeoB’s G-protein function.
1.8-Protein structure determination from NMR data
Nuclear magnetic resonance (NMR) is a very versatile technique that can detect the frequency at which certain nuclei are resonating under the influence of a magnetic field. Slight variations in this resonant frequency give us detailed information about the molecular structure in which the atom resides. It has a very wide variety of applications and it can also be used to study the structure and properties of organic molecules and biomolecules.
The available nuclei suitable for nuclear magnetic resonance are those with non-zero spin quantum number. Thus, only unpaired nuclear spins are detected in NMR spectroscopy. The most widely used nuclei in biomolecular NMR are the ones with I1/2 (like the 1H, 15N and 13C).
Although NMR was discovered in 1946, its application to biological systems only started in the late 1970s and early 1980s. Major breakthroughs happened in this period that revolutionized the field, allowing the use of NMR in determining the three-dimensional structures of macromolecules. (20)
Due to differences / advantages with respect to X-Ray crystallography, the interest in protein structure determination by NMR is immense. Namely, NMR can provide complementary structural information in a more physiologically relevant solution environments. Moreover, since some biomolecules are difficult to crystallize, NMR can be used as an alternative method for obtaining three-dimensional structures.
More recently, in the late 1980s and early 1990s, the NMR limit of analysis was shifted from molecules of size less than 10kDa to a upper limit of 35 kDa due to the development of multidimensional heteronuclear methods as well as advances of molecular biology that allow to overexpress isotope labelled proteins such as 15N/13C double labelled proteins.
20
Today one fifth of the macromolecular structures deposited in the PDB (Protein DataBank) are derived from NMR spectroscopy. Despite its size limitation for macromolecular structure determination, NMR has the following unique features:
(a) It allows structural studies in a physiological relevant solution environment, which avoids experimental artefacts such as crystal packing seen in crystal structures.
(b) It allows structural studies of some molecules that are difficult to crystallize such as flexible protein domains, weakly bound protein complexes.
(c) It can provide information about protein dynamics, flexibility, folding/unfolding transitions..
The structure determination of proteins by NMR spectroscopy includes normally three stages:
(a) Sample preparation, NMR experiments for data collection and data processing (b) Sequence specific assignment, NOESY assignment, assignments of other
conformational restraints such as J coupling and hydrogen bonding (c) Structure calculation and structure refinement
The data analysis uses a series of parameters that allow the determination of important values used as pieces in a puzzle to build the tertiary structure of a protein. The Chemical shifts provide the secondary structural information for proteins, the J couplings constants provide the dihedral angle of the peptide plane which in turn is related to the secondary structure and the nuclear Overhauser effects (NOEs) provide the 1H-1H distance within a 5 Å maximum distance. The NOE data are considered to be the most important because of the long range structural information they contain which leads to tertiary structural information.
21
2. Plan and Methods
The main goal of this project is to determine the structure of FeoA protein using NMR spectroscopy. The protein samples produced for NMR have to be isotopically labelled in order to decrease the complexity of spectra making the analysis of data much faster and easier. The expression and purification protocols have to be optimized in ways that are only relevant for this technique. The use of expensive isotopically labelled reagents such as 13C-Glucose and 15NH4Cl dictates that the expression of the protein has to be optimized to give the highest possible yield while using smaller amounts of these reagents.
Besides being isotpically labelled the protein sample used for NMR analysis, also has to be pure and stable. This is achieved with the next stage of the protocol, the optimization of the best purification scheme.
The FeoA project had already some preliminary results done by Meire Almeida a lab member. This preliminary results that included some NMR spectra, helped simplifying the design of the various protocols.
2.1. Expression
2.1.1. Expression system
The gene coding for FeoA protein was amplified from genomic DNA from DH5α E.coli (NZY5α by NZYtech genes & enzymes) and inserted into the vector pET-21c (+) and was transformed into BL21(DE3) strain cells of E. coli (from NZYtech genes & enzymes). A glycerol stock (80% glycerol) of BL21 cells was prepared and stored at - 80oC for further expression and purification trials. (Meire Almeida).
The pET-21c (+) vector used to overexpress FeoA protein has a selective marker for ampicillin (ampR ) and a LacI gene that induces the expression of FeoA with the addition of IPTG. (21) This plasmids were available prior to the start of this work. (Figure 4)
22
2.1.2. Optimization of the expression conditions
To maximize protein expression and to increase the soluble fraction in bacterial lysates for posterior purification, a series of expression conditions was varied:
1- The cell density (OD 600nm) was measured as a function of time in hours and the results were used to make a growth curve. The growth of the BL21 strain transformed with the pET21-c (+) was monitored in LB medium with 100 mg/ml of ampicillin at 37oC.
2- The induction of protein expression was performed in the middle of the log-phase (determined in step 1 OD600nm) with a range of different IPTG concentrations from 0.1mM to 2mM.
3- The length of induction of protein expression was varied from 1 hour to overnight as well as the temperature from 20o C to 37oC.
Figure 4: pET-21c (+) vector from Novagen used to clone the FeoA gene
23
2.1.3. Overexpression of isotope-labelled proteins
After the optimization of the best conditions to express FeoA protein in order to have the biggest amount possible while minimizing the use of expensive labelled reagents, it was time to overexpress FeoA both single 15N labelled and double labelled 13C/15N for NMR analysis.
The goal of this stage was to overexpress in large scale (mg) isotope-labelled FeoA for NMR studies, for structure determination requiring that our target protein be uniformly single 15N labelled and double labelled 13C/15N . This was accomplished by growing cell cultures in minimal media in which 15NH4Cl and 13C- Glucose were the only sources for nitrogen and carbon atoms.(22)
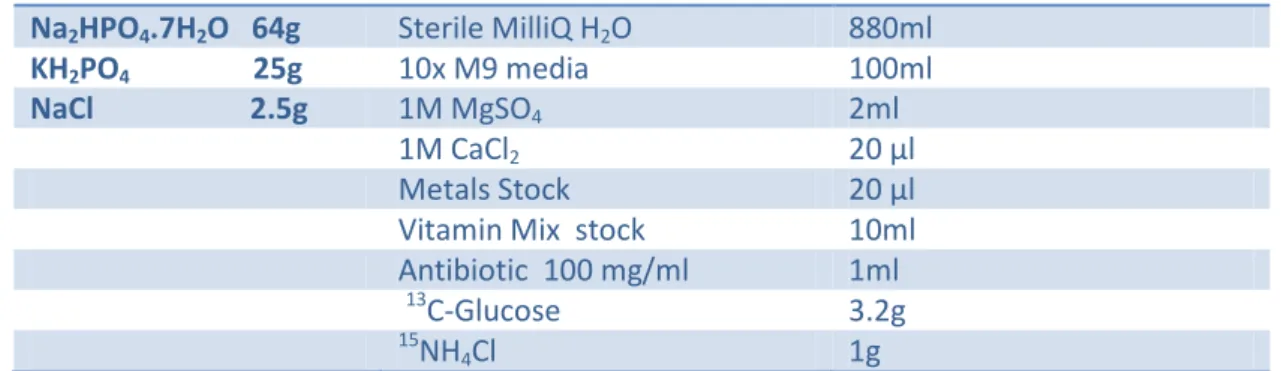
Minimal media is the most commonly used and cheap medium to overexpress isotope labelled proteins for NMR sample preparation. The minimal media is a mixture of M9 salts, glucose (as the sole carbon source) and ammonium chloride or ammonium sulphate (as the sole nitrogen source) that is formulated in either H2O or D2O depending on the size of the protein. Deuteration is necessary for proteins greater than 25kDa in order to simplify the spectra. Since FeoA is 8,4 kDa there is no need to use D2O in the growth media. Often, depending on the E.coli strain used, additional reagents, such as cofactors, are added to the media to enhance growth. In the case of BL21 (DE3) E.coli strain used the addition of vitamin mix and some metals were important for a better yield.
10X M9 Minimal
Media(1L) Media Composition (1Liter)
Na2HPO4.7H2O 64g Sterile MilliQ H2O 880ml
KH2PO4 25g 10x M9 media 100ml
NaCl 2.5g 1M MgSO4 2ml
1M CaCl2 20 µl
Metals Stock 20 µl
Vitamin Mix stock 10ml
Antibiotic 100 mg/ml 1ml
13
C-Glucose 3.2g
15
NH4Cl 1g
Table 1: Composition of the optimized M9 minimal media to express labelled FeoA protein.
24
Because of the lower nutritional content of minimal media, bacterial growth in it is often slow and sometimes irreproducible. In order to achieve higher cell densities and have faster and more reproducible growths, cells were first grown in rich media such as LB and then transferred to minimal media prior to induction.
2.1.4. Expression protocol
1-A pre-culture was prepared the night before by using 1ml of the glycerol stock of BL21 cells transformed with the FeoA containing plasmid, to inoculate 50 ml of LB medium containing 100µg/ml ampicillin. The culture was grown overnight at 37oC at 150 rpm.
2-The pre-culture was then used the next morning (after 16 hours) to inoculate a fresh LB medium (100µg/ml ampicillin). The cultures were then placed in a shaker at 37oC at 150 rpm.. The cells were grown until an OD 600nm 0.6-0.8 and were then collected by centrifugation at 8000 rpm at 25oC.
3-The cell pellet obtained was resuspended in M9 minimal medium of ½ LB volume and after 20 minutes at 25oC 90 rpm the induction started with the addition of 1 mM of IPTG and 150 µl of Iron(II)(150µM) . The OD600nm was used to monitor cell density and samples were taken each hour during the 4 hour induction period for analysis by SDS-PAGE.
4- After the 4 hours of induction the cell culture was subjected to another centrifugation at 8000 rpm at 4oC. The cell pellet was then stored at -80oC. to be used when there was a need to purify FeoA for NMR studies.
25 2.2.Purification
FeoA is a small protein of 75 amino acids with a molecular weigth of 8370.8 Da and the presence of only one cysteine residue at the C-terminal. It has a high isoelectric point (P.I.) of 9.4 making a purification step based on charge such as the cation exchange chromatography ideal to purify our target protein. Knowing that the majority of proteins have isoelectric points within the pH range of 5.5 to 7.5, at pH 7, the majority of proteins will have negative or even neutral charge, allowing for almost selective binding of FeoA to the cationic column. This was our strategy to capture the FeoA protein and separate it from the majority of contaminants. (23) A final step of size exclusion chromatography would then separate FeoA from the remaining contaminants.
2.2.1. Optimization of purification protocol
Cell lysis: Cells pellets were removed from -80oC and re-suspended in lysis buffer (50mM Tris pH 7.0, 150mM NaCl, 1mM PMSF plus protease inhibitor cocktail without EDTA - Roche). The use of reducing agents such as DTT (2mM) or B-Mercaptoetanol (2mM) in the lysis buffer was only present when reducing conditions were been explored while purifying FeoA protein.
Cell disruption was achieved by passing the solution three times in a large French Press at 1000 psi pressure at room temperature. The cell lysate was subjected to ultra-centrifugation at 50 000 rpm during 1 hour at 4oC on a Beckman TL100 ultracentrifuge.
Dialysis: After ultra-centrifugation the supernatant was collected and diluted with dialysis buffer (20mM Tris pH 7.0) in a 2X dilution and then transferred to a dialysis membrane (MWCO 3,5 kDa) and was kept overnight in 20mM Tris pH 7.0. The 1 liter buffer solution was changed 2 to 3 times in a period of 16 to 24 hours. The dialysis
26
solution also included reducing agents such as DTT (2mM) or B-Mercaptoetanol (2mM) when reducing conditions were necessary for the study of the protein.
Cationic exchange Chromatography: The target protein was purified by cation exchange chromatography on a 5 ml HiTrap SP FF column that was equilibrated with buffer A (20mM Tris pH 7.0) and eluted with a linear gradient (0- 25%) of buffer B (20Mm Tris pH 7.0 1M NaCl). The buffers also included reducing agents such as DTT (2mM) or B-Mercaptoetanol (2mM) when the elution behaviour of the protein was studied in non oxidative conditions.
The fractions containing the FeoA protein were always verified by SDS-PAGE.
Size Exclusion Chromatography: A second step of purification was also optimized. The FeoA fractions pooled together from the cation exchange chromatography were injected in the size exclusion column (Hi Load 16/60 Superdex 75 prep grade or Superdex 75) that was equilibrated with buffer A (20 mM Tris pH 7.0 2 mM DTT) with different salt concentrations (0-150 mM NaCl) to assess the best salt concentration in terms of protein stability.
Protein concentration: The final sample collected from the size exclusion chromatography was concentrated to produce a suitable NMR sample (0.6-1mM). The sample was concentrated using a 3kDa MWCO Vivaspin 15R device.
The concentration conditions were also optimized to reduce aggregation and degradation of the sample to achieve the highest possible protein concentration.
Protein concentration determination: The protein concentration was determined by absorbance at 280nm in the NaNo Drop 2000. The absorbance was measured after the auto-zero with the corresponding buffer solution (FeoA Extinction coefficient: 8 400).
27
2.3.NMR sample preparation and data collection
The final labelled protein samples had an average concentration in the range of 0.6-0.8 mM. This concentration was suitable for NMR analysis although higher concentrations (1mM) are always desired for structural studies.
The buffer used for NMR analysis as a composition of 20 mM Tris pH 7.0, 150 mM NaCl, 2mM DTT and 0.5 mM EDTA. In the final sample it was also added 10% D2O needed for signal lock.
Samples were loaded into a 5 mm NMR tube (NEWERA UL-5) and all the NMR data were recorded on an 800 MHz Bruker Avance III NMR spectrometer at 298K using a TXI Z axis gradient room temperature probe.
1
H 1D and 1H-15N-HSQC spectra were recorded with the single 15N labelled FeoA sample. The 13C/15N double labelled sample allowed us to record the HNCO, HN(CA)CO, HNCACB, HNcoCACB, 15N-TOCSY, hCCH-TOCSY, 1H-13C-HSQC, 15N-NOESY and 13C-NOESY spectra.
2.4 Data Processing and Analysis
Data collection and processing was done with Bruker´s TopSpin 2.1 software (Bruker Biospin). Both CARA 1.8.4.2 and CCPN 2.2.2 software were used to analyze the collected NMR spectra and to perform sequential assignment.
For structure determination it was used the CYANA, UNIO (ATNOS CANDID), RECOORD, DANGLE (h-bonds) and ECI (data submission) software.
28
3. Results and Discussion
3.1. Expression of FeoA protein3.1.1-Growth Curve
The growth curve of BL21 strain transformed with pET 21c (+) was used to decide the best induction point.
Figure 5: Growth curve of BL21 transformed with pET 21c(+).
The Growth Curve enabled us to determine the beginning of the exponential phase, when the cells are usually in their healthiest state. This stage corresponds in our BL21 strain to an OD600nm of around 0.6-0.8. This OD600nm was then used as the point to start the induction of FeoA expression in minimal media.
3.1.2- Best IPTG concentration
It is important to determine the best IPTG concentration in order to have an optimized expression of FeoA. The FeoA gene was inserted into the pET 21c(+) vector and transformed into a BL21(DE3) strain of cells. The pET manual states that for a pET construction carrying the T7/lac promoter such as the pET21c(+) needs a final concentration of 1mM of IPTG for full induction. This is only recommended if the plasmid was established in a DE3 strain such as our case.
0 0,5 1 1,5 2 2,5 3 3,5 4 0 5 10 15 20 25 OD 6 0 0 nm Hours
Growth Curve
Growth Curve29
3.1.3 –Time and temperature of induction
In Figure 6 it is shown the induction of FeoA expression in minimal media at different temperatures at 25oC and 37oC in a 4 hour induction period.
Figure 6: SDS-PAGE (Tris-Glycine 12.5%), A soluble/insoluble test, E. coli induced at 25°C. Lane 1: Marker. Lane 2-6: soluble fractions from 0 to 4h of induction. Lane 7-11: insoluble fractions from 0h to 4h of induction. B: Soluble/insoluble test. E. coli, induced at 37°C. Lane 1: Marker.Lane2-6 Soluble fractions from 0 to 4h of induction. Lane 7-11: Insoluble fraction from 0 to 4h of induction.
The induction of protein expression at 37oC decreases the solubility of FeoA protein since a significant part of the protein is localized in the insoluble fraction. The expression at low temperatures such as 25oC is needed in order for the majority of the protein to be soluble.
In Figure 7 it is shown the induction of FeoA protein at 25oC during an overnight period that lasted 16 hours.
30
Figure 7: SDS-PAGE (Tris-Tryc 12.5%), A soluble test, E. coli induced at 25°C for a16 hour period. Lane 1: Marker. Lane 2-6: soluble fractions from 0 to 16h of induction.
B: Insoluble test. E. coli, induced at 25oC for a 16 hour period. Lane 1: Marker. Lane 2-6 Insoluble fractions from 0h to 16 of induction.
The 16 hour period of induction of the FeoA expression leads to a degradation in the overall protein content. The FeoA protein is not present in the soluble or insoluble fraction.
The induction of FeoA expression during an overnight period posses not advantage in terms of amount of protein since the protein degrades.
The induction of FeoA expression has to be performed at 25ºoC and for a period of 4 hours.
3.2. Purification of FeoA protein
The purification results are divided in two parts: the first is related to the optimization of the best, most efficient purification scheme and the second part is related with the actual results of the purification protocol when applied to the various labelled forms of FeoA, such as single labelled 15N and double labelled 13C/15N.
31
3.2.1.Optimization of the purification scheme
The FeoA protein has a relatively high isoelectric point (pI) of 9.4 when compared to other proteins, making a purification step based on charge such as the ion exchange chromatography a perfect strategy to isolate our target protein.
For the ion exchange chromatography the choice of the pH value was very important not just to allow the most efficient purification but also to maintain the stability in solution of the protein.
At a pH below their isoelectric point such as pH 7.0, used in all the solutions, the FeoA protein will have a positive charge binding to a negatively charged medium or cation
exchange and this is our purification strategy for the first step.
The protein is then eluted with increasing ionic strength (NaCl in this case). Knowing that the majority of proteins have isoelectric points within the range of 5.5 to 7.5 this means that at pH 7 these proteins will not be able to bind the column allowing the separation of our target protein from critical contaminates such as proteases from the crude sample.(23)
Figure 8: SDS-PAGE ( Tris-Glyc 15%) of FeoA expression at 25oC. Soluble fractions
from hour 0 to hour 4.
The FeoA protein exists mainly in the soluble fraction of the cell extract as can be
seen on Figure 8. The supernatant solution contains our protein which is directly loaded into the column. To allow maximal binding of our target protein to the column
32
the supernatant solution is subjected to a dialysis procedure to lower the ionic strength and also to adjust the pH to similar values to that of the starting buffer. The elution of FeoA protein shows an interesting profile of three peaks (Figure 9), all proven to be our studied protein as verified by an SDS-PAGE analysis of the different peaks.
Figure 9: Cation exchange chromatography using a linear gradient of NaCl to elute the FeoA protein. The UV ( protein/blue) and conductivity (salt/red) traces show the elution of protein peaks and the changes in salt concentration during elution. An SDS-PAGE (Tris-Gly 15%) shows the presence of our target protein in the three peaks.
The elution profile of FeoA protein shows the existence of three peaks. These three peaks belong to the FeoA protein as was demonstrated by the SDS-PAGE analysis. These different forms of FeoA differ by charge since they elute at different salt concentration.
The columns used in this cation exchange chromatography (HiTrap SP 5ml) have some degree of resolution that allows them to separate proteins that differ by small charge differences.(23) Even if the differences shown by FeoA protein are minimal they will be detected by this columns.
These charges differences cannot be explained by the presence of one cystiene residue in the C-terminal of FeoA protein (Figure 10). The uses of high levels of B-Mercaptoetanol maintain this residue in their reduced form.
33
10 20 30 40 50 60
MQYTPDTAWK ITGFSREISP AYRQKLLSLG MLPGSSFNVV RVAPLGDPIH IETRRVSLVL
70
RKKDLALLEV EAVSC
Figure 10: The FeoA sequence from E.coli K12 strain.
In order to understand the nature of the different forms of FeoA protein a size exclusion chromatography was performed. The three peaks were injected into the size exclusion column, to observe if the difference could be related to different oligomeric states (Figure 11). The buffer used in the size exclusion is similar to the buffer used to elute the target protein, with the appropriate salt concentration (150mM NaCl).
34
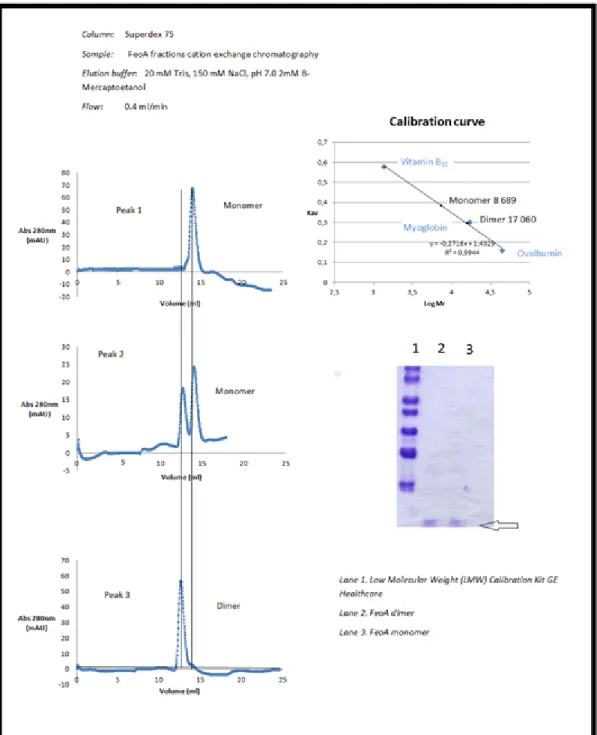
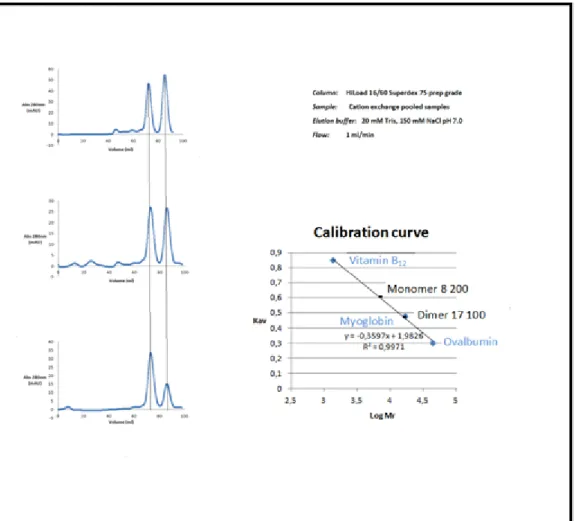
Figure 11:Size exclusion chromatography of the three peaks collected in the previous ion exchange chromatography, the corresponding SDS-PAGE (15%Tris-Gly) of the dimer and monomer fractions and the calibration curve of the Superdex 75 column.
The UV (protein/blue) trace show the elution of protein peaks during the chromatography.
With the use of the size exclusion technique we could see the existence of two oligomeric states of our target protein, a dimeric (17 060Da) and a monomeric state (8 689Da). The peak 1 seen in the chromatogram of cation exchange chromatography includes the monomeric state, the peak 3 the dimeric state and the peak 2 the simultaneous presence of dimer and monomer of FeoA protein. Even the relative
35
absorbance at 280 nm is higher in the peaks that contain the dimeric state such as the peak 2 and 3, in agreement with a larger concentration of protein on those fractions. The nature of the dimeric state is proven not to be related to the disulfide bonds mediated by the cysteine residues since the presence of high amounts of reducing agents excludes that hypothesis.
The nature of interaction of the FeoA homodimer could be related to electrostatic interactions, hydrophobic interactions or the simultaneous co-elution of a cofactor essential for the dimerization. It can be seen by size exclusion chromatography that the dimer and monomer forms are influenced by the overall protein concentration (Figure 12). The increase in total protein concentration favors the existence of the dimer form and the dilution favors the monomer state, although at not the same intensity.
Figure 12: Size exclusion chromatography of different solutions with different concentration and the calibration curve of the HiLoad 16/60 Superdex 75 prep
column. The UV (protein/blue) trace shows the elution of protein peaks during the
36
Proeminent form Concentration Area (Dimer)
mAU*ml Area (Monomer) mAU*ml Dimer 3.,2 mg/ml 144 38 Dimer/Monomer 0.8 mg/ml 48 39 Monomer 0.2 mg/ml 13 33
From this experiment it was verified that the concentration affects the overall proportion among the dimer and monomer.
Although the nature of the dimer and monomer is not understood it is clear from this experiment that the concentration plays a key role. The question then arose on why was it possible to isolate the different forms after the ion exchange in order to inject them in the gel-filtration (Figure 11).
The different forms were eluted at different protein and salt concentration in the ion exchange chromatography and those specific conditions allowed the isolation and stability of the different forms.
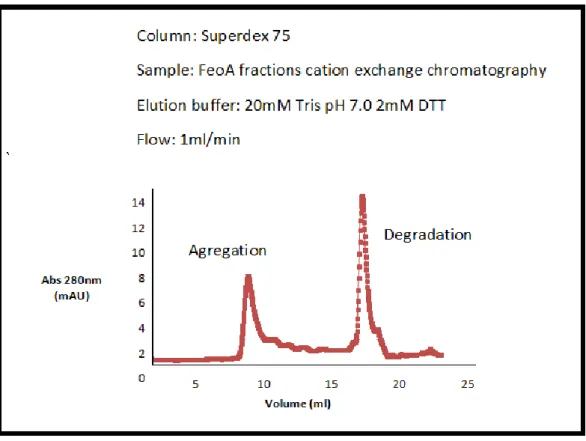
It is known that high salt concentrations favour hydrophobic interactions, which could be responsible for the dimer formation. By analyzing one more time the ion exchange chromatography (Figure 9) we verify that the dimer elutes at a greater concentration of NaCl (150mM) than the monomer (90mM). It was also performed a size exclusion chromatography with no NaCl present and there was no presence of dimer or monomer just aggregation and degradation of the sample. (Figure 13)
37
Figure 13: Size exclusion chromatography performed without the presence of salt.
The UV (protein/blue) trace shows the elution of protein peaks during the
chromatography.
Also the concentration of the FeoA protein in a buffer with no salt present showed aggregation and was not suitable for NMR analysis. All of this results determined that the solution should always include 150 mM of NaCl. The protein requires a certain salt concentration in order to be stable.
The isolation of the FeoA monomer was never possible since the process of protein concentration always produces a final sample were the dimer is the predominant form. The only sample produced for NMR with the monomer form was very diluted (10µM) due to degradation. (Preliminary results done by Meire Almeida)
The dissociation constant of the dimer was studied by gel-filtration, but it was never determined due to difficulties in analyzing the results at low protein concentration due to baseline problems.
By comparing the SDS-PAGE of FeoA protein after the cation exchange chromatography and the chromatogram of the size exclusion it is clear that the second purification step is crucial to eliminate remaining impurities (Figure 14).
38
Figure 14: Comparison between the SDS-PAGE (Tris/Gly 15%) after the cation exchange (A) and size exclusion (B) chromatography in terms of presence of impurities.
The SDS-PAGE of the FeoA samples after the cation exchange chromatography shows the co-elution of impurities together with our target protein and the separation of some of those impurities in the size exclusion chromatography.
Although samples of sufficiency purity were produced after the cation exchange chromatography, the gel filtration removed some of the impurities that lead to the protein degradation seen in preliminary NMR spectra (previous work done by Meire Almeida).
This SDS-PAGE and the preliminary NMR results proved the need for an extra purification step.
The NMR protein sample has to have a high level of purity, not just to allow the proper analysis of the NMR spectra but also because it increases the stability of the target protein for longer periods since it eliminates impurities that degrade or interact with our sample affecting the NMR analysis.
The previously used size exclusion chromatography can act as a polishing step to achieve final purity by removing the remaining traces of impurities and closely related proteins that affected the NMR analysis (30).
The use of this technique demandes the concentration of the sample prior to gel filtration in order to minimize sample volume and facilitate a rapid high resolution size separation.
Because of that, efforts were made to obtain a single peak in the cation exchange chromatography, that would translate in a more concentrated solution of FeoA and a lower volume to inject in the next purification step.
39
This was accomplished with one single change in the cation exchange protocol, the absence of reducing agent (Figure 15). This oxidative conditions created a single peak in opposition to the three peaks present at reducing conditions.
Figure 15: Comparison between the cation exchange chromatography performed in reducing conditions (2mM Mercaptoetanol) and at oxidative conditions (no B-Mercaptoetanol).
The optimization of the purification scheme allowed the production of a stable and pure FeoA sample. The cation exchange chromatography acted as a first capture step where the majority of impurities were eliminated. A second polishing step created a final sample with a high purity level that was the condition for the stability at long term of the protein sample.
40
With the optimization of the purification scheme and the evaluation of the best conditions to stabilize the purified protein the scheme was tested in a non labelled sample, to assess the overall reproducibility and protein yield.
In the Figure 16 it is shown the complete purification scheme for a non labelled sample and the final yield.
41 Unlabelled FeoA Concentration (mg/ml) Volume (ml) Concentration (mM) Protein yield (mg protein/LCulture) After Concentration 6,2 0.5 0.74 3,1
Figure 17: Final yield for a two liter culture necessary to achieve the necessary
protein concentration for NMR. The final volume of 500 µl is the final volume used in the NMR tubes.
3.2.2. Purification of the single labelled 15N and double 13C/15N labelled forms of
FeoA
With the optimization of the purification scheme complete, the production of isotopically labelled samples was achieved for further NMR analysis.
In figure 3.12 and 3.13 it is shown the purification results of the single labelled 15N and double labelled 13C/15N sample and the respective protein yield.
The purification results are shown not because the labelled proteins behave different from the non labelled, but to show the reproducibility of the purification scheme and the final protein yield.
42
Figure 18: Purification scheme of the single labelled 15NFeoA.
15N FeoA Concentration (mg/ml) Volume (ml) Concentration (mM) Protein yield (mg protein/L Culture) After Concentration 6.0 0.5 0.711 3.0
43
Figure 20: Purification of the double labelled 15N/13C FeoA.
15 N/13C FeoA Concentration (mg/ml) Volume (ml) Concentration (mM) Protein yield (mg protein/L Culture) After Concentration 5.4 0.5 0.64 2.7
44 3.3.- NMR data analysis
With the different protein samples produced for NMR we were able to learn more about our samples, their stability and the structure of the protein. Initial investigation of the samples was made with the use of 1D 1H and 2D 1H- 15N-HSQC spectra that were collected using the unlabelled and the 15N single labelled samples respectively.
First, we studied the sample stability using the non labelled sample for the initial steps of the optimization process due to its lower cost.
Figure 22 is showing the overlay of the 1H 1D spectrum at day one and day seven of a sample that remained at 25oC. The peaks overlay very well, proving that the conditions of the sample (buffer composition, salt concentration, pH value) are suitable for a long term NMR analysis such as a week period. Closer analysis of the amidic (HN) region (protons attached to the nitrogen atoms) shows that they are very well dispersed. This is a strong indication that the protein is folded and not denaturated. In addition the presence of peaks in the region between 4.7 and 6.5 ppm that are attributed to Hα protons was strongly indicative of the presence of beta sheet secondary structure in the protein, an observation that is consistent with models of feoA.