Data Mining and Visualization of Android
Usage Data
Departamento de Ciˆencia de Computadores Faculdade de Ciˆencias da Universidade do Porto
Albano Jos´
e Carvalho de Brito
Data Mining and Visualization of Android
Usage Data
Disserta¸c˜ao submetida `a Faculdade de Ciˆencias da
Universidade do Porto como parte dos requisitos para a obten¸c˜ao do grau de Mestre em Engenharia de Redes em Sistemas Inform´aticos
Orientador: Klaus Schaefers Co-orientador: Pedro Vasconcelos
Departamento de Ciˆencia de Computadores Faculdade de Ciˆencias da Universidade do Porto
I would like to thank all of the people who offered support and assistance during the writing of this dissertation. In particular, I would like to sincerely thank my supervisor, Mr. Klaus Schaefers, for guiding me through the dissertation as well as providing an opportunity to integrate a great work group, which contributed to a formidable experience to improve my skills. My gratitude also goes to Prof. Pedro Vasconcelos on his effort in proofreading this dissertation and his suggestions. The Fraunhofer staff was very helpful and provided me a great work environment. My family was also very supportive during the dissertation development I would like to express my heartfelt gratitude.
Abstract
Designing user interfaces is a challenging task, especially in the context of mobile applica-tions. The design process relies heavily on intuitions and speculations on how the users will interact with the application. As a result many applications do not fully meet the requirements and show severe shortcomings in terms of usability. Common design processes try therefore to increase the usability by iterating several design and test cycles. The main drawbacks of this approach are the cumbersome execution of the test cycles and the demanding analysis of the test results. This dissertation proposes a framework to automatically collect, store and process usage information from an Android application, to discover and display helpful knowledge based on the user intentions with the application. The system collects usage data and applies various statistical methods on the data, to offer a better insight to the user interface designers.
Desenvolver interfaces de utilizador ´e uma tarefa dif´ıcil, especialmente no contexto de aplica¸c˜oes m´oveis. O processo de design depende em grande parte nas intui¸c˜oes e especula¸c˜oes em como o utlizador ir´a interagir com a aplica¸c˜ao. Como resultado muitas aplica¸c˜oes n˜ao preenchem todos os requisitos e apresentam graves lacunas em usabilidade. Processos comuns de design tentam melhorar a usabilidade de forma interactiva, repetindo varios ciclos de testes e design. As principais desvantagens desta aproxima¸c˜ao s˜ao os pesados ciclos de execu¸c˜ao e a exigente an´alise dos resultados dos testes. Esta disserta¸c˜ao prop˜oe um sistema para automaticamente recolher, armazenar e processar informa¸c˜oes de utiliza¸c˜ao, para descobrir e exibir conhecimento ´util com base nas principais inten¸c˜oes do utilizador na aplica¸c˜ao. O sistema recolhe dados de utiliza¸c˜ao e aplica v´arios m´etodos sofisticados no conjunto de dados, para oferecer uma melhor vis˜ao aos designers de interfaces.
Contents
Resumo 5 List of Tables 8 List of Figures 10 1 Introduction 11 1.1 Background . . . 11 1.2 Problem Description . . . 11 1.3 Purpose . . . 12 1.4 Dissertation Organization . . . 132 Background and Related Work 14 2.1 Overview . . . 14
2.2 Human Computer Interaction . . . 14
2.2.1 User-Centered Design Process . . . 15
2.2.2 Task Analysis . . . 17
2.2.3 User Stereotypes . . . 18
2.3 Web Mining . . . 18
2.3.1 Web Data . . . 20
2.3.2 Web Structure Mining . . . 20
2.3.4 Web Usage Mining . . . 26
3 Design and Implementation 30 3.1 Overview . . . 30
3.2 Framework Architecture . . . 30
3.2.1 LDA Usage Data Model . . . 32
3.3 Android Application . . . 32
3.3.1 Data Collection and Preparation . . . 34
3.4 Modelling User Interests via Clustering . . . 35
3.4.1 Measuring Similarity of Interest for Clustering Users . . . 35
3.4.2 Right Number of Clusters . . . 38
3.5 Finding User Access Patterns via LDA . . . 39
3.5.1 Compute LDA Inference via Gibbs Sampling . . . 40
3.5.2 LDA implementation via Gibbs Sampling . . . 41
4 Results and Evaluation 43 4.1 Overview . . . 43
4.2 User Interests via Clustering . . . 44
4.3 User Access Patterns via LDA . . . 49
5 Conclusion and Future Work 53 5.1 Future Work . . . 54
A Acronyms 55
References 56
List of Tables
3.1 Database: Event Structure . . . 34
3.2 Database: Session Structure . . . 34
3.3 Database: Widget Structure . . . 35
3.4 Database: User Structure . . . 35
3.5 LDA Variables Definition . . . 40
2.1 User-Centered Design Process. . . 16
2.2 Taxonomy of Web Mining and objects. . . 19
2.3 Apache Web Access Log. . . 20
2.4 Latent Dirichlet Allocation intuitions. . . 23
2.5 LDA generative Process. . . 25
2.6 Processing Web usage data. . . 27
3.1 CSV file example. . . 31
3.2 Android Application, memory game screenshots. . . 33
3.3 User Actions representation and vector structure. . . 36
3.4 Similarity measures based on the similarity equations. . . 38
3.5 Clustering result with users and the usage vector. . . 38
4.1 Widget transition map. . . 45
4.2 Widgets usage frequency. . . 45
4.3 Time spent in each screen. . . 46
4.4 Application two uses cases schema . . . 47
4.5 Cluster result without framework interpretation (two topics). . . 48
4.6 Cluster result with framework interpretation (two topics). . . 48
4.7 LDA result. Use case one, with two topics without the framework interpretation. 50 4.8 LDA result, uses cases, two topics with the framework. . . 50
4.9 Purity for top k widgets. . . 52
Introduction
1.1
Background
Developing software applications is an important task which is now more in demand than ever before. Every day we interact with many software applications. The number of mobile applications has grown in recent years, requiring the exploration of problems and issues related to usability. The main concern of the software developer is to release the application quickly, and sometimes his perspective forgets the target of those applications, the users who will interact with it. If their result is not user friendly the final product does not fulfill expectations. One typical shortcoming is in the user interface. The user interface is the “door” to the system, which needs to be well analyzed and developed to overcome usage shortcomings. Consequently, designing user friendly interfaces is one desirable goal to separate from the functional design. Without previous information about interface usage, the designer does not know what will be the best way to build the user interface. The interface must be usable to avoid mistakes and provide usage satisfaction. User interface design needs to be studied and understood, given it is a crucial factor for the application’s success.
1.2
Problem Description
The success and acceptance of the application depends, as a starting point, on the designer’s experience and intuition. The designer starts building the user interface based on their sup-positions or related researches, but they cannot really anticipate how users will perceive and use their application’s interface to perform tasks. As a result, it is common for applications to not fulfill the user requirements and to exhibit severe usability shortcomings due to the designer not having real feedback to evaluate the usage of the interface. To deal with the
CHAPTER 1. INTRODUCTION 12
above problem, it is necessary to discover an objective set of measures which represents the user interactions and requirements with the interface. Taking these measures from real interactions with the application, would help designers build a better user-friendly interface. In other words, the main concern is to put the user behavior insight into interface designers. This provides designers with a set of real information which can be interpreted to avoid shortcomings in usability.
Usually, human analysis is used to reveal valuable information about the interface usage. Human analysis presents a series of limitations. The recovered information is subjective and cumbersome to analyze if the size of the collected data is large. To overcome this problem of human analysis, we developed a framework to automatically and impartially reveal information about interface usage.
A related working problem is the potentiality large size of data collected from the application usage. Therefore performance and scalability are essential requirements. We propose Map-reduce1frameworks like Apache Hadoop2 to meet the scalability requirements.
1.3
Purpose
The aim of this dissertation is to extend an existing Usage Mining framework, FUSAMI3
developed by Fraunhofer Portugal with additional Data Mining algorithms and to develop appealing visualizations for the discovered information (use cases) from the real usage of an real Android mobile application. This dissertation exposes the implementation from scratch, adaptation and testing of an existing algorithm called Latent Dirichlet Allocation (LDA) used in Text Mining (Blei et al., 2003). This algorithm was previously adapted by (Xu et al.,2010) to a Usage Mining context to discover the hidden set of important tasks (use cases4) from the World Wide Web (Web) usage. In this dissertation the LDA algorithm was adapted to the context of an Android application usage following the principles described in (Xu et al.,2010). To help the computation of the LDA algorithm, some methods used in clustering analysis were included as a support.
The case study was a memory game application, for which real usage logs were collected and applied the following steps:
1. read the logs from the database;
2. process the logs into appropriate data structures;
1MapReduce is a programming model for processing large data sets. 2
Apache Hadoop is an open source framework that supports data-intensive distributed applications.
3
The Fraunhofer Usage Mining (FUSAMI) system offers Android developers and Human Computer Interaction (HCI) specialists a web based platform to perform advanced analytics on realtime usage data. The system helps developers to get a better insight into the user interaction and to unveil usability issues.
4
3. run the Data Mining algorithms;
4. interpret and present the obtained results.
During the implementation, the Data Mining method suffered various modifications. Some algorithm stages represent a computational challenge. To deal with the difficulty to com-pute those stages, some other techniques used typically on Web Mining were used. These modifications will be further described in Chapter 3.
1.4
Dissertation Organization
The remaining of this dissertation is structured into four chapters:
Chapter 2 presents background on Data Mining algorithms and related work.
Chapter 3 describe the methods implemented as well the computational solutions adopted to overcome the associated difficulties.
Chapter 4 presents and interprets the results obtained.
Finally, the Chapter 5 discusses this work and its contribution, identifying a range of the issues that can be object of future work.
Chapter 2
Background and Related Work
2.1
Overview
This chapter introduces the relevant technologies and principles on Web Mining that form the main guidelines of this dissertation and the main concepts in Human Computer Interaction (HCI). The first section describes the issues on HCI and presents the usability concept. Furthermore, the topics on application design from the perspective of user and task are presented. The next section presents a brief description of Web Mining and how those techniques can help in this dissertation. Besides, some methods which are used to overcome some computational stages will be closely presented (Xu et al.,2010).
2.2
Human Computer Interaction
HCI is an interdisciplinary area (Majlinda Fetaji,2007;Lester,2008;Schmid,2005). There are many definitions of the area, but is considered a well-known area focused on issues concerning the interaction between users and computers. (Hewett and Verplank, 1996) defines HCI as follows “Human-computer interaction is a discipline concerned with the design, evaluation and implementation of interactive computing systems for human use and with the study of major phenomena surrounding them”. (Preece and Carey, 1994) defines HCI as “the discipline of designing, evaluating and implementing interactive computer systems for human use, as well the study of major phenomena surrounding this discipline” and (Alan J. Dix, 1998) defines HCI as “HCI involves the design implementation and evaluation of interactive systems in the context of the users task and work”.
Usually user interactions occurs in the application interface. The interface is a cru-cial component that influences the efficiency and quality of usage between users and the application (Majlinda Fetaji, 2007). Usability is normally the measure used to determine
the efficiency of the interface. HCI proposes some concepts like those mentioned in ( Ma-jlinda Fetaji,2007) to develop applications and avoid possible mistakes in design and provide higher levels of the usability.
According to (Alan J. Dix,1998;Myers,1994;Majlinda Fetaji,2007) we can determine the typical topics of HCI on applications design focused in the interface design:
• the user;
• the task which the user wants to do;
• the interfaces used by users to carry out these tasks
In the rest of this section we will describe the application design process, the definition of the above typical keys of HCI and how they are related with the design process to improve applications usability.
2.2.1 User-Centered Design Process
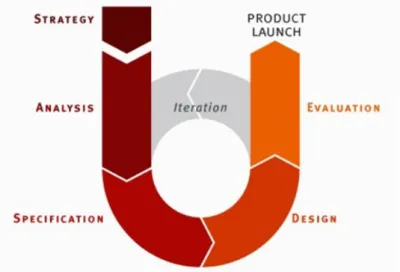
When an application designer starts building an application, he needs to have in mind a series of steps, rules, and requirements to accomplish his work. Building an application is not only getting the application working, but also creating a friendly process for users to perform tasks and communicate with the application. Missing the user’s perspective on the interface can cause application to flop when it is launched. Users are the focus when an interface is developed. Furthermore, users employ the interface to do a series of tasks which is another important goal. So, when an application is developed the source code is an important goal, but also the development process to design the interface. The next definition presents the goals on user interface design process. “User-Centered Design (UCD) is a user interface design process that focuses on usability goals, user characteristics, environment, tasks, and workflow in the design of an interface. UCD follows a series of well-defined methods and techniques for analysis, design, and evaluation of mainstream hardware, software, and web interfaces. The UCD process is an iterative process, where design and evaluation steps are built in from the first stage of projects, through implementation” (Henry, 2004). Based in the previous definition, which in my opinion better represents the basic concepts on user interface design process, we can infer the topics to the UCD process, Figure 2.1 exposes the main topicsSA (2012): Strategy, Analysis, Specification, Design and Evaluation.
CHAPTER 2. BACKGROUND AND RELATED WORK 16
Figure 2.1: User-Centered Design Process.
As in every process, UCD follows a series of different stages, defined as:
1. The first stage of the design process is to define the main strategies of the problem, the application objectives. Some problems happen because the objectives are not clear. When we know what we really want to do, we must contextualize our product, in terms of users and business for it to be a viable application.
2. After we defined the application objectives in the last stage, we need to analyze the users and the application’s functionalities (tasks). Determining user characterizations (usually denominated by personas, the concept is introduced in the Section 2.2.3) and relating to the actual work in order to understand the user’s requirements when they want accomplish this type of tasks. Also, it is necessary determine the set of actions for users to perform the tasks.
3. When the application specification is finished and users and tasks are accommodated (user characterizations by requirements and actions set based in personas requirements determined). The next step is to design a functional prototype to start testing the application.
4. When the prototype is designed it is essential to perform tests to evaluate the work. Performing appropriated HCI tests is important to measure the usability and determine if the application can be launched or needs to be improved.
The process described in the last four steps is the description of the stages of the UCD process presented in the Figure 2.1. Usually the problems on the design development happen when the designers forget the user and task perspective and focus only on getting ”things” working. Different users have special requirements (Blomkvist, 2002); we are different and
do things differently. Besides, the sequence of steps to accomplish tasks is different from one user to another (Blomkvist,2002). When an application is designed, those requirements need to be determined to create applications and overcome the constraints in design and usability.
2.2.2 Task Analysis
Task analysis is a very important technique to determine how users perform their actions in the application. In other words, it reveals the set of actions employed to accomplish the task or set of tasks with recourse to the application interface (Abe Crystal,2004). The aim is to determine what users do, which things they use and the order in which they use them. The main idea is to know how users understand and communicate with the application’s interface. If the designer can predict user behavior or understand their requirements, he can try to anticipate the user’s problems with the tasks or determine the most used steps. This helps to better adapt the tasks around users and solve the most common problems in task design. An example, in Photoshop the usual and simplest set of tasks is more accessible. These accessible tasks have an important impact on usability, because they provide beginner and advanced users with an advantage without interfering between them. To do that, we need to explore the user behavior to determine common actions. Besides, determining the time spent learning a task is a useful measurement for task analysis to create a prediction of time necessary for users to learn a task.
Furthermore, task analysis typically presents two different levels of analysis, depending on the research purpose. The complete set of actions presented as a single big task, or breaking the task into small subtasks. These two approaches are useful to determine the user behavior. If a user made a mistake, we can try to locate that mistake and understand why this happened and solve or overcome it in some other way. Otherwise users may have a pattern to do some tasks, that pattern may represent how users like to do a task. That pattern can be very useful to try to apply into other related applications (Crandall et al., 2006). The idea is to adapt the task as much as possible in friendly steps that allow users to easily do their work without any mistakes and frustration. A simple interpretation of this scenario is identifying the use cases behind the usage of the application, which can be helpful to determine the type of user, beginner or advanced, providing different usage which sometimes can be helpful.
Avoiding user frustration in one application is essential, which can have immediate impact on terms of usability. The essential problem is to understand users and relate them. Users are different and do things differently. One cultural example could be the different sides of writing. Build an application which combine all friendly steps to users do tasks, is complicated due the big space of different possibilities (Crandall et al., 2006).In the next section the user requirements are described.
CHAPTER 2. BACKGROUND AND RELATED WORK 18
2.2.3 User Stereotypes
Application designers need to know their type of users and their specific requirements to combine them into an application. Every user is unique and has a different perspective on the world, how they do things and also understand their surroundings (Blomkvist, 2002). The more diverse a user group is, the more difficult relate their need is, which is crucial for software developers. If they want their applications to succeed, it is necessary to classify the users, the target of the application by specific requirements and try to build the application around those requirements. The logic tells to make a prototype to accommodate the most users as possible. The best way to successfully accommodate a huge variety of users without usage frustration is to design for specific types of users with specific requirements, specific applications for their requirements.
The typical form to call user groups with specific user stereotypes is personas. (Blomkvist, 2002) define a persona as a model of a functional user that represents the individual’s goals when using any kind of application. In other words, pick the main characteristics (patterns, goals or motives) that are most representative of a group and translate them into a persona characterization to make the persona more “tangible and alive” for the development team (Blomkvist,2002).
Errors are never something good, but if they happen, it is very important and useful to inform, help and teach the users to recover their work. The frustration that ensues if the work is lost by an error influences the user experience, the work productivity decrease, besides on user satisfaction which influences the usability of the application. Personas classification helps the designers, to adapt the system around the specific group of users to best choose the friendly way to overcome if an error happens.
To determine personas, one simple form to classify users is with questionnaires, and use the answers for clustering users into groups of behaviors. This is a cumbersome and slow process, it is necessary to have other approaches to do the clustering. One efficient and usual approach is to analyze users by the actions taken into usage sessions and with those usage sessions, clustering algorithms can be applied to relate the users into groups.
2.3
Web Mining
Nowadays, with the huge amount of information available, the World Wide Web (Web), is a popular and interactive medium to disseminate information. However, the Web is huge, diverse and dynamic (Xu et al., 2010). Because of that, the Web has attracted more and more attention from Data Mining researchers. Providing a growing base of great and varied techniques on knowledge discovery. Due that and the research context adopted, we use the Web context as a support to assist this dissertation. Besides, the process to collect and process data it is similar in many cases.
Data Mining basically refers to extracting informative knowledge from a large amount of data, which could be expressed in different data types. The main purpose of Data Mining is to discover hidden or unseen knowledge from data repositories. In the Web, Web Mining can be broadly defined as the discovery and analysis of useful knowledge from the Web repositories, with recourse to Data Mining techniques (Liu,2011).
As mentioned above, the Web is a huge data repository consisting of a variety of heterogeneous data types. To deal with the variety of heterogeneous data types, Web Mining can be categorized into three types (Xu et al.,2010):
1. Web structure mining, find out knowledge from hyperlinks, the Web structure;
2. Web content mining, determine useful knowledge from Web page contents;
3. Web usage mining, extract user actions patterns from usage Web logs of interactions between users and Web systems.
Figure 2.2 presents a Taxonomy of the Web Mining (da Costa and Gong,2005).
Figure 2.2: Taxonomy of Web Mining and objects.
The Web Mining process is very similar to the Data Mining process. The main difference usually is in the data collection. In traditional Data Mining, the data is collected and stored in a Data Warehouse. On Web Mining, collecting the data can be complicated, due to the huge and dynamic content of information to be stored. The usual way to store the information from the Web is with recourse to logs (Xu et al.,2010).
CHAPTER 2. BACKGROUND AND RELATED WORK 20
2.3.1 Web Data
The aim of Web Mining is to extract knowledge from the Web, through log analysis (Xu et al., 2010). But to analyze, first it is necessary to know what type of data it is. In the previous Section 2.2 we present Web Mining decomposed into three types, for each type the used data:
• Web content uses text, image, records, etc;
• Web structure uses hyperlinks, tags, etc;
• Web usage uses HTTP logs, App server logs, request type (GET, POST), etc.
Every time a request is made for content, an event representing that request is stored with all relevant informations such, contents, time stamps, hyperlinks or user session infor-mation’s. Traditionally the information is collected into server logs (Xu et al.,2010),by the server or other service on the Web. Figure 2.3 presents an example of a server log (Liu, 2011).
Figure 2.3: Apache Web Access Log.
2.3.2 Web Structure Mining
The goal of Web Structure Mining is to determine a structural summary about the topology hyperlinks at inter-document level of the Web. The Web is full of links, each site is usually represented by a sequence of structured links to pages, and each page is connected to other different pages.
The Web contains a variety of the objects with almost no unifying structure, with content differences much greater than in the traditional collections of text documents. With several billions of Web pages created by billions of authors or organizations, under a huge diversity of themes, the Web is the great source of information and a challenging area of researches to deal with massive quantities of data.
With Web structure researches could be discovered communities of users who share common interest or behaviors on access pages. Another approach is the bibliographic references, it is possible to directly reference from the content sources (Liu, 2011). With this perspective we can recover much information about Web sites schema and the Internet itself. This area keeps growing and new methods appear almost every day to solve the problems to determine the schemas or preferences around the Web pages.
2.3.3 Web Content Mining
In the Web there exists a huge variety of content, billions of HTML documents, pictures, and multimedia files, among others. The number is constantly rising and the content changing. The Web presents to users an opportunity to access information in almost every place. The aim of Web Content Mining is to discover information from the content of the Web pages itself, but considering the impressive variety of the Web contents, retrieving interesting content is challenging (Liu,2011).
Most documents on the Web are for human consumption, making it important to use methods to understand the main topics on the text. Natural Language processing (NLP) is the natural field concerned into interactions between computers and human languages to understand the contents and help to classify Web pages by their main topics (Pol et al.,2008; Yucong Duan,2011). Furthermore, it can help discover patterns on Web contents which can be useful.
Topic Modelling
Given the huge content on the Web, large quantity of data needs to be explored to retrieve information. Topic modeling techniques provide a way to uncover the semantic structure from large sets of documents (Xu et al., 2010). Effectively extracting valuable knowledge requires methods for interacting with documents to explore their content based on mixtures of topics and navigating to other similar documents. The same process happens with the Web pages (Xu et al.,2010).
A topic consists of a cluster of words that frequently occur together. The main idea is to represent a page or document of text as a mixture of topics and a topic as a distribution of words. Through contextual rules or clues, topic models can link words with similar meanings and differentiate uses of words with multiple meanings. This schema can be applied to many fields of study with appropriate types of data, to recover information about the semantic
CHAPTER 2. BACKGROUND AND RELATED WORK 22
contents of documents (Xu et al.,2010). One common example is Web crawlers, when a user makes queries; to allow effective extraction of topics from a large amount of Web contents.
The probabilistic model uses the same principle of generative models1to extract latent topic with in text corpus based on hierarchical Bayesian analysis2 (Heinrich,2004;Allenby and McCulloch, 2005). Probabilistic latent semantic analysis (PLSA) or Latent Dirichlet Allocation (LDA) (Blei et al.,2003) are examples of statistical topic models, LDA is closely related to PLSA. In the next section we describe the LDA structure and the algorithms for inference and estimation for extracting topics.
Latent Dirichlet Allocation
Probabilistic topic models are algorithms which aim to discover the hidden thematic struc-ture in sets of documents. Latent Dirichlet Allocation (LDA) is a three-level hierarchical Bayesian model, which for each document on a document collection is represented by a mixture of underlying set of topics (Blei et al.,2003). Typically documents are represented as a “bag of words” where the order of words in the document does not matter, as they occur independently (Xu et al.,2010;Blei et al.,2003).
The LDA’s intent is to capture the underlying relations between words and group them into “topics” to try identify the content of this documents (Xu et al., 2010). Figure 2.4 shows the typical document distribution of topics and a distribution of words for each topic ( the word probability importance for each topic and a word frequency distribution in the document ) (Blei et al.,2003).
Given the LDA assumptions, an initial starting point on LDA is a limitation of topic models, the word independence in the documents (Xu et al.,2010). Topic models like LDA fail to directly model correlation between topics, because it is natural to assume that some subsets of the hidden topics will be highly correlated. A simple example is one article about computer virus. It can also be related to medicine, because virus is shared by both. Limitations of the LDA model stem from the independent assumptions implicit in Dirichlet distributions, that one topic is not correlated with the existence of another (Xu et al.,2010). The LDA model is highly modular and easily extended to other modeling relations between topics by using another distribution instead of Dirichlet, and we can overcome this limitation with another, more appropriate distribution.
Given some number of topics, which are distributions over words, each word have the relevance probability on that topic (Figure 2.4,left). Each document is modelled by:
1. first choosing a distribution over the topics (Figure 2.4 histogram, right);
1
Generative model is a model for randomly generating observable data.
2
Hierarchical Bayes models are hierarchical models analyzed using Bayeisan methods. Bayesian methods are based on the assumption that probability is operationalized as a degree of belief, and not a frequency as is done in classical, or frequentist, statistics(Allenby and McCulloch,2005).
2. for each word, choose a topic assignment (Figure 2.4, coloured coins) and choose the word from the corresponding topic.
Figure 2.4: Latent Dirichlet Allocation intuitions.
Mixture Modelling
LDA uses the principles of a mixture modelling, which uses a convex combination3 of words (Heinrich, 2004). A convex combination assumes a weighted sum of coefficients equals one. On NLP one way to treat the contributions of different topics to a document is to take the probability distribution over words, viewing the document as a probabilistic mixture of the topics. The probability of one word w in a document with K topics is given by
p(w) =X
k
p(w|z = k)p(z = k),X
k
p(z = k) = 1 (2.1)
where a mixture component p(w|z = k) is a multinomial distribution which corresponds to the word w under the k topic in the document (Griffiths and Steyvers, 2004). P (z = k) returns the probability to choose a word from topic k in the document. The main principles on LDA inference can be described like:
1. term distribution p(w|z = k) = φ for each topic which indicates what words are important to a topic;
3
CHAPTER 2. BACKGROUND AND RELATED WORK 24
2. topic distribution p(z|d = m) = Θm for each document m, represents how this topic is
important to the document.
The parameters φ and θ are the main goals for latent semantic representation of words and documents. LDA combines equation (2.1) with a prior probability distribution to provide a generative model, to derive an inference strategy (Griffiths and Steyvers, 2004; Heinrich, 2004).
Generative Model
LDA is introduced by combining the generative models to derive an inference strategy, with a prior probability on topics to provide a complete generative model for documents. The idea of LDA is that documents are modeled as random mixtures over latent topics with a probability distribution, where each topic is represented by a distribution over the words vocabulary (Xu et al.,2010).
LDA takes a single multinomial variable β (beta) for each topic Z, β defines the probability for a word given a topic P (w|z) into all documents, the corpus (Xu et al.,2010). A mixture of topics for each document is defined by the variable θ. The generation of words for each document involves two steps (Xu et al.,2010):
• select a hidden topic, z from a multinomial distribution defined by θ;
• for the selected topic z, a term w is draw from the multinomial distribution with parameter βz.
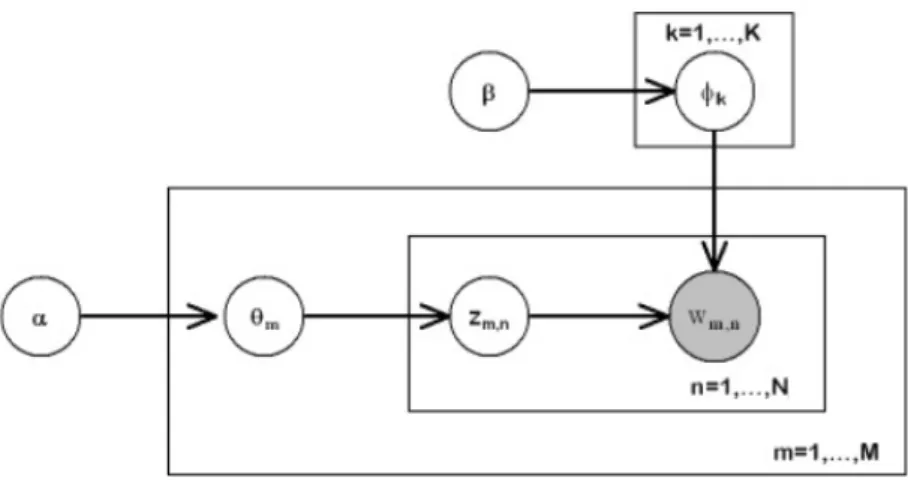
The generative model for LDA can be described more detailed as follows or in Figure 2.5 (Ni et al.,2012;Xu et al.,2010):
1. For each topic z = 1,· · ·, K choose W dimensional φz ∼ Dirichlet (β)
2. For each document d = 1,· · ·,M choose K dimensional θ ∼ Dirichlet (α)
For each position i = 1,· · ·, Nd
• Choose a topic Zi ∼ Multinomial (θd)
• Generate a term Wi ∼ Multinomial (φzi)
In this generative process the hyper parameters α and β are given as input, specifying the nature of the priority on φ and θ. The process of inference in LDA involves a joint
probability distribution over the observed data and hidden variables. Data analysis use a joint distribution to compute the conditional distribution of the hidden variables given the observed (Xu et al., 2010). The calculation of the conditional distribution of the hidden variables for a document is given by (Xu et al.,2010):
P = (θm, zm,n|wm,n, α, β) =
P = (θm, zm,n, wm,n|α, β)
P (wm,n|α, β)
(2.2)
Unfortunately, conditional distribution Equation (2.2) is computationally intractable to compute directly to determine an exact inference, the denominator sum does not factorize and involves Kn terms, where n is the total number of words in the document (Griffiths
and Steyvers, 2004). Due to the problems to compute exact inference of the coupling the latent topics and the mixing vectors β, θ. Several techniques have been proposed to approximate the inference, Laplace approximation, expectation propagation, Markov Chain Monte Carlo(MCMC), variational inference, etc. Gibbs sampling is a special case of MCMC for approximate inference (Teh et al.,2006). The last method provides a series of equations (Heinrich,2004) to deal with the generative process. In the Section 3.5.2, the Gibbs sampling approach will be carefully described, because that equations were adopted in this dissertation to compute the inference.
Figure 2.5: LDA generative Process.
Optimal Number of LDA topics
In the previous section the LDA algorithm is described. Our main LDA assumption is that all parameters are assumed to be known. One of the difficulties of the LDA techniques is finding the right assignment of topics to optimize the topic distribution; the answer to this question remains open (Arun et al.,2010). Choosing a different number of topics than what is expected produces different associations. The idea is to determine the best topics
CHAPTER 2. BACKGROUND AND RELATED WORK 26
association on the data (the best distribution).
Many approaches were proposed to solve this question, Hierarchical Dirichlet Process (HDP) (Arun et al., 2010). Another method proposes finding the right number of topics by measuring the change in the average cosine distance between topics when the number of topics increases in an adequated range of values (Grant and Cordy,2010).
In (Grant and Cordy,2010)a way to determine the number of topics is described, by presenting two metrics which can be used to estimate the relationships in documents. The first step is to use a vector space model in a way to identify the related documents. If the document is represented by a vector with k elements in a model with k topics the most relevant nearest neighbors are discovered by cosine distance in the vector. The second is to explore the locality to determine the relevance and run some samples to identity the topics values which best fit the data (Grant and Cordy, 2010). This approach will be used to determine the optimal number of topics in the Chapter 3.
2.3.4 Web Usage Mining
The last Web Mining types, describe mining techniques performed on the Web page itself, in the perspective of their content and structure. This section will be focused on the navigational behavior performed by the users on Web pages(Xu et al.,2010).
The Web Usage Mining goal is to capture, model, and analyze the behavioral patterns and profiles of users who interact with Web pages by browsing. The discovered patterns are usually represented as collections of pages, objects or resources that are maybe frequently accessed or used by one user or groups of users with common needs or interests. This allows discovering some interesting similar measures from users and accessed pages (Xu et al.,2010). The communication between a user (Client) and resources (Server) is normally stored into server logs, the useful navigational behavior is to posteriorly be extracted from those server logs, i.e. the user history. However, before analyzing the data, Web log files need to be cleaned or filtered, to eliminate outliers or maybe irrelevant items. The resulting information is clustered into an individual access page with unit measures, or sessions with only the relevant information. After the data is compiled into a useful structure, behavior patterns can be found and interpreted, through some Data Mining techniques such as association rules, path analysis, sequential analysis, clustering and classification.
Normally the Web usage mining process is described into three typical phases: prepro-cessing, pattern discovery, and pattern analysis (Srivastava et al., 2000; Liu, 2011).Figure 2.6 presents the Web usage mining process with the tree phases (Liu,2011).
Data Processing
Data Processing consists in converting the information of usage, content and structure stored in data logs repositories into data abstractions for pattern discovery process, as in Figure
Figure 2.6: Processing Web usage data.
2.6. Data Processing represents the difficult task in Web Usage Mining normally because the content, Hyperlinks, texts, user information, media contents to be processed is huge if the analysis is made by demographic intentions.
Pattern Discovery
Pattern Discovery is the key part of the Web usage mining. Converging the algorithms and techniques from several research areas, such as Data Mining, Machine Learning, Statistics, Artificial Intelligence and Pattern Recognition. The main areas of Pattern Discovery will be introduced as follows:
• Statistical Analysis
Statistical techniques are the most common way to extract useful knowledge about the Web pages visitors. By analyzing the logs of sessions can perform different kinds of descriptive statistical analysis, like frequency, mean, median, variance among others. Furthermore the navigational path length, and time spent (Cooley,2000).
• Association Rules
Association rules can be used to relate pages that are most often referenced together in a single session. Association Rules Mining (ARM) are techniques which can be used to discover correlation among the data logs, using a predefined threshold for support and confidence. Typically an ARM is the implication in the form X→Y where X and Y are items (pages) (Tan et al.,2006).
CHAPTER 2. BACKGROUND AND RELATED WORK 28
provides one way to estimate the conditional probability of Y given X. We understand in the rule like X→Y the most higher confidence is, the more likely it is for the action Y to be present in a session that contains action X, making the set of actions a possible pattern. The most well-known method to calculate the association rules is using the Apriori algorithm (Agrawal and Srikant,1994).
• Clustering
Clustering is a Data Mining technique to group together a set of data items (pages) into groups of similar characteristics. Clustering of users will help discover the group of users that has similar navigation patterns. This allows differentiating users through their navigational path or sessions and helps discover demographic interests which allow Web personalization or Web analysis.
One classical approach to clustering is K-means, this algorithm assumes that given a number of k clusters fixed iterate over the data to group the items in the given k groups (Kanungo et al.,2002).
• Classification
Classification tries to map a set of items into one of several predefined classes (Fayyad et al., 1996). In the Web, this is a useful technique, to establish a users profile belonging to a particular class or category based on their different requirements. This requires extraction and selection of characteristic that best match with the properties of a class or category.
User classification can be performed by algorithms such as decision tree classifiers, na¨ıve Bayesian classifiers, k-nearest neighbour classifier, Support Vector Machines among others (Xu et al.,2010).
• Sequential Patterns
Sequential pattern mining tries to find all sub-sequences that appear frequently between occurrences of sequential events in a data set, , with the purpose of determining if there is any specific order (Mannila et al., 1995). Sequential pattern mining is widely used in analysis of the DNA sequence (Xu et al.,2010).
• Dependency Modelling
The main objective of this technique is to establish a model that is able to represent significant dependencies among the various variables involved. The modelling technique
provides a way for analyzing the behavior of users, and is potentially useful for predicting future Web resource consumption (Srivastava, Cooley, Deshpande, and Tan,2000).
Pattern Analysis
Pattern Analysis is the final stage of Web Usage Mining. The final stage’s goal is to eliminate the irrelevant rules or patterns from the pattern discovery process. Also, storing and organizing the information to be displayed for human consumption. SQL databases are one of the most used ways to store the recovered information (Srivastava et al.,2000).
Chapter 3
Design and Implementation
3.1
Overview
This chapter describes the design and implementation of the LDA algorithm that has been used in this dissertation, as well as the methods and assumptions used to overcome the computational requirements to run the algorithm.
Furthermore, in this chapter the two main approaches (clustering and LDA algorithm) and data structures to determine the user interests and patterns from a user usage of an Android Application will be presented. As mentioned in the introduction of this work was conducted based on the approach of (Xu et al.,2010) to determine the main usage patterns (use cases).
3.2
Framework Architecture
All the methods and the algorithm used in this dissertation were implemented in Java, because the dissertation’s purpose was to extend an existing framework, FUSAMI, which was also developed on Java. Javadocs1 was adopted to generate appropriate documentation for the algorithms and methods to be easily understood and for posterior maintenance.
To run the algorithm and methods, the data was converted in a comma-separated values (CSV) file. This file was used to simply be a representation of the usage data in plain text. The CSV file is a combination of user IDs and events IDs (widgets IDs), which represents the user actions in their sessions using the application. The CSV file also helps to easily adapt the data if any changes or adding new fields are necessary, Figure 3.1 presents
1
”Javadoc is a documentation generator developed by Sun Microsystems.”
an example of the CSV file structure.
Figure 3.1: CSV file example.
A set of libraries was used to deal with the scalability problem, Mahout2 library based on Hadoop Map Reduce 3, Weka4 and Mallet5. Besides, these libraries provide other useful methods that were used as support in this dissertation.
Weka provides a K-means algorithm to run the clustering tests and a K-fold-Cross Validation algorithm to determine the optimal number of clusters. In order to run the algorithms, the CVS file was converted into an Attribute-Relation File Format (ARFF6) file which is predefined as input in Weka to run the mentioned algorithms.
On the other hand Mahout also provides an implementation of the LDA algorithm, which was useful to validate the result of our implementation of LDA. The problem with Mahout LDA algorithm is the time it takes to run a test, because the algorithm uses folders and files to store the algorithm stages, which decreases the performance. Besides, recompiling the library is a hard task if we want to change some settings or test some specific properties. To run Mahout LDA, the CVS files needs to be converted in a new type and structure (sequencefiles 7) to start the algorithm settings. The input from Mahout LDA are files, representing each user with all their sessions. Mahout LDA load the folder with all users files (already in sequencefile format) and transforms into a new syntax(some type of vectors
8), and those files are the final input for the Mahout LDA algorithm. The Mahout LDA
2
The Apache Mahout machine learning library’s goal is to build scalable machine learning libraries.
3MapReduce is a programming model for processing large data set typically used to do distributed
computing on clusters
4
Weka is a collection of machine learning algorithms for data mining tasks.
5
MALLET is a Java-based package for statistical natural language processing, document classification, clustering, topic modeling, information extraction, and other machine learning applications to text.
6An ARFF file is an ASCII text file that describes a list of instances sharing a set of attributes. 7
Sequencefile is a Hadoop class which allows us to write arbitrary key,value pairs into it.
8
CHAPTER 3. DESIGN AND IMPLEMENTATION 32
output is stored in a folder which contains the topics distribution, one file per topic. Due to the performance problem, the LDA algorithm was implemented from scratch and integrated into the framework. This implementation will be described in a next section of this chapter. The results of LDA and the user and task analysis are displayed in a Web Page using real application screenshots which is more suitable to designers and usability engineers to interact and interpret the information. Furthermore the Web page can be accessed in other places using the Web. The structures (methods) to show the results were already implemented in the FUSAMI core. To display the information, the data recovered from the analysis was translated into a JavaScript Object Notation (JSON9) structure and sent to the system to display the results. The framework developed was adapted to understand the discovered information relating the application screenshoots and widgets by their IDs and the result was displayed in the mentioned Web page.
3.2.1 LDA Usage Data Model
Going further with LDA on a task discovery approach is necessary to define some terms to understand the connection between text and task analysis. Following the idea proposed by (Xu et al., 2010) and (Heinrich, 2004) the LDA was translated from Text Analysis into a task discovery space and the result is:
• Word: an item from a vocabulary indexed by {W1, W2, · · · , Wm} ⇒ Widget: item can
be used from the application indexed by {W1, W2, · · · , Wm}
• Document: a sequence of N words denoted by {w1, w2, · · · , wn} ⇒ User session :
sequence of widgets used by a user in one session denoted by {w1, w2, · · · , wn}.
• Corpus: is a collection of M documents denoted by {D1, D2, · · · , Dm} ⇒ Sessions :
collection of user sessions.
• Topic: is a hidden task (sequence of actions) discovered through data analysis.
3.3
Android Application
We used a real Android application, a memory game, which can be found in the Android Market, to discover usage information. The idea of the game is to link pairs of cards, the cards are laid face down, hidden, and two cards are flipped face up over each turn. The objective of the game is to turn over pairs of matching cards, in a minimum number of tries. The application provides different usage contexts, e. g. football, celebrity couples, music,
9
German to English, and even Java programming. The users have the possibility to choose the difficulty of the game, a beginner user or an advanced user, which provide two different levels of game which implies increasing the number of matches needed to finish the game. The application also provides users with the possibility to store the scores of the game to create a high score list. Figure 3.2 shows real screenshots of the application.
CHAPTER 3. DESIGN AND IMPLEMENTATION 34
3.3.1 Data Collection and Preparation
The FUSAMI framework already had developed an event listener, logger, to automatically collect the usage data from the application and store it in the database using a Client/Server model.
Every time a user opens the application a user session is created, which represents the starting point of actions taken by the user from login until logout. During the session each action performed by the user is stored, including the set of events, and the time spent in the application and each stage. The event is the basic action performed by the user, e.g. clicking on a widget.
The logger deals with all the process to prepare the data from the application usage and send the information through the Web to the server database, the server splits and selects the important fields to be stored from the Web logs.
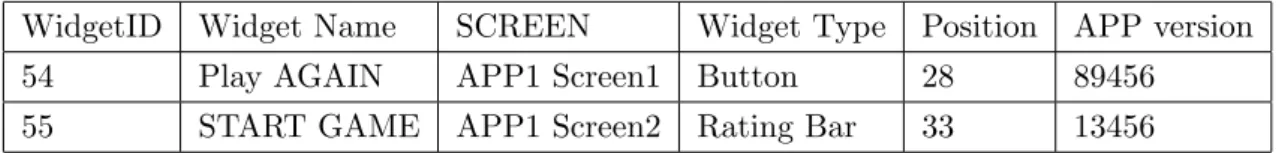
The SQL database (phpMyAdmin10) contains all user sessions with all events per-formed and other useful additional information, such as time stamps, screens used even the historical usage. Each session has their ID and each widget was also represented by their ID. Tables 3.1, 3.2, 3.3 and 3.4 represent a simple view of the database structure, the database was consulted using SQL queries.
The database contains 13551 different events taken by 41 users in 1017 sessions from real usage. After all information is stored in the database, the data was filtered, the CSV file is prepared(list of users performed events) and then the algorithms can run.
EventID ExtraINFO EventType PrivacyLevel TimeStamp SessionID WidgetID
1770 Null 0 0 1217911 1769 33
1771 1234 25 1 1317911 1769 61
Table 3.1: Database: Event Structure
SessionID UserINFO
1769 58
1566 31
Table 3.2: Database: Session Structure
10phpMyAdmin is a software tool written in PHP, intended to handle the administration of MySQL over
WidgetID Widget Name SCREEN Widget Type Position APP version
54 Play AGAIN APP1 Screen1 Button 28 89456
55 START GAME APP1 Screen2 Rating Bar 33 13456
Table 3.3: Database: Widget Structure
UserID USER Name
2 Manuel
83 Carlos
Table 3.4: Database: User Structure
3.4
Modelling User Interests via Clustering
Clustering algorithms operate differently, but the result is the same, building groups of data objects. The K-means algorithm is the most used algorithm for clustering, therefore K-means was used in this dissertation (Ray and Rose). Weka provides a K-means implementation which was used for the clustering process.
Each user is represented as a vector which corresponds to their sessions, the events sequence performed in a session by each user. If one user employ a actions sequence as widget A, B, D, E, D, B and finally C, this is represented as A → B → D → E → D → B → C. Figure 3.3 represents how is interpreted the events sequence employed by the user in their navigation path, the distance vector (Liu,2011).
The clustering result of the distance vector computation is considered as an interpre-tation of their user navigation patterns (Xu et al.,2010).
3.4.1 Measuring Similarity of Interest for Clustering Users
Capturing user’s characteristics is an important task to application designers. Through their access patterns history it is possible not only to know how the application was being used, but also the behavioral characteristic of users could be determined. The navigational user path carries valuable information about their interests and relationships. Strong correlation among the similarity of the navigational paths and similarity among the user interests represents valuable information to interface designers to make user groups and determine persona specifications. This information helps designers to adapt the application interface around the user’s requirements (Xu et al.,2010).
(Xu et al., 2010) presents useful similarities measures between users, which are im-portant not only to discover information about user actions, but also determine the cluster number to run the K-means algorithm. The similarities measures described in (Xu et al.,
CHAPTER 3. DESIGN AND IMPLEMENTATION 36
Figure 3.3: User Actions representation and vector structure.
2010) were adapted to be used in this research and the result of that adaptation is presented as follows.
Problem Definitions
There are m users U = { U1 , U2, · · · , Um } who perform n different actions(widget
usage) defined like P = { P1 , P2, · · · , Pn} in some navigational session. This sequence of
actions (widgets) represents a user vector of performed actions. A usage value is associated with each action (widget) Pi and each user Uj it is associated a usage value, representing
whether the user Uj perform the action Pj, denoted as use(Pi, Uj) and defined as
use(Pi, Uj) =
(
1, if Pi is accessed by Uj,
0, Ohterwise.
The usage vector is obtained by selecting the set of actions or events performed by the user, Ui, in the log database. If two users perform the same actions, they might have similar
interests in the same task. The similar interest measure is defined by
sim1(Ui, Uj) = P k(use(Pk, Ui) ∗ use(Pk, Uj)) pP kuse(Pk, Ui) ∗Pkuse(Pk, Uj) Where P
k(use(Pk, Ui)) is the total number of actions which were performed by user Ui.
P
kuse(Pk, Ui) ∗
P
kuse(Pk, Uj) is the number of common events performed by user Ui and
Uj . If two users share the exact sequence of actions, their similarity will be one; and zero
if they don’t share anything. This similarity measure is called Usage based (UB) measure. The last formula presents users who perform the same sequence of actions. We can
calculate the similarity between two users, Ui and Uj, by counting the number of times they
perform common events at every action. In this case, the measure is defined by
sim2(Ui, Uj) = P k P s(accs(Pk, Ui) ∗ accs(Pk, Uj)) pP kaccs(Pk, Ui) ∗Pkaccs(Pk, Uj)
Where accs(Pk, Ui) is the total number of times that user Ui performs the action Pk . This
measure is called Frequency Based (FB) measure.
In previous formulas, the event order is irrelevant. Now, we are interested in knowing which users have the same interests and which users perform the same actions in the same order. Two users are considered to have the same interests only if they perform the sequence of events in the exact same order. Let Q = { U1 , U2, · · · , Ur} be the actions path in a user
session, or navigational path which represents the user’s behavior in order to accomplish a given task, where qi , 1 ≤ i ≤ r, stands for the action performed in order. We denote Q as
r-hop path. Define Ql as the set of all possible L-hop sub paths ( 1 ≤ r ) of Q, i.e. Ql = {
qi, qi+1, · · · , qi+l−1|i = 1, 2, · · · , r }. It is obvious that Ql contains all events in Q. We call
f (Q) = Ul=1r Ql the feature space of the path Q. Notice that a cyclic path may include some
of its sub paths more than once, and Q⊆f(Q). Let Qi and Qj be the set of actions performed
by user Ui and Uj, respectively. The similarities between users Ui and Uj can be defined
using the natural angle between paths Qi and Qj (i.e. cos(Qi , Qj)) which is defined as :
sim3(Ui, Uj) =
hQi, Qji l
phQi, Qii
lhQj, Qjil
Where l = min (length(Qi), length(Qj)) , and hQi , Qjil it’s the inner product over the
feature spaces of paths Qi and Qj. Which is defined as hQi, Qjil = Plk=1
P
q∈Qi kT Q
j k
length(q) ∗ length(q). Like in the above equations the similarity between two users will equal one if they perform a sequence of actions in the exact same performed order, and will equal zero if they share no common actions at all. Notice hQi, Qjil is the same for all L ≤
min (length(Qi), length(Qj)). We call the previous equation the visiting-order based (VOB)
measure.
An example representation of the results of the above equations can be viewed in the next Figure 3.4(Liu,2011). In this Figure 3.4 we can see the structure of the result of the above computations, a symmetric matrix where the all elements in the diagonal are the same, 1.
Clustering Algorithm
The resulting similarities of the previous section are presented into a matrix of users; Figure 3.4 (Liu, 2011),where it is shown that each value is the similarity measure between users. Note that each of these matrices of similarities is a symmetric matrix and elements along the main diagonal are all the same, one. These matrices are used to do the clustering
CHAPTER 3. DESIGN AND IMPLEMENTATION 38
Figure 3.4: Similarity measures based on the similarity equations.
analysis, by the K-means algorithm (Ray and Rose).Which provide assistance to analyze the relationships between users based on task similarities (user analysis). Figure 3.5 represents the other perspective from the clustering analysis using the usage vector for each user, which help to determine what are the patterns resulting from the clustering algorithm (task analysis).
Figure 3.5: Clustering result with users and the usage vector.
3.4.2 Right Number of Clusters
Clusters analysis is a helpful technique to relate elements in groups. But the major challenge is to determine the appropriate number of clusters. The correct solution is not obvious. Nor-mally, it is a range of values, this range of values representing better the higher associations between users. Another problem is one might not know the number of clusters before the data analysis. The optimal number, k, has a direct effect in the cluster process. If it is too big or too small, the result may not be adequate and desirable. The main idea will be to
always reduce the amount of errors in the resulting clustering (minimize the sum-of-squares error). The desirable objectives between clusters are:
• the objects inside a cluster are as similar as possible;
• objects from different clusters are as dissimilar as possible.
Determining the optimal number of clusters is one important task to clustering al-gorithms. Many researches around the problem propose a series of solutions as (Ray and Rose; Yan, 2005; Bies et al., 2009). The Elbow method, rule of thumb, estimations with Silhouette, CURE (Guha et al.,1998) and Chameleon (Karypis et al.,1999) or K-Fold Cross Validation (Kohavi, 1995) are some approaches to solve the problem. In this dissertation K-Fold Cross Validation was used to determine the optimal number of clusters because it is a solution already present in the Weka library source.
3.5
Finding User Access Patterns via LDA
The LDA model from (Blei et al.,2003) describes a probabilistic document-topic model for Text Mining. With the LDA approach from (Xu et al.,2010) and (Heinrich,2004), the latent associations between user and tasks (sessions), and associations between task and actions (widgets used) were exposed and estimated via a inference algorithm, which provide a Usage Mining context.
The Usage Mining LDA reveals two aspects of the underlying associations:
• the hidden task space,
• the task mixture distribution of each user session, which reflects the hidden correlations between performed actions as well as user sessions.
With a discovered task space is possible modelling the user access patterns in weighted actions vectors to predict users interested actions.
LDA Data Structure Model
The original LDA approach from (Blei et al.,2003) uses a predefined structure organization to represent the data and compute the algorithm. With the requirements to compute the inference (Heinrich,2004), (Xu et al.,2010) and Task Analysis approach, the structures were adapted and were summarized in the Table 3.5, besides the parameters α and β were the Dirichlet Parameters (predefined values).
CHAPTER 3. DESIGN AND IMPLEMENTATION 40
Variable LDA Meaning
V Number of widgets on the application M Number of user sessions
N Total number of widgets in all sessions Nw=1,··· ,m Number of widgets in session s : Vector M
αk=1,··· ,k Prior weight of topic k in a session : Vector K
βw=1,··· ,V Prior weight of widget w in the topic : Vector V
φk=1,··· ,k;w=1,··· ,V Probability of the widget w occurring in topic k :Matrix KxV
φk=1,··· ,k Distribution of the widgets in topic k : Vector K
θd=1,··· ,M ;k=1,··· ,K Probability topic k occurring in session d for a widget : Matrix MxK
θd=1,··· ,M Distribution of topics in session d : Vector M
Zd=1,··· ,M ;N =1,··· ,N d Identity of topic of a widget w in session d : Matrix MxN
Table 3.5: LDA Variables Definition
3.5.1 Compute LDA Inference via Gibbs Sampling
Like mentioned above, the LDA model presents a limitation in the generative process. To deal with this issue a method called Gibbs sampling, which is a special case of Markov Chain Monte Carlo (MCMC), described in (Heinrich, 2004) was applied. Using (Heinrich, 2004) the deduction process to efficient approximates the inference is described, the resulted equations were used in this dissertation to compute the inference. In the process (Heinrich, 2004) φ and θ were marginalized out, and only the latent variables Z were sampled. After the sampler has burned-in we could estimate φ and θ given Z (Heinrich,2004). When the algorithm reaches the burn-in stage, stop, because the samples has converged. To calculate the probabilities of the Dirichlet distributions the values of α and β as determined by flowing some samples of the LDA usages base on (Heinrich, 2004). The next equations present the equations to solve our implementation model of the LDA (Heinrich, 2004; Porteous et al., 2008). Full Conditional p(Zi = K|Z¬i, W ) = ntk,¬i+ βt PV t=1ntk,¬i+ βt ∗ n t m,¬i+ αk [Pk k=1nkm+ α] − 1 (3.1) When: ntk,¬i+ βt PV t=1ntk,¬i+ βt (3.2)
is probability of term t under topic k and:
ntm,¬i+ αk
[Pk
k=1nkm+ α] − 1
(3.3)
is the probability of topic k in session m.
Multinomial Parameters θ and φ
Equation to compute φ (for each topic which indicates what words are important to a topic): φk,t= ntk+ βt Pv t=1ntk+ βt (3.4)
Equation to compute θ (for each document represents how this topic is important to the document): θm,k = nk m+ αk Pk k=1nkm+ αk (3.5)
3.5.2 LDA implementation via Gibbs Sampling
The previous section presents the equations to approximate the inference to compute the LDA. With the generative process described in Figure 2.5 it is possible to calculate the LDA algorithm by using the Gibbs sampling. Following the description in (Heinrich, 2004) the LDA algorithm can be implemented as follows in Algorithm 1.
CHAPTER 3. DESIGN AND IMPLEMENTATION 42
Algorithm 1 LDA via Gibbs Sampling Algorithm * Structures Initialization
Zero All count variables nkm, nm, ntk, nk
for all documents mε[1, · · · , M ] do for all words nε[1, · · · , Nm] do
sample topic index Zm,n = K ∼ M ult(1/K)
increment document topic count : nkm+ 1 increment document topic sum : nm+ 1
increment topic term count : ntk+ 1 increment topic term sum : nk+ 1
end for
* Gibbs Sampling over Burn-in period and Sampling period end for
while not finished do
for all documents mε[1, · · · , M ] do for all words nε[1, · · · , Nm do
* for the current assignment of k to term t for word wn,m
Decrement counts and sums : nkm− 1 , nm− 1 , ntk− 1 , nk− 1
* Multinomial Sampling : Full conditional 3.1 sample topic index k ∼ p(zi|Z¬i, w)
* use the new assignment of Zn,m to the term t of word Wm,n to :
increment counts and sums : nkm+ 1 , nm+ 1 , ntk+ 1 , nk+ 1
end for end for
* Check convergence and read out parameters
if converged and L sampling interactions since last read out then *the different parameters read outs are averaged
read out parameter set Φ according to (3.4) read out parameter set Θ according to (3.5) end if
Results and Evaluation
4.1
Overview
This chapter describes the obtained results by running the LDA algorithm and auxiliary methods exposed in Chapter 3. These results are presented and discussed using the Android application layout. To run the algorithm and methods, all parameters and assumptions are explained.
While developing this framework, all tests were based on the same Android application. Besides, the screenshots and data were taken from this application (Section 3.3).
As a start, a logger which was already implemented with the framework to process the user actions was used. Following a Client/Server model, the logger takes care of the preparation of usage information to be stored in the SQL database.
The database contains 13551 different events taken by 41 users in 1017 sessions of real usage, during one week on January 2012. When we talk about the user, we do not focus on their individual specification, like age, gender etc. We assume a user is a person who uses the application. These types of classifications can be used in a future work.
To start this research we assume the data was already loaded into the CSV file to be given as input to the algorithm LDA and auxiliary methods.
Presenting the guideline to conduct this dissertation, we use the K-Means algorithm to determine the user preferences, like most used widgets in all clusters, the usage pattern inside each cluster (use case) and the user distribution on each cluster. For each cluster determine how many users share the same pattern and what are the most important widgets for each cluster. Also we use some matrices of similarities to relate them in other approaches to improve the results. Besides determine the number of clusters (K-Fold cross validation) give us a clue to estimate the number of LDA topics. This provide us a background of information’s to support/evaluate the LDA result and determine the navigational task pattern. After the result calculated we use the purity equation to validate the results of the
CHAPTER 4. RESULTS AND EVALUATION 44
algorithm.
As mentioned on Chapter 3, this research adopts the idea by (Xu et al.,2010), that a task is the equivalent of a topic and a session is equal to a document, which is composed out of different events instead of words.
To simplify the visualization of the most and least used widgets, widget frequency, a gradient of color was used, with blue representing the least used and the red the most used. All used tests are determined by repeating several times the application usage with a well-defined objective, i.e. a set of repeated actions (only beginner usage or advanced usage and in a posterior a mix of both). With the result it is expected we can infer those usages. After we define the input, we use that input to test the algorithm and validate the results.
4.2
User Interests via Clustering
Using the clustering algorithm and the similarity equations (Section 3.4.1), the user’s inter-ests in the application are exposed. In other words, this process reveals three things: how many groups of users who share the same interests, what is the main interest shared for each group (shared set of widgets) and what are the user distribution for each cluster, which exposes how the application has been used and what was the goal.
Related with the clustering algorithm, other useful information was exposed. The framework has already implemented one cluster algorithm based in the K-means; which show the widget frequency in each cluster, Figure 4.6, and how many users on each cluster. This is an important result, because it represents which widgets are most used in each cluster (cluster pattern). Using ARM with the Apriori algorithm and prefix tree, it is possible also to discover the sequential usage pattern for the cluster (R.P. Gopalan, 2004). Also with the process to compute the previous sequential usage pattern, other useful information was determined as: the number of clicks on each widget Figure 4.2 and the widget frequent transition map Figure 4.1. Even the time spent on each screen, Figure 4.3. These results are already taken from the framework and used to validate our implementation of the clustering algorithm with the similarities equations in a perspective most connected with the tasks and user interests.
Figure 4.1: Widget transition map.