www.nat-hazards-earth-syst-sci.net/12/715/2012/ doi:10.5194/nhess-12-715-2012
© Author(s) 2012. CC Attribution 3.0 License.
and Earth
System Sciences
The 20 February 2010 Madeira flash-floods: synoptic analysis and
extreme rainfall assessment
M. Fragoso1, R. M. Trigo2, J. G. Pinto3, S. Lopes1,4, A. Lopes1, S. Ulbrich3, and C. Magro4 1IGOT, University of Lisbon, Portugal
2IDL, Faculty of Sciences, University of Lisbon, Portugal
3Institute for Geophysics and Meteorology, University of Cologne, Germany 4Laborat´orio Regional de Engenharia Civil, R.A. Madeira, Portugal
Correspondence to: M. Fragoso ([email protected])
Received: 9 May 2011 – Revised: 26 September 2011 – Accepted: 31 January 2012 – Published: 23 March 2012
Abstract. This study aims to characterise the rainfall ex-ceptionality and the meteorological context of the 20 Febru-ary 2010 flash-floods in Madeira (Portugal). Daily and hourly precipitation records from the available rain-gauge station networks are evaluated in order to reconstitute the temporal evolution of the rainstorm, as its geographic inci-dence, contributing to understand the flash-flood dynamics and the type and spatial distribution of the associated im-pacts. The exceptionality of the rainstorm is further con-firmed by the return period associated with the daily precip-itation registered at the two long-term record stations, with 146.9 mm observed in the city of Funchal and 333.8 mm on the mountain top, corresponding to an estimated return pe-riod of approximately 290 yr and 90 yr, respectively. Further-more, the synoptic associated situation responsible for the flash-floods is analysed using different sources of informa-tion, e.g., weather charts, reanalysis data, Meteosat images and radiosounding data, with the focus on two main issues: (1) the dynamical conditions that promoted such anomalous humidity availability over the Madeira region on 20 Febru-ary 2010 and (2) the uplift mechanism that induced deep con-vection activity.
1 Introduction
On the 20 February 2010 the island of Madeira was hit by torrential rainfall that triggered catastrophic flash-floods, ac-counting for a death toll of 45, with roughly half of the vic-tims (22) alone occurring in the capital city of Funchal, while 6 other persons were declared missing. It was the deadliest hydro-meteorological catastrophe in the Portuguese territory in the last four decades and the economic damage costs were estimated to be US$ 1.9 billion (EM-DAT CRED, 2010). The
island of Madeira is quite densely populated, particularly in its southern coast, with circa 267 000 inhabitants in 2011 census, with 150 000 (approximately 40 %) living in the Fun-chal district, one of the earliest tourism hot spots in Europe, currently with approximately 30 000 hotel beds. In 2009, the archipelago received 1 million guests; this corresponds to an income of more than 255 Million Euro (INE-Instituto Na-cional de Estat´ıstica, http://www.ine.pt).
Madeira is a mountainous island with 740.7 km2, located in the eastern subtropical area of the North Atlantic Ocean (Fig. 1a); Its orography (Fig. 1.b) is dominated by a vigor-ous volcanic landscape, with deep valleys, steeped slopes and scarps, exhibiting its highest elevations along a E–W oriented barrier, where the maximum altitude is achieved at the top of the eastern mountain range (1861m at Pico Ruivo). Located between the 30◦and 33◦latitude N, Madeira has a Mediterranean type climate moderated by the Atlantic Ocean, and since the island orographic barrier (E–W) has an almost perpendicular orientation with the prevailing wind direction (NE), temperature and rainfall vary remarkably be-tween the northern and southern slopes. The northern slopes are more humid than the southern counterparts at the same altitude, while the amount of rainfall increases with altitude on both slopes (Prada et al., 2009). The mean annual pre-cipitation varies between 600 mm in the Funchal district to close to 3000 mm at the top of the eastern mountain range (stations 43 and 25 in Fig. 1, respectively).
Relevant rain-induced natural hazards in Madeira are flash-floods, landslides, debris flows and less frequentlyt-sunamis, which can be caused by coastal rock slides (Ro-drigues and Ayala-Carcedo, 2003). Unlike the Azores and Canary Islands, Madeira lacks major volcanic activity and is prone only to relatively modest earthquake events. Flash-floods constitute probably the most dangerous natural hazard
716 M. Fragoso et al.: The 20 February 2010 Madeira flash-floods
Figures
(a)
(b)
Fig. 1. Location (a) and relief (b) of the island of Madeira (Portugal). Dots are locations of the rain-gauge stations used in this study (names and description in Table 1). Limits of the drainage basins affected by the 20 February flash-floods and landslides are also shown (names and description in the text).
Fig. 1. Location (a) and relief (b) of the island of Madeira (Portugal). Dots are locations of the rain-gauge stations used in this study (names and description in Table 1). Limits of the drainage basins affected by the 20 February flash-floods and landslides are also shown (names and description in the text).
Table 1. Main flash-flood events in Madeira between 1800 and 2010 (SRES, 2010).
Date Most affected areas Casualties and damage
9 October 1803 Funchal 800–1000 casualties
6 March 1929 S. Vicente 40 casualties, 11 houses destroyed
30 December 1939 Madalena do Mar 4 casualties
21 September 1972 Santo Ant´onio 2 casualties
20 December 1977 Estreito de Cˆamara de Lobos 2 casualties and 45 dislodged 23 and 24 January 1979 Machico, Porto da Cruz, Camacha, 14 casualties
Canhas, Calheta and Faj˜a do Penedo
29 October 1993 All the island 4 casualties, 4 missed people, 306 dislodged, 27 injured people, 76 houses destroyed 5 and 6 March 2001 Curral das Freiras and S. Vicente 4 casualties and 120 dislodged people 22 December 2009 Madalena do Mar and S. Vicente Houses and roads destroyed
20 February 2010 Funchal and Ribeira Brava 45 casualties, 6 missed people
in Madeira, where the phenomenon has the common name of “aluvi˜ao”, referring to flash-floods affecting streams whose discharges and energy increase dramatically after intense rainfall episodes, dragging mud, blocks and debris, and pro-ducing a powerful and destructive current (Ribeiro, 1985). An inventory of flash-floods responsible for human casualties or severe damage compiled by Quintal (1999) refers 30 flash-flood events after the historical catastrophe of 9 October 1803 – when more than 800 people were killed, mostly in Funchal – until the end of 1998. Taking into consideration the number of casualties or damage, a more recent compilation (SRES,
2010), indicates 9 main events of disastrous flash-floods over the 1800–2009 period (Table 1). Similar to the occurrence in October 1803, the damage suffered during the 20 Febru-ary 2010 event was particularly harmful in the southern slope of the island, mainly in the Funchal city district. Examples of damages and destruction associated with the flash-floods in the downtown area of Funchal and Ribeira Brava, two of the most affected areas, are shown in Fig. 2. An extraordi-nary volume of solid material – debris and huge blocks – was dragged and deposited by the torrential flows. A systematic survey of the landslides produced in 20 February 2010 based
a) (b)
c)
Fig. 2. Photos showing the destructive effects of the 20 February 2010 flash-floods and landslides in:
(a) downtown and (b) uplands; (c) Serra de Água, Ribeira Brava.
Fig. 2. Photos showing the destructive effects of the 20 February 2010 flash-floods and landslides in: (a) downtown and (b) uplands; (c) Serra de ´Agua, Ribeira Brava.
on remote-sensing analysis and validated by field data collec-tion allowed the identificacollec-tion of 3291 landslides in Funchal drainage basins and 5172 landslides in the Ribeira Brava sec-tor (SRES, 2010). According to the same report, as a result of this large number of landslides, it was estimated that a vol-ume of at least 250 000 m3of solid material was deposited in the Funchal urban areas.
The hydrological and geomorphological impacts related to this extreme event were concentrated over five drainage basins (limits shown in Fig. 1) belonging to the south-ern flank of the island, three of them located in the Fun-chal region (Ribeira de S˜ao Jo˜ao, Ribeira de Santa Luzia and Ribeira de Jo˜ao Gomes) while the remaining belong to the Ribeira Brava sector (Ribeira da Tabua, Ribeira Brava). These drainage basins are very small (with areas varying be-tween 8.8 km2 and 15 km2), and their shape is elongated,
except in the case of Ribeira Brava basin, the larger one, with 40.9 km2and exhibiting a funnel shape. The five drainage basins are also characterised by the dominance of steep slopes (mean slopes varying between 28 and 37 %, with some areas with slopes over 50 %) and short times of concentra-tion (inferior to 3.3 h in all cases, estimaconcentra-tions made using the Temez method, SRES 2010). These two parameters are relevant features for flash-flooding production. According to SRES (2010), the estimated peak flow for the 20 Febru-ary 2010 event reached 234 m3s−1 in the Ribeira de Jo˜ao Gomes, close to 300 m3s−1 in S˜ao Jo˜ao and Santa Luzia streams and 663 m3s−1in Ribeira Brava.
The complexity of the phenomenon studied here and the extreme severity of its impacts, resulted from the combi-nation of debris-flows, landslides and flash-flooding, trig-gered and produced in a short time lapse as a consequence
718 M. Fragoso et al.: The 20 February 2010 Madeira flash-floods
of an intense precipitation episode (the “paroxysm”, in 20 February 2010), but also controlled by antecedent and longer duration rainfalls, providing crucial pre-existing con-ditions to the disaster (the anomalous wet 2010 winter in Madeira). In fact, the intense rainfall event responsible for the 20 February 2010 flash-floods in Madeira occurred dur-ing a particularly anomalous wet winter affectdur-ing most sec-tors of southern Iberian Peninsula (Andrade et al., 2011; Ball, 2011; Vicente-Serrano et al., 2011), and also the Madeira archipelago. As described in detail below, several stations registered more than the triple of the average precipitation during the winter (DJF) months. Moreover, the extreme rain-fall event of the 20 February was preceded by very high precipitation during the previous months and, among others, an intense precipitation episode occurred three weeks earlier (2 February), affecting mostly the central mountain range with severe flooding impacts being felt in a stream of the northern coast (Faial). Undoubtedly, the accumulated pre-cipitation registered throughout the winter contributed to sat-urate soils, inducing favourable conditions to increase and accelerate surface runoff, aggravating flash-flood suscepti-bility in the Madeira drainage basins (SRES, 2010). There-fore, the exceptionality of the 20 February rainstorm episode should be analysed within the context of the whole winter, as the impacts observed during the event were clearly amplified by the continuous mounting of these predisposing factors for flash-flood occurrence.
This investigation is focused on the meteorological fea-tures of this extreme event, with the following main objec-tives:
1. To provide a detailed spatial and temporal characteri-sation of the precipitation observed on the 20 Febru-ary 2010 that triggered the flash-floods and landslides. Daily and hourly precipitation records from the avail-able rain-gauge stations network are evaluated in order to reconstitute the temporal evolution of the rainstorm, as well as its geographic incidence, contributing to un-derstand the flash-flood dynamics and the type and spa-tial distribution of the associated impacts.
2. To estimate the exceptionality of the rainstorm, using the longest monthly, daily and sub-daily precipitation series available for Madeira, with a special emphasis on the computation of estimates of the return periods of daily precipitation observed during the 20 Febru-ary 2010 event.
3. To describe the most relevant atmospheric factors in-volved in this extreme rainfall event, identifying the main atmospheric synoptic conditions and also relevant physical mechanisms that favoured its development.
2 Data and methods
The present research results from the collection, compilation and analysis of diverse types of data, information that can be considered to be included in two main topics: precipitation data and atmospheric data.
2.1 Precipitation data
The Island of Madeira is well covered by weather sta-tions with rain-gauges. Unfortunately these stations are maintained by three different organizations, namely: (1) IM/Instituto de Meteorologia, (2) IGA/Investimentos e Gest˜ao da ´Agua and (3) LREC/Laborat´orio Regional de En-genharia Civil. Since our aim is to obtain details on the extension and intensity of the event, a careful preliminary work of data assembling was performed to retrieve a ho-mogenous precipitation dataset, allowing a wide geograph-ical coverage of the island and to be sufficiently representa-tive of its complex orography. Thus, daily and hourly pre-cipitation data from a total of 47 meteorological and rain-gauge stations were gathered. Their location is depicted in Fig. 1b and their main characteristics are presented in Ta-ble 2. We are confident that the raingauge network density (exceeding 6 stations/100 km2)is sufficiently representative, in spite of the steep orography that dominates the island land-scape. The precipitation data from these 47 stations was used to produce hourly and daily precipitation maps relative to the 20 February 2010 following the application of appropriate geostatistical techniques. In this regard, the ordinary kriging was chosen as interpolation method, estimating specific var-iogram models for each map (e.g., Goovaerts, 1997; Showal-ter, 2010).
In addition to these precipitation data, long-term series of annual maximum daily precipitation were collected, al-lowing the evaluation of the return period, i.e., an objective measure of the long-term exceptionality of the 20 Febru-ary event. Unfortunately, only two series with appropri-ate temporal length (with ongoing observations and at least more than 60 yr of records) – Funchal/Observat´orio (no. 43, Fig. 1b) and Areeiro (no. 25, Fig. 1b) – were available and used for this analysis. Moreover, both series are not complete and their quality was also affected by changes in the instru-ments along the total period of collected information, start-ing in 1936 and endstart-ing in 2010. Nevertheless, the number of gaps was 5 % (8 %) of missing data for Funchal (Areeiro), which was considered to be acceptable when computing the return period estimations.
2.2 Synoptic and atmospheric data
The synoptic context of the 20 February 2010 extreme event was analysed using different sources of information. Weather charts covering the Eastern Atlantic were obtained from the German Weather Service (Deutscher Wetterdienst; DWD)
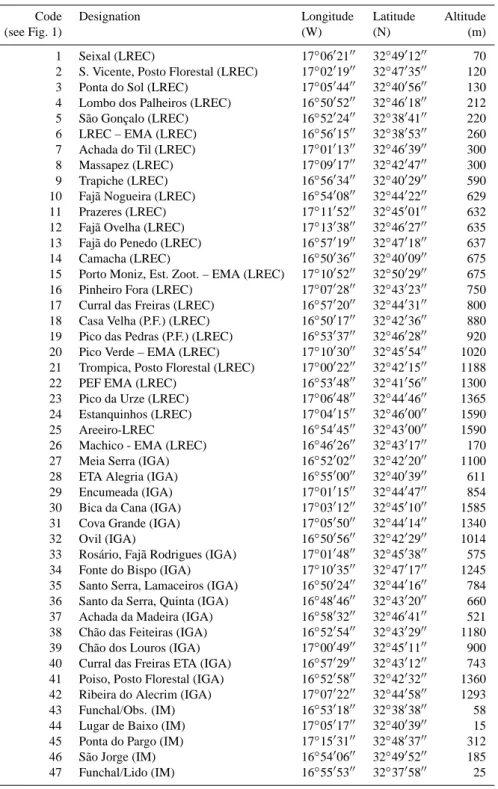
Table 2. Description of meteorological stations and raingauges used in this study.
Code Designation Longitude Latitude Altitude
(see Fig. 1) (W) (N) (m)
1 Seixal (LREC) 17◦0602100 32◦4901200 70
2 S. Vicente, Posto Florestal (LREC) 17◦0201900 32◦4703500 120 3 Ponta do Sol (LREC) 17◦0504400 32◦4005600 130 4 Lombo dos Palheiros (LREC) 16◦5005200 32◦4601800 212 5 S˜ao Gonc¸alo (LREC) 16◦5202400 32◦3804100 220 6 LREC – EMA (LREC) 16◦5601500 32◦3805300 260 7 Achada do Til (LREC) 17◦0101300 32◦4603900 300
8 Massapez (LREC) 17◦0901700 32◦4204700 300
9 Trapiche (LREC) 16◦5603400 32◦4002900 590
10 Faj˜a Nogueira (LREC) 16◦5400800 32◦4402200 629 11 Prazeres (LREC) 17◦1105200 32◦4500100 632 12 Faj˜a Ovelha (LREC) 17◦1303800 32◦4602700 635 13 Faj˜a do Penedo (LREC) 16◦5701900 32◦4701800 637
14 Camacha (LREC) 16◦5003600 32◦4000900 675
15 Porto Moniz, Est. Zoot. – EMA (LREC) 17◦1005200 32◦5002900 675 16 Pinheiro Fora (LREC) 17◦0702800 32◦4302300 750 17 Curral das Freiras (LREC) 16◦5702000 32◦4403100 800 18 Casa Velha (P.F.) (LREC) 16◦5001700 32◦4203600 880 19 Pico das Pedras (P.F.) (LREC) 16◦5303700 32◦4602800 920 20 Pico Verde – EMA (LREC) 17◦1003000 32◦4505400 1020 21 Trompica, Posto Florestal (LREC) 17◦0002200 32◦4201500 1188 22 PEF EMA (LREC) 16◦5304800 32◦4105600 1300 23 Pico da Urze (LREC) 17◦0604800 32◦4404600 1365 24 Estanquinhos (LREC) 17◦0401500 32◦4600000 1590
25 Areeiro-LREC 16◦5404500 32◦4300000 1590
26 Machico - EMA (LREC) 16◦4602600 32◦4301700 170 27 Meia Serra (IGA) 16◦5200200 32◦4202000 1100 28 ETA Alegria (IGA) 16◦5500000 32◦4003900 611 29 Encumeada (IGA) 17◦0101500 32◦4404700 854 30 Bica da Cana (IGA) 17◦0301200 32◦4501000 1585 31 Cova Grande (IGA) 17◦0505000 32◦4401400 1340
32 Ovil (IGA) 16◦5005600 32◦4202900 1014
33 Ros´ario, Faj˜a Rodrigues (IGA) 17◦0104800 32◦4503800 575 34 Fonte do Bispo (IGA) 17◦1003500 32◦4701700 1245 35 Santo Serra, Lamaceiros (IGA) 16◦5002400 32◦4401600 784 36 Santo da Serra, Quinta (IGA) 16◦4804600 32◦4302000 660 37 Achada da Madeira (IGA) 16◦5803200 32◦4604100 521 38 Ch˜ao das Feiteiras (IGA) 16◦5205400 32◦4302900 1180 39 Ch˜ao dos Louros (IGA) 17◦0004900 32◦4501100 900 40 Curral das Freiras ETA (IGA) 16◦5702900 32◦4301200 743 41 Poiso, Posto Florestal (IGA) 16◦5205800 32◦4203200 1360 42 Ribeira do Alecrim (IGA) 17◦0702200 32◦4405800 1293 43 Funchal/Obs. (IM) 16◦5301800 32◦3803800 58 44 Lugar de Baixo (IM) 17◦0501700 32◦4003900 15 45 Ponta do Pargo (IM) 17◦1503100 32◦4803700 312 46 S˜ao Jorge (IM) 16◦5400600 32◦4905200 185 47 Funchal/Lido (IM) 16◦5505300 32◦3705800 25
and were useful for the recognition of the main features of the associated synoptic atmospheric circulation. At-mospheric fields were extracted from the ERA-Interim re-analysis (ECWMF) dataset, available on a 1.5◦×1.5◦ lat-itude/longitude mesh and are used to analyse the dynami-cal aspects of the meteorologidynami-cal event. The thermodynamic environment associated with this event is characterised by
two instability parameters, the Lifted index (LI) and CAPE (Convective Available Potential Energy). The LI is the tem-perature difference between an air parcel lifted adiabatically and the environment temperature at 500 hPa (e.g., Galway, 1958). Negative values of LI indicate that the atmosphere is unstable. The more negative values of LI, the higher the probability of thunderstorm occurrence. CAPE is the
720 M. Fragoso et al.: The 20 February 2010 Madeira flash-floods
Fig. 3. (a)Accumulated daily precipitation (ADP) in Areeiro (station number 25 in Fig. 1) between 1 October 2009 and 28 February 2010 (blue line) and comparison with the long-term median (red line) and 95th percentile (dark line) of the ADP for the same time span, estimated over the 1936/37–2008/09 period. Indicated is the occurrence of three events (1) 22 December 2009 flash flood (2) 2 February 2010 heavy rainfall event (3) 20 February 2010 flash flood. Note: the represented precipitation data were recorded in different meteorological stations, however, just separated by a few metres and located approximately at the same height (20 m of difference). (b) Hourly evolution of the 20 February 2010 rainstorm in Madeira, in four selected udographic stations from the Funchal city surroundings. Indicated hours in the abcissae axis are the ending time of the corresponding precipitation amount. The altitude (metres) of the four rain-gauge stations is inserted in the legend.
amount of energy a parcel of air would have if lifted verti-cally through the atmosphere (Moncrieff and Green, 1972; Doswell and Rasmunsen, 1994). Positive CAPE indicate positive buoyancy of an air parcel being, thus, an indica-tor of atmospheric instability. The humidity transport as-sociated with this event has been calculated based on this data using 3-D backward trajectories (Methven, 1997). This tool allows the tracing of humidity (or other atmospheric contents) of an air parcel and has been used, therefore, in some studies (e.g., Methven et al., 2001). In addition, the diagnostic of the intense mid-latitude cyclone system asso-ciated to the 20 February 2010 flash-floods in Madeira was also performed using appropriate sequences of Meteosat-9 satellite images (infra-red and water vapour channels, and also from the derived product Multi-Sensor Precipitation Es-timate, available at www.eumetsat.int). Further, the evolu-tion of local condievolu-tions of the tropospheric column was re-constituted using data from the radiosounding station in Fun-chal. Unfortunately, only one sounding per day is launched (at 12:00 UTC). Sounding plots, thermodynamic parameters and stability indices were computed using the RAwinsonde Observation (RAOB) software (Schewchuk, 2002).
3 Rainfall analysis
This section is devoted to the temporal and spatial charac-terisation of the precipitation associated with this prominent event. We start by analysing the precipitation during the
antecedent months leading to the extreme event. It must be underlined that the accumulated precipitation in the previ-ous months was very important for the phenomenon studied here. The large number of landslides and debris flows sud-denly produced in the 20 February 2010, are connected with the accumulated rainfall. This factor aggravated the sever-ity of the impacts of the flash floods, providing an enormous amount of rocks, debris and solid material to be dragged into the valleys. Afterwards, a detailed description of the spatial and temporal evolution of the precipitation event is provided. Finally, the exceptionality of the event is evaluated with long records that allow computing the return periods associated with the event.
3.1 The extremely wet 2009–2010 winter in the Madeira Islands
The analysis of Fig. 3a allows the comparison of the accu-mulated daily precipitation (ADP) between the beginning of the 2010 hydrological year (starting 1 October 2009) and the end of February 2010 (blue line) with the long-term median (red line) and 95th percentile of the ADP (black line) for the same 72-yr long period (i.e., 1937/38–2008/09). The pre-cipitation data shown in this figure (Areeiro station, no. 25 in Fig. 1b) is representative of the precipitation records in the upper part of the eastern mountains of the island, close to one of its highest peaks. The winter was extremely wet at Areeiro (above 4000 mm of rainfall between 1 October 2009 and 28 February 2010), exceeding more than twice the median
amount of ADP obtained between 1937 and 2008 for the same period. Furthermore, the accumulated ADP at the end of February was also significantly higher than the cor-responding 95th percentile; in fact, the winter of 2009/2010 was the rainiest wet season since 1937. Nevertheless, the relative rank of this winter was not constant throughout the temporal window analysed in Fig. 3a, starting with a wet Oc-tober, the ADP remained slightly above the median until mid December, increasing to higher percentile only afterwards. In fact, after the 22 December 2009, the ADP begun to ex-ceed the 95th percentile and kept above this threshold un-til the end of February. Therefore, this comparative analysis clearly demonstrates that the 2009/2010 rainy season was ex-ceptionally wet at the mountainous region a few kilometres above the Funchal bay area. In particular, heavy precipita-tion episodes with extremely high amounts at daily scale oc-curred: 22 December 2009, 2 February 2010 and 20 Febru-ary 2010 (here described). These events are marked 1–3 in Fig. 3a.
In the Funchal area, the anomalously wet 2010 winter (DJF) was even more extreme (in relative terms) than what has been described for the Madeira uplands. The accu-mulated precipitation in 2010 winter was 997 mm in Fun-chal/Observatory station (no. 43 in Fig. 1b), largely exceed-ing the 95th percentile of its historical records for this sea-son, which is close to 700 mm. In particular, the precipitation amount observed at this station during February – 458.7 mm – corresponds to the new absolute all-time record since 1865, i.e., since the beginning of regular observations in the is-land. We would like to stress that this value exceeds 8 times the median value of February precipitation (obtained for the normal 1971–2000 period). This analysis confirms that the 20 February 2010 event was preceded by an equally out-standing anomalous accumulated precipitation, particularly on the upper parts of Eastern Mountains, which probably lead to increase the slope instability at the upstream sectors of the Funchal catchments and, thus, inducing favourable conditions for triggering landslides. The control of rainfall on landslides differs substantially depending upon landslide depth and kinematics and the affected material. Shallow soil slips and rapid debris flows are typically activated by a short period of very intense rain, while deep-seated rotational and translational slides are usually associated with less intense rainfall occurring in a period lasting several weeks to several months (e.g., Zˆezere et al., 2005).
3.2 Spatial features and temporal evolution of the 20 February 2010 rainstorm
A synthetic overview of the 20 February rainfall for selected stations is depicted in Fig. 3b, where we can appreciate the evolution of hourly precipitation throughout the day relative to four selected rain-gauge stations placed in the surrounding areas of the Funchal urban district. Among these rain-gauge stations, S˜ao Gonc¸alo (220 m of altitude, no. 5 in Fig. 1b)
is the lowest altitude station and is located east of Funchal. Trapiche (590 m, no. 9 in Fig. 1b) and Camacha (690 m, no. 14 in Fig. 1b) are representative sites from the intermedi-ate sectors of the slopes and are respectively locintermedi-ated to the west and east of the Funchal city area. Areeiro (1590 m, no. 25 in Fig. 1b) is the most elevated rain-gauge represented in Fig. 3b, illustrating the rainstorm on the upstream sector of the drainage basin that cross the Funchal urban district, and where flash-floods occurred.
The total duration of the rainstorm was quite unusual with roughly 14 consecutive hours of uninterrupted precip-itation over most of the Island, starting at 03:00 UTC and ending only at 17:00 UTC. The hourly precipitation inten-sity increased gradually during the early morning hours of 20 February in this southern sector of the Madeira Island. Interestingly, the most intense and critical period of the storm hit initially the lower and midway sectors of the slopes (Fig. 3b), where the hourly rainfall intensity reached at least 60 mm h−1between 08:00 and 09:00 UTC. At this stage, the precipitation was much lower in the upper sectors of the mountainous area, such as the Areeiro Peak. However, dur-ing the followdur-ing hours, while the precipitation started to decrease at lower altitudes, an increase can be observed at higher levels (e.g., Areeiro), with a maximum at 11:00 UTC, when landslides and floods were already occurring and ag-gravating their impacts even more. Afterwards, and un-til 14:00 UTC, very abundant precipitation was accumulated at the upstream sectors of the drainage systems, especially those that flow into the Funchal coastal areas, as it is demon-strated by the hourly intensity rates above 30 mm h−1in the Areeiro rain-gauge station (Fig. 3b).
In order to obtain an appropriate reconstitution of the space-time variability of the precipitation associated with the 20 February rainstorm in Madeira, hourly maps were elabo-rated using all available information from the 47 rain-gauges of the island (Fig. 4). These eleven hourly maps illustrate the evolution of the rainstorm between 05:00 and 16:00 UTC, thus, allowing a detailed representation of the event (the first three hours are omitted as precipitation amounts were rel-atively small). Figure 4 documents the initial phase of the event, when precipitation began to batter the southern flanks of the island, especially its eastern sectors, including the Fun-chal district. From 08:00 to 09:00 UTC, the rainfall was more intense at lower sectors of the southern slopes, with intensities close to 35 mm h−1. In the following two hours, the precipitation rate increased (up to 60 to 80 mm h−1) and was more concentrated over the intermediate elevation sec-tors around the Funchal region, at slope levels between 500 and 1000 m of altitude. The most intense cores of severe precipitation after 10:00 UTC mainly affected areas close to Funchal or its surroundings. From 11:00 UTC onwards, the most intense precipitation moved northwards and was mostly confined to the uplands and higher peaks of the central ridge of the island. Throughout this period, the spatial pattern of precipitation distribution is generally marked by the major
722 M. Fragoso et al.: The 20 February 2010 Madeira flash-floods
Fig. 4. Hourly precipitation in Madeira, 20 February 2010, between 05:00 UTC and 16:00 UTC. The
maps are based on data from the same rain-gauge network represented in fig. 1 (locations) and listed
in Table 2.
Fig. 4. Hourly precipitation in Madeira, 20 February 2010, between 05:00 UTC and 16:00 UTC. The maps are based on data from the same rain-gauge network represented in Fig. 1 (locations) and listed in Table 2.
topographic contrasts (depicted in Fig. 1b), suggesting that the orography played an important role to enhance and focus the event, resulting in a longer and even rainier storm.
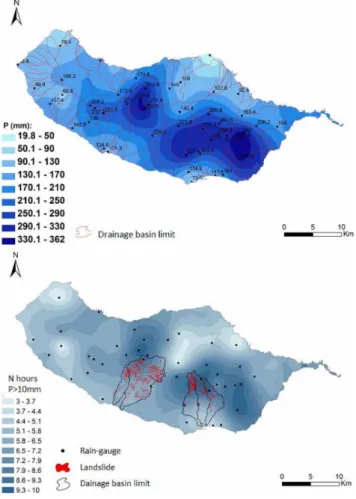
The total daily precipitation amounts for the 20 Febru-ary 2010 in Madeira are shown in Fig. 5a. Since no rel-evant showers occurred after its end 17:00 UTC, the pre-cipitation distribution is representative for the whole event. Two major findings emerge from the analysis of Fig. 5a: (a) the large area of the island (>50 %) with total precip-itation inside the 250 mm isoyeth limits; and (b) the exis-tence of two main cores of extremely abundant precipita-tion, with amounts varying between 250 and 370 mm, one located over the uplands and southern slopes of the eastern mountains (Areeiro plateau), and another one centred over the central plateau sector (Pa´ul da Serra and Encumeada). A closer look at Fig. 5a indicates that the Funchal area was en-tirely surrounded by the crescent pattern that characterises the southeastern peak of intense rainfalls, which explains the severity of flash-floods, landslides and debris-flows impacts on its drainage basins (see example in Fig. 2b). On the other hand, the second precipitation peak over the central plateau is responsible for the catastrophic impacts of floods and land-slides in the Ribeira Brava area, located further west in the southern flank of the Island (Fig. 1b). The main cores of
excessive rainfall may be expressed by mapping the total number of hours with precipitation above 10 mm (Fig. 5b; SRES, 2010). The period of sustained intense precipitation was considerably long, varying from five to ten consecutive hours over extended areas, which was, very probably, a crit-ical condition to trigger the large number of landslides and other complex slope movements observed in the two main affected sectors (i.e., Funchal and Ribeira Brava, cf. Fig. 5b). Undoubtedly, the effects of such a large number of land-slides, providing an outstanding volume of solid material to be dragged along streams, accounted for aggravating flash-flooding impacts, resulting in the catastrophic and deadly event on the lower sectors of the small drainage basins.
3.3 Assessment of the precipitation exceptionality
The estimation of return periods is a classical approach in order to evaluate the exceptionality and magnitude of treme meteorological events. This technique uses the ex-treme values analysis, the branch of probability and statistics that is used to make inferences about the size and frequency of extreme events (Storch and Zwiers, 2003). The propri-eties of some of the most used extreme values distributions in climatology and hydrological sciences were described by
Fig. 5. (a) Total daily precipitation in Madeira (00:00–24:00 UTC), 20 February 2010. The map is based on data from the same rain-gauge network represented in Fig. 1 (station names are listed in Ta-ble 1). (b) Number of hours with precipitation above 10 mm and landslides distribution on Funchal and Ribeira Brava areas. This map is based on a subset of the network presented in Fig. 1, consist-ing only in udographic stations. Source: SRES, 2010.
Gumbel (1958) and recent reviews document a large num-ber of applications (e.g., Coles, 2001; Alexandersson et al., 2001; Svenson and Jones, 2010). The availability of long-term series of the parameter to be analysed is a mandatory condition to carry out this type of investigation in an appro-priate way, which represents in many cases a significant con-straint. In the present study, the scarce availability of long-term series posed a problem. Another problem is that the archives only contain the precipitation accumulation for fixed periods (e.g., 24 h beginning at 09:00 UTC), instead of accu-mulations over a moving window (e.g., 24-h period).
With regard to the precipitation series of annual max-ima within 24 h, appropriate long-term records (1936–2010) are only available for two meteorological stations: Areeiro and Funchal/Observatory. A number of experiments were conducted in order to fit the most commonly used extreme value distributions to the data. The best fitting model was
obtained with the GEV distribution, ranking the set of re-sults from three standard tests to evaluate the goodness of fit: Kolgomorov-Smirnov, Anderson-Darling and Chi-squared tests (e.g., Wilks, 2005). Return periods for the 24 h rain-fall observed for the 20 February 2010 for both sites con-firm the exceptionality of the rainstorm. In the case of the mountainous Areeiro station, the 24 h amount detected (333.8 mm) corresponds to an estimated return period of ap-proximately 90 yr. In contrast, the 24 h amount observed in Funchal/Observatory (146.9 mm) corresponds to a return pe-riod estimated to be in the order of 290 yr, thus, an even less frequent event.
Caution is required when estimating such long return pe-riods, as they are much longer than the time series used to compute them. In any case this statistical approach clearly suggests that the 20 February 2010 extreme event can be clas-sified as exceptional for both stations, although even more outstanding in the Funchal area than at the top of the East-ern mountains. Moreover, it must be stressed that almost 80 % of this extreme daily precipitation observed in the Fun-chal/Observatory occurred within a six hours period (08:00 and 14:00 UTC). This period of sustained intense rain-bursts produced 114.8 mm of accumulated precipitation, an impres-sive amount for 6 h-duration in Funchal, as it was confirmed after a comparison with previous corresponding annual max-ima over the 1980–2009 period: This value exceeds the pre-vious maximum for this time length (92.6 mm, observed in 27 September 1989).
4 Synoptic context
This section is devoted to the discussion of the main aspects of the atmospheric circulation and associated physical mech-anisms that were responsible for the 20 February copious amounts of rainfall in Madeira Island. It is important to ad-dress first the large-scale atmospheric conditions associated with the prolonged precipitation anomaly in Madeira during the winter 2010. In fact, this winter was characterised by a clear prevalence of the negative phase of the North At-lantic Oscillation (NAO) (new winter record-breaking, e.g., Osborn, 2011), with strong positive SLP anomalies in the Iceland low area and negative anomalies in the Azores high pressure region (Andrade et al., 2011; Vicente-Serrano et al., 2011). In previous works (e.g., Ulbrich et al., 1999; Trigo et al., 2004; Santos et al., 2005, 2009) it was demonstrated that these large-scale atmospheric circulation conditions as-sociated with negative NAO phases induce an increase in the frequency of mid-latitude cyclones affecting the entire west-ern Iberian region and a large sector of the contiguous north Atlantic basin, therefore, affecting also the island of Madeira. This significant increase (decrease) of low pressure systems during the negative (positive) phase of the NAO pattern is the most important mechanism contributing for high (low) pre-cipitation amounts over western Iberia (Ulbrich et al., 1999;
724 M. Fragoso et al.: The 20 February 2010 Madeira flash-floods
Fig. 6. (a) Geopotential height field 500 hPa for 15–21 February 2010; (b) surface chart 20 February 2010, 00:00 UTC (c) same as (b) but for 12:00 UTC (d) Met9 satellite figure, 12:00 UTC. Sources: (a) Era-interim (b–c) DWD (d) Naval European Meteorology and Oceanographic Center (https://www.nemoc.navy.mil/site/satellite/).
Trigo et al., 2004). This relationship was, once again, con-firmed during the 2010 winter, which was a very wet winter in Portugal (Andrade et al., 2011), southern Spain (Vicente-Serrano et al., 2011) and Madeira (Fig. 3a). Therefore, these prevailing large-scale atmospheric circulation conditions had a preponderant role by promoting higher frequency of syn-optic disturbances over the region and contributing for the anomalous wet winter 2010 in Madeira, as it was demon-strated in detail in Sect. 3.1.
On the third week of February 2010, the large-scale atmo-spheric circulation over the North Atlantic was dominated by a diffluent block of the mid-latitude circulation, with a high pressure centre over Southern Greenland and a cyclonic cell located close to Newfoundland and extending west almost to the Azores islands (Fig. 6a). This configuration is associated with a southward shift of the Westerlies, along the 30–35◦N latitudinal band, therefore, directed towards the Madeira re-gion. The large-scale circulation conditions for this week
are similar to those found predominantly during the winter 2010 (Andrade et al., 2011; Vicente-Serrano et al., 2011), with SLP anomalies showing a clear north-south oriented dipole, with strong positive (negative) anomalies located over the Iceland/Greenland (Azores) region.
On 20 February, 00:00 UTC, a deep cyclone was located around 30◦W, 45◦N, near the Azores, with its fronts extend-ing to the subtropics (Fig. 6b). While the cyclone remains almost stationary, its associated fronts move eastwards dur-ing the day, and are located close to Madeira in the early afternoon (cf. situation for 12:00 UTC on Fig. 6c). The ap-proximation of the frontal system was responsible for a rapid and outstanding change on the atmospheric conditions over the region, and as is visible in the Fig. 6b, c and d, the island was closely affected by the occlusion region (frontal triple point), where massive convective cloudiness (Fig. 6d) was produced.
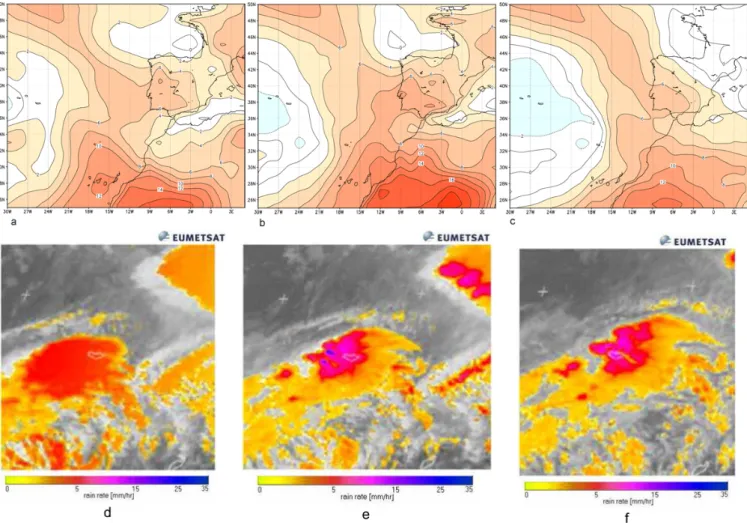
Fig. 7. Thermodynamic instability and mesoscale precipitation systems over the Madeira Atlantic sector: (a–c) Lifted index distribution over the Madeira Atlantic sector at 00:00, 06:00 and 12:00 UTC (units in◦C, source: ERA-Interim reanalysis, ECWMF); (d–f) Multi-Sensor Precipitation Estimate (MPE) product images at 09:45, 11:15 and 11:45 UTC (units in mm h−1, source EUMETSAT). The colours scale of the MPE images was modified in order to enhance the visibility of the island contours.
The thermodynamic environment that promoted such se-vere convective activity may be analysed more appropriately through the evolution of instability parameters distribution, such as Lifted index (LI) and CAPE (Convective Available Potential Energy), both extracted from ERA-Interim reanal-ysis dataset. Figure 7a–c shows that the arrival of the frontal system occurred under an unstable troposphere, with a core of very unstable conditions (delimited by the −2◦C iso-line) located close to the island by the late morning of the 20 February 2010. Despite this presence of high thermo-dynamic instability, demonstrated by the LI data evolution over the region (Fig. 7a–c), the storm activity had developed with low to moderate values of CAPE, showing that the high-est spots that crossed the region achieved amounts around 300 J kg−1(not shown).
This thermodynamic analysis can also be complemented using the radiosonde measurements from Funchal: Fig. 8 compares the situation on 19 February 2010 – the day before the rainstorm (blue lines) – with the 20 February sounding
(red lines; both soundings launched at 12:00 UTC). On 19 February, the Funchal area was affected by anticyclonic conditions, with weak winds in the lower part of the air col-umn. The approximation of the frontal area produced a dra-matic change of the atmospheric conditions: the winds in-tensified and turned west at the upper levels and southwest at the lower levels. This wind speed increase was very strong at the lower levels. The air temperature rose significantly throughout the entire column, especially at the lower tro-posphere (up to 10◦C), while the humidity profile changed significantly, being almost saturated below 750 hPa. Such changes resulted in an increase of precipitable water (PW) from 13.4 mm to 37.0 mm, showing that the water vapour availability remained almost three times higher, even when the rainstorm was in progress, and after 5/6 h of intense rain-fall.
The absence of a meteorological radar in Madeira, which could allow a suitable mesoscale analysis of this extreme event, is a relevant constraint. Nevertheless, this limitation
726 M. Fragoso et al.: The 20 February 2010 Madeira flash-floods
Fig. 8. Projection on a skew-T diagram of the 19 February 2010 (12:00 UTC) sounding in Funchal
(blue symbols) and in 20 February 2010 (also at 12:00 UTC, in red symbols).
Fig. 8. Projection on a skew-T diagram of the 19 February 2010 (12:00 UTC) sounding in Funchal (blue symbols) and in 20 February 2010 (also at 12:00 UTC, in red symbols).
was partially overcome by analysing the sequence of multi-sensor precipitation estimate (MPE) images, a product based on an algorithm that combines polar orbital microwave mea-surements and Meteosat IR channels, very useful for applica-tions in areas with poor or no radar coverage and available at EUMETSAT with a temporal resolution of 15 min. The anal-ysis of the complete sequence of MPE images (not shown here) allows us to confirm that several mesoscale precipita-tion systems crossed Madeira moving from West/Southwest to East/Northeast, therefore, affecting primarily the southern flanks of the island, as it was presumed in Sect. 3.2. The most long-lived and active of these mesoscale convective cloud systems moved over the island between 09:45 and 11:45 (Fig. 7d–f), a quasi-stationary precipitation system that was responsible for the most critical phase of the storm. More-over, the observed increase of convective activity when this massive cloud system (Fig. 7) overtopped the island, suggests that the orography probably contributed to trigger and/or re-inforce the dynamical uplifts. This assessment is in line with results of the modelling study by Luna et al. (2011), who documented the importance of the orographic forcing to this event. Therefore, orographic effects will not be further ad-dressed in the present study.
At this stage, two key questions are important to under-stand the unusual high levels of moisture availability and tropospheric instability, namely we must (1) evaluate the
dynamical conditions that promoted such anomalous humid-ity availabilhumid-ity over Madeira region on 20 February 2010, and (2) identify the uplift mechanism that induced deep con-vection activity. To achieve this goal we have analysed the upper-air wind speed and divergence (both at jet stream level, the 250 hPa pressure level) for the 20 February (Fig. 9, left panels). On 20 February, 00:00 UTC, the upper-air jet stream is located over the Eastern Atlantic, between 30 and 35◦N. At 06:00 UTC, the Madeira region is placed under the north-ward jet exit zone, where strong upper air divergence, in-dicative of strong uplifting, is observed. This fact supports the hypothesis that large scale forcing was crucial to the oc-currence of the event. While the area with strongest upper air divergence moves further east in the following hours, the area within Madeira remained largely with favourably large-scale conditions for large-scale vertical movements.
Simultaneously, the evolution at lower levels also con-tributed to deep convection triggering. The 850 hPa wind speed fields (Fig. 9, right panels) exhibit strong low-level southwesterlies (up to 30 m s−1) over the region, and it must be noted that this pressure level approximately cor-responds to the uplands heights of the island. This circu-lation prompted the advection of a strong humidity plume with a southwest-northeast orientation (Fig. 9b), contained within the warm section of the cyclone, most probably trans-ported within a tropical air mass (see greenish areas over the
50N 45N 40N 35N 30N 25N 50N 45N 40N 35N 30N 25N 50N 45N 40N 35N 30N 25N 40W 30W 20W 10W 0 40W 30W 20W 10W 0 6 7 8 9 10 11 40 45 50 55 60 65 70 75 80 a) c) e) f) d) b)
Fig. 9. (a) Wind speed (colours, units in m s−1) and divergence at 250 hPa geopotential level (solid lines with contours every 2 × 10⁻⁵s−1, zero line removed), for 20 February 2010, 00:00 UTC; (b) wind speed (arrows, units in m s−1), specific moisture content (colours, units in 10−3kg kg−1) and moisture convergence (dashed lines with contours every 10−5kg m−2s−1, zero line removed, only negative values are shown) at 850 hPa geopotential level for 00:00 UTC; (c) as (a) but for 06:00 UTC; (d) as (b) but for 06:00 UTC; (e) as (a) but for 12:00 UTC; (f) as (b) but for 12:00 UTC.
Eastern Atlantic in Fig. 6d). Therefore, this impressive hu-midity surplus, illustrated by the specific huhu-midity at 850 hPa geopotential level (Fig. 9b), arrived in the Madeira region at the exact moment when other favourable dynamical mech-anisms for deep convection were already ongoing, e.g., up-per level divergence and frontal uplift (Fig. 9 left). Figure 9 also depicts low level moisture convergence, a good indica-tor for large-scale precipitation, indicating that Madeira was under good large-scale conditions between 06:00 UTC and the early afternoon. Around midday, the occlusion point of the frontal system was located close to Madeira, which addi-tionally strengthened the precipitation.
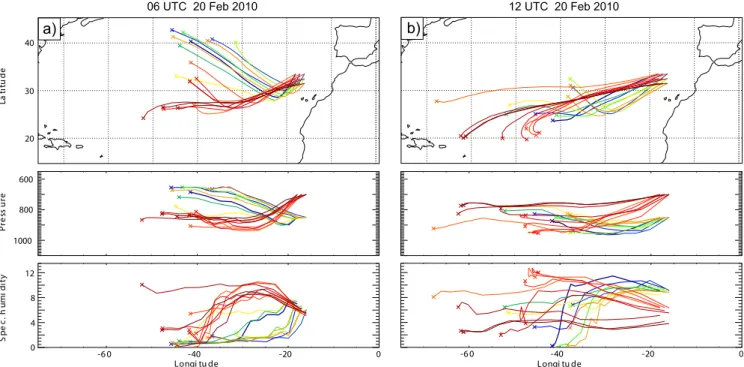
To investigate the source of the air mass and moisture associated with the 20 February storm in the Madeira re-gion, backward trajectories over three days were computed starting from this location, at 850 hPa and 700 hPa pres-sure levels (Fig 10a and b). During the initial phase of the storm (06:00 UTC, Fig. 10a), the source region is different from the 850 hPa and 700 hPa levels, originating respectively,
from the central Atlantic region (40◦N) and central subtrop-ical Atlantic (25–27◦N) at lower levels. While the latter shows large amounts of moisture during the last 48 h, the former only picks up moisture in large quantities shortly be-fore arriving over Madeira. Interestingly, the trajectories at 12:00 UTC (i.e., during the most intense precipitation period) all arrive from the subtropics (between 20 and 25◦N) for both levels. The trajectories are longer, in some cases tracing back to the Caribbean. Therefore, it is plausible to argue that the moisture brought along these trajectories contributed to rein-force the moisture availability within the warm sector of the cyclone, which then largely precipitated over the Madeira re-gion.
Finally, it must be stressed that all the above described dynamical features converged close to the Madeira moun-tainous island. Additionally, Madeira’s pronounced orogra-phy worked as an amplifying factor for precipitation gener-ation. Therefore, all the mentioned ingredients – e.g., upper air divergence, jet stream relative position, heat and moisture
728 M. Fragoso et al.: The 20 February 2010 Madeira flash-floods 40 30 20 600 800 1000 12 8 4 0 -6 0 -40 -20 0 -6 0 -40 -20 0 Longi tu de Longi tu de La ti tu d e P re ss u re S p e c . h u m id it y a) b)
06 UTC 20 Feb 2010 12 UTC 20 Feb 2010
Fig. 10. Backward trajectories over 72 h based on Era-interim data. Trajectories are started over and near Madeira in 850 hPa and 700 hPa on 20 February 2010 at (a) 06:00 UTC (b) 12:00 UTC. Shown are the horizontal paths (upper panel), the associated pressure level (middle panel; unit: hPa) and the associated humidity (lower panel, unit: 10−3kg kg−1) during each step of the trajectory.
availability – were probably sufficient conditions to explain this strong storm occurrence in the Madeira archipelago. Nevertheless, its anomalous duration and intensity was cer-tainly aggravated by the orographic controls, responsible for uplifts triggering its reinforcement and temporal persistence. The southern flanks of the Madeira mountains, especially those that surround the Funchal city district, were more ex-posed to the dominant southwesterly humid fluxes associated with this event, which can be important to understand the lo-cation of the most intense cores of produced precipitation and, subsequently, the distribution of the numerous and dis-astrous flash-flood impacts.
5 Discussion and conclusions
The 20 February Madeira flash-floods were investigated with regard to the synoptic/large-scale meteorological context fo-cusing on the dynamical controls of the event. The disaster was preceded by anomalous wet conditions over the 2010 winter – responsible for record-breaking values of monthly and seasonal values of winter accumulated precipitation – and also being characterised by the occurrence of several in-tense rainfall episodes affecting the island (e.g., 22 Decem-ber 2009, 2 February 2010). This accumulated precipitation was extremely important for the catastrophic impacts of the 20 February 2010 event, triggering thousands of landslides. Despite the magnitude of the earlier extreme precipitation episodes (22 December 2009 and 2 February 2010, both with daily precipitation amounts above 200 mm at the Funchal
mountains), those events have not triggered such devastat-ing flash-floods, landslides and debris flows. Therefore, the anomalous wet 2010 winter in Madeira was a concurrent fac-tor to explain the severity of the 20 February flash-floods and their associated impacts.
Large-scale atmospheric forcings were crucial to induce favourable conditions for the occurrence of deep convection close to Madeira in 20 February 2010. When a frontal cy-clone moving eastwards reached the region, its activity was enhanced. One factor was observed; strong upper-air di-vergence connected to the northward upper-air jet exit zone and indicating the occurrence of strong uplifts. In conjunc-tion, it was also demonstrated that strong humidity con-vergence at lower levels (at and below 700 hPa) was an-other important dynamical ingredient that, most likely, con-tributed to enhancing upward movements and higher precip-itation generation. These dynamical mechanisms resulted in strong cyclonic activity within the cyclone system that af-fected Madeira by its occlusion point, during the morning of 20 February, coinciding with the most critical period of rainstorm. Besides these dynamical conditions associated with the synoptic situation, it also stressed upon the role of orographic controls on the uplifts (cf. Luna et al., 2011), contributing to increasing the accumulated rainfall over the southern flanks of Madeira. Our study provides evidence that also large-scale forcing and pre-existing in situ condi-tions (total rainfall in previous winters) were very important factors for the extraordinary magnitude of the event.
The daily and sub-daily precipitation records associated with 20 February flash-floods in Madeira were analysed in detail. The sustained rain-bursts produced two main cores of extremely abundant precipitation, with amounts varying be-tween 250 and 370 mm, one located over the uplands and the southern slopes of the eastern mountains (Areeiro plateau) and another one centred over the central plateau sector (Pa´ul da Serra and Encumeada). This assessment may be useful in order to evaluate and to understand the geographic incidence of the storm impacts, like the triggered landslides distribu-tion, an investigation that should be addressed by geomor-phologists and other specialists. The exceptionality of the 20 February 2010 event was also investigated by estimating the return periods of 24 h rainfall for the available meteoro-logical stations with appropriate long time series. The results clearly suggest that the event was much more exceptional in the Funchal area than in the uplands, in spite of the higher total accumulated precipitation over the central and eastern mountains.
The control of rainfall on landslides differs substantially depending upon landslide depth and kinematics and the af-fected material. Shallow soil slips and rapid debris flows are typically activated by short period of very intense rain while deep-seated rotational and translational slides are usually as-sociated with less intense rainfall occurring in period lasting from several weeks to several months (Van Asch et al., 1999). It is interesting to notice that the vast number of landslide occurrences in southern Madeira fit well with two rainfall triggering mechanisms described in previous works in rela-tion to landslides close to Lisbon (Trigo et al., 2005; Zˆezere et al., 2005) and in the Azores archipelago (Marques et al., 2009). In fact, using empirical relationships between rainfall intensity and slope instability, it has been shown that critical rainfall conditions for failure are not the same for different types of landslides (Trigo et al., 2005). A considerable frac-tion of landslide events occurred immediately after intensive short bursts (1–5 days) of precipitation while another group of landslide events took place after prolonged periods (30– 90 days) of successive precipitation episodes of moderate intensity (Zˆezere et al., 2005). Low frequency atmospheric patterns are associated with anomalous precipitation at the seasonal scale and in recent years it has been found as a sig-nificant impact exerted by North Atlantic Oscillation (NAO) on the Portuguese mainland winter precipitation (Trigo et al., 2004) and over the recent landslide activity in the study area (Trigo et al., 2005; Zˆezere et al., 2005). This link is related to the control that the NAO exerts, at the monthly and sea-sonal scales, on the storms entering from the North Atlantic Ocean and corresponding precipitation field. However, note that the NAO is the dominant, but not the only relevant large-scale pattern affecting precipitation in this area: for example, Santos et al. (2005) documented the relevance of the East Atlantic pattern in this context.
In summary, the large number of landslide events ob-served on the 20 February 2010 (Fig. 5b) resulted from two
mechanisms working at different temporal scales, namely: (1) the strongly negative NAO phase throughout the winter that was responsible for the record rainy season observed and (2) the outstanding amounts of precipitation observed on a daily and hourly scale during the event, particularly in the mid and upper slopes of the mountains with drainage basins in the southern flanks.
The very harmful and deadly impacts of the 20 Febru-ary 2010 storm in Madeira were the consequence of a com-plex conjunction of environmental and societal factors. This work focused on the meteorological component of the flash-floods, but the impacts of this complex natural disaster were undoubtedly aggravated by several other physical condi-tions (e.g., geomorphological condicondi-tions, effects from costal surge) as also by anthropic factors, taking into account the strong human occupation of some of the most affected areas. Acknowledgements. This work was supported by the Portuguese Foundation for Science and Technology (FCT) through project Dis-aster – GIS database on hydro-geomorphologic disDis-asters in Portu-gal: a tool for environmental management and emergency planning (PTDC/CS-GEO/ 103231/2008).
This article also results from the research performed in 2010 for the Secretaria Regional do Equipamento Social da Regi˜ao Aut´onoma da Madeira, entitled “Estudo de Avaliac¸˜ao do Risco de Aluvi˜oes da Ilha da Madeira”, and carried out by a consortium formed by the Instituto Superior T´ecnico (IST, Portugal), the Universidade da Madeira (Madeira University) and the Laborat´orio Regional de En-genharia Civil (LREC).
The authors are grateful to Victor Prior (Instituto de Meteorologia, Portugal), for the kind availability of the radiosoundings from the Funchal station and to Dominique Yuen (Univ. Cologne) for help with Figs. 9 and 10.
Edited by: A. Mugnai
Reviewed by: M. C. Llasat and another anonymous referee
References
Alexandersson, H., Førland, E. J., Helminen, J., Sj¨oblom, N., and Tveito, O. E.: Extreme value analysis in the Nordic countries – pilot studies of minimum temperature and maximum daily pre-cipitation and a review of methods in use, DNMI, Report No. 03/01 KLIMA, Norwegian Meteorological Institute, Oslo, 2001. Andrade, C., Santos, J. A., Pinto, J. G., and Corte-Real, J.: Large-scale atmospheric dynamics of the wet winter 2009–2010 and its impact on hydrology in Portugal, Clim. Res., 46, 29–41, 2011. Ball, S.: Exceptional rainfall in Gibraltar during winter 2009/2010,
Weather, 66, 22–25, 2011.
Coles, S.: An Introduction to Statistical Modelling of Extreme Val-ues, Springer, London, 208 pp., 2001.
Doswell III, C. A. and Rasmussen, E. N.: The effect of neglect-ing the virtual temperature correction on CAPE calculations, Weather Forecast., 9, 625–629, 1994.
EM-DAT CRED: EM-SAT: The OFDA/CRED International Disas-ter Database, Universit´e Catholique de Louvain, Brussels
(Bel-730 M. Fragoso et al.: The 20 February 2010 Madeira flash-floods
gium), available at: www.emdat.be (last access: 8 March 2012), 2010.
Galway, J. G.: The lifted index as a predictor of latent instability, B. Am. Meteorol. Soc., 37, 528–529, 1956.
Goovaerts, P.: Geostatistics for Natural Resources Evaluation, Ox-ford University Press, New York, 1997.
Gumbel, E. J.: Statistics of Extremes, Columbia University Press, 1958.
Llasat, M. C., Rigo, T., and Barriendos, M.: The “Montserrat-2000”flash-flood event: a comparison with the floods that have occurred in the north-eastern Iberian peninsula since the 14th century, Int. J. Climatol., 23, 453–469, 2003.
Luna, T., Rocha, A., Carvalho, A. C., Ferreira, J. A., and Sousa, J.: Modelling the extreme precipitation event over Madeira Island on 20 February 2010, Nat. Hazards Earth Syst. Sci., 11, 2437– 2452, doi:10.5194/nhess-11-2437-2011, 2011.
Marques, R., Zˆezere, J. L., Trigo, R. M., Gaspar, J. L., and Trigo, I. F.: Rainfall patterns and critical values associated with landslides in Povoac¸˜ao County (S˜ao Miguel Island, Azores): relationships with the North Atlantic Oscillation), Hydrol. Process., 22, 478– 494, 2008.
Methven, J.: Offline trajectories: Calculation and accuracy, UK.Univ. Global Atmos. Modelling Programme, Dept. of Me-teorol., Univ. of Reading, Reading, UK, Tech. Report 44, 18 pp., 1997.
Methven, J., Evans, M., Simmonds, P., and Spain, G.: Estimating relationships between air-mass origin and chemical composition, J. Geophys. Res., 106, 5005–5019, 2001.
Milelli, M., Llasat, M. C., and Ducrocq, V.: The cases of June 2000, November 2002 and September 2002 as examples of Mediterranean floods, Nat. Hazards Earth Syst. Sci., 6, 271–284, doi:10.5194/nhess-6-271-2006, 2006.
Moncrieff, M. W. and Green, J. S. A.: The propagation of steady convective overturning in shear, Q. J. Roy. Meteor. Soc., 98, 336– 352, 1972.
Osborn, T. J.: Winter 2009/2010 temperatures and a record-breaking North Atlantic Oscillation Index, Weather, 66, 19–21, 2011.
Prada, S., Sequeira, M. M., Figueira, C., and Silva, M. O.: Fog precipitation and rainfall interception in the natural forests of Madeira Island (Portugal), Agr. Forest Meteorol., 149, 1179– 1187, 2009.
Quintal, R.: Aluvi˜oes da Madeira. S´eculos XIX e XX, Territorium, Revista de Geografia F´ısica aplicada ao Ordenamento do Ter-rit´orio e Gest˜ao de Riscos Naturais, Minerva, Coimbra, 6, 31–48, 1999.
Rigo, T. and Llasat, M. C.: Radar analysis of the life cycle of Mesoscale Convective Systems during the 10 June 2000 event, Nat. Hazards Earth Syst. Sci., 5, 959–970, doi:10.5194/nhess-5-959-2005, 2005.
Ribeiro, O.: A Ilha da Madeira at´e meados do S´ec, XX, Estudo Geogr´afico, Instituto de Cultura e L´ıngua Portuguesa, 1985. Rodrigues, D. and Ayala-Carcedo, F. J.: Rain-induced landslides
and debris flows in Madeira Island. Landslide News, J. Jpn. Landslide Soc. 14, 43–45, 2003.
Santos, J. A., Corte-Real, J., and Leite, S. M.: Weather regimes and their connection to the winter rainfall in Portugal, Int. J. Clima-tol., 25, 33–50, 2005.
Santos, J. A., Andrade, C., Corte-Real, J., and Leite, S.: The role of large-scale eddies in the occurrence of winter precipitation deficits in Portugal, Int. J. Climatol., 29, 1493–1507, 2009. SRES: Estudo de Avaliac¸˜ao do Risco de Aluvi˜oes da Ilha da
Madeira – Relat´orio S´ıntese, Instituto Superior T´ecnico, a Uni-versidade da Madeira e o Laborat´orio Regional de Engenharia Civil, 2010.
Shewchuk, J.: RAOB (the Rawinsonde Observation Program) for Windows. Version 5.1, Environmental Research Services, avail-able from Environmental Research Services, 1134 Delaware Dr., Matamoras, PA 18336, 2002.
Showalter, P. S. and Lu, Y. (Eds.): Geospatial Techniques in Urban Hazard and Disaster Analysis. Geotechnologies and the Environ-ment, Springer, London/New York, 2010.
Storch, H. V. and Zwiers, F. W.: Statistical analysis in climate re-search, Cambridge University Press, United Kingdom, 2003. Svenson, C. and Jones, D. A.: Review of rainfall frequency
estima-tion methods, J. Flood Risk Manage., 2, 296–313, 2010. Trigo, R. M., Pozo-Vasquez, D., Osborn, T. J., Castro-D´ıez, Y.,
G´amis-Fortis, S., and Esteban-Parra, M. J.: North Atlantic Oscil-lation influence on precipitation, river flow and water resources in the Iberian Peninsula, Int. J. Climatol., 24, 925–944, 2004. Trigo, R. M., Zˆezere, J. L., Rodrigues, M. L., and Trigo, I. F.: The
influence of the North Atlantic Oscillation on rainfall triggering of landslides near Lisbon, Nat. Hazards, 36, 331–354, 2005. Ulbrich, U., Christoph, M., Pinto, J. G., and Corte-Real, J.:
Depen-dence of winter precipitation over Portugal on NAO and baro-clinic wave activity, Int. J. Climatol., 19, 379–390, 1999. Van Asch, T., Buma, J., and Van Beek, L.: A view on some
hy-drological triggering systems in landslides, Geomorphology, 30, 25–32, 1999.
Vicente-Serrano, S., Trigo, R. M., L´opez-Moreno, J., Liberato, M. L. R., Lorenzo-Lacruz, J., Bergur´ıa, S., M´oran-Tejeda, H., and El Kenawi, A.: Extreme winter precipitation in the Iberian Penin-sula in 2010: anomalies, driving mechanisms and future projec-tions, Clim. Res., 46, 51–65, 2011.
Wilks, D.: Statistical methods in atmospheric sciences, Academic Press, 2005.
Zˆezere, J. L., Trigo, R. M., and Trigo, I. F.: Shallow and deep land-slides induced by rainfall in the Lisbon region (Portugal): assess-ment of relationships with the North Atlantic Oscillation, Nat. Hazards Earth Syst. Sci., 5, 331–344, doi:10.5194/nhess-5-331-2005, 2005.