The relation between mutual fund flows, stock returns and
macroeconomic variables: evidence from Portugal.
Júlio Lobão1 André Levi2
ABSTRACT
In this paper we analyze the relations between mutual fund flows, stock market returns and macroeconomic variables during the period 2000-2012 in Portugal. We find evidence of a statistically significant positive co-movement between mutual fund flows and stock market returns which is consistent with a common reaction to information about future economic activity. Moreover, our results suggest that both mutual fund flows and stock market returns are forward-looking and help to forecast the evolution of macroeconomic variables. These results have relevant implications for all the decision-makers that need to forecast economic activity.
Keywords: Mutual fund flows, stock returns, future economic activity, macroeconomic variables.
Received on: 2016.05.30 Approved on: 2016.07.15
Evaluated by a double blind review system
1University of Porto – School of Economics and Management.
CEPESE – Centro de Estudos de População, Economia e Sociedade. [email protected]
2 University of Porto – School of Economics and Management.
Portuguese Journal of Finance, Management and Accounting. ISSN: 2183-3826. Vol 2, Nº 4, September 2016
55
1. INTRODUCTIONOver the past decades there has been an extraordinary growth in the financial sector of most developed economies and the growth of the mutual fund industry has been particularly impressive. These developments have sparked the interest of academics. In fact, several studies examining the relationship between various financial and real variables have been published.
In this regard, most studies provide solid evidence of a positive co-movement between flows into mutual equity funds and stock returns (e.g., Warther, 1995; Edelen and Warner, 2001) and some scholars document a close relation between financial variables and macroeconomic variables (e.g., Jank, 2012).
In this paper we investigate the relationship between mutual fund flows, stock returns and macroeconomic variables in the Portuguese economy during the period 2000-2012. More specifically, we test the reaction of both flows into mutual funds and stock market returns to new macroeconomic information as an explanation for the co-movement between those two variables.
The results show a positive co-movement between mutual fund flows and stock market returns which corroborates the literature on the subject. Moreover, both mutual fund flows and stock market returns seem to be useful to forecast the evolution of economic activity measured by real GDP and consumption, for example.
This paper is organized in as follows. Section 2 reviews the literature regarding the relations between financial variables and real variables. Section 3 presents the data and methodologies used in this paper. Section 4 presents the empirical results. Section 5 offers conclusions.
2. LITERATURE REVIEW
2.1. Mutual fund flows and stock returns
In general, there are indications of a relation between flows into mutual funds and stock returns (Warther, 1995; Edelen and Warner, 2001; Jank, 2012). In fact, there are three main explanations for this strong relation between mutual fund flows and returns on the stock market (Warther, 1995). The first explanation is the feedback-trader hypothesis. The
Portuguese Journal of Finance, Management and Accounting. ISSN: 2183-3826. Vol 2, Nº 4, September 2016
56
reasoning is that investors tend to buy a security just because its price has increased. When a large number of investors buy the security, their action is inducing other investors to also buy it (Delong et al., 1990). In this case, market returns leads to fund flows, given that investors subscribe mutual funds when stock prices are rising and liquidate those funds when stock prices are falling.There is another possible explanation for this co-movement, the so-called price-pressure hypothesis, which states that as the fund flows increase, the demand for assets will also increase and this will obviously make stock prices to rise (Harris and Gurel, 1986; Humphrey et al., 2013).
The third explanation is the information-response hypothesis, which states that both fund flows and stock market returns react to new information and that is why this co-movement exists. Mutual fund investors acquire information and they react to that information. Immediately, the market will respond to this new information revealed. The result will be prices moving in the same direction as the fund flows and therefore the returns will be positively correlated with stock returns. The empirical study that we will carry out is based on the implications of the information-response hypothesis.
Several empirical studies have also been conducted on this subject. For example, Warther (1995) examined the correlation between net inflows and stock returns. The author used monthly data for the period from January 1984 to June 1993 to document that unexpected mutual fund flows were highly correlated with contemporaneous aggregate stock returns, whilst the expected mutual funds flows were uncorrelated with this variable. These results are consistent with the common belief that fund inflows and security returns are positively correlated. However, the author cannot conclude whether the reasons behind this relation are due to price pressures or information effects.
Edelen and Warner (2001) also found that there is indeed a positive correlation between the aggregate mutual fund flows and contemporaneous market returns at daily frequency. Their conclusions are compatible with either feedback trading or a common reaction to information.
Goetzmann and Massa (2003) have found little evidence of feedback trading. Using high-frequency flows of funds data, for a set of large S&P 500 index funds, their main
Portuguese Journal of Finance, Management and Accounting. ISSN: 2183-3826. Vol 2, Nº 4, September 2016
57
conclusions were that investor demand influences stock returns, but the opposite does not happen.Indro (2004) documents that net aggregate equity fund flow in a certain week tends to be higher when the sentiment of individual investors is more bullish. Therefore, his results suggest that the behavior of equity fund investors is influenced not only by economic fundamentals.
Rakowski and Wang (2009) have showed that the level of daily flows were determined by the past flows, the level of stock returns and the characteristics of the mutual fund, among other factors. They concluded that mutual fund investors do not trade merely based on exogenous liquidity needs, but respond dynamically to information investing in the mutual funds whose recent performance has been better.
Finally, Alexakis et al. (2013) have empirically examined both the short and long run dynamics between fund units and stock prices in Japan from 1998 to 2007. When prices were falling, their finding has indicated a unidirectional causality running from fund flows to stock prices. In periods with rising prices, it has showed a bidirectional causality between fund units and stock index prices. Overall, they show that both stock prices and mutual fund flows were affected by investors’ sentiment among other factors.
2.2. Stock returns and macroeconomic variables
The Efficient Market Hypothesis is one of the most important topics in the financial literature. According to this hypothesis, in an efficient market, stock prices fully incorporate all available information, causing stock prices to be traded at their fair value on stock exchanges (Fama, 1970).
One can argue that if stock prices fully reflect all relevant information, the stock market should also react to macroeconomic information. There are some empirical studies relating macroeconomic variables with the evolution of the stock markets. For example, several studies conclude that asset prices tend to move inversely to the rate of inflation (Jaffe and Mandelker, 1976; Fama and Schwert, 1977; Fama, 1981; Pindyck, 1984). Fama (1981) tried to explain this by arguing that the negative relationship between stock returns and inflation may be understood as a proxy of a negative relationship between inflation and the level of economic activity. Stock returns are determined by the forecasts concerning the
Portuguese Journal of Finance, Management and Accounting. ISSN: 2183-3826. Vol 2, Nº 4, September 2016
58
more relevant real variables and the negative relation that was observed was caused by a negative relation between inflation and real activity.Regarding the relation between stock returns and economic activity, Fama (1990) has showed that monthly, quarterly and annual stock returns tend to be highly correlated with future production growth rates in the period 1953-1987. This positive relationship is robust to the introduction in the model of proxies capturing time-varying expected returns and shocks to expected returns. He justifies these findings with the fact that because equity prices reflect expected future cash flows, equity prices changes should predict future macroeconomic conditions. Schwert (1990) investigated the stability of the relations estimated by Fama (1990) using additional 65 years of data and got similar results.
Chen et al. (1986) stated that macroeconomic variables which reflect the state of economy may be considered as risks that are to be rewarded in the stock market. In this sense all economic variables may be considered as endogenous. Their main result is that stock returns are exposed to systematic economic news and consequently they are priced according with those exposures.
The unemployment rate is another macroeconomic variable which appears to have an impact in the stock market. Boyd et al. (2001) refer that, on average, stock prices rise on bad news about the labor market during expansions, but fall during contractions in the US. They explain this fact stating that a rise in unemployment usually signals a decrease in interest rates, which is good news for stocks, but also signals future corporate earnings decreasing, which is bad news for stocks. Thus, information concerning to interest rates dominates during expansions and information concerning future corporate earnings dominates during economic downturns.
Birz and Lott (2011) argue that empirical evidence in support of economic news affecting stock returns has been rather weak because the way the economic news are interpreted by the public is also relevant and has not been contemplated by the most part of the analysis. The authors found that the news about GDP growth and unemployment rate significantly affects stock returns, while data about retail sales and durable goods tend to produce statistically insignificant impacts.
According to Duca (2007), economic theory suggests a strong link between security prices and economic activity, given that the security price is the discounted present value of the
Portuguese Journal of Finance, Management and Accounting. ISSN: 2183-3826. Vol 2, Nº 4, September 2016
59
company’s payout. From an empirical study on five large markets in the period 1957-2004, he concluded that there was a unidirectional causality from stock prices to GDP, which implies that the level of economic activity in a country can potentially depend on the stock market, amongst other variables.On a dissenting note, Ritter (2005) has found a negative correlation between stock returns and GDP growth in a sample of sixteen countries and 103 years (1900-2002) of data.
Coelho (2005) has studied this topic in the Portuguese economy, considering the impact of inflation announcements in the stock market. He found that the impact of announcements of US inflation affects returns in the US market but also in the Portuguese stock market. He also documents that the reaction in the stock market is not homogeneous, depending of the agents expectations with respect to the cycle phase in which the economy is.
2.3. Mutual fund flows, expected returns and the real economy
Jank (2012) investigated the relation between stock returns and mutual fund flows on one hand, and the real economy on the other hand. His findings support the assertion that the co-movement of flows into equity funds and stock returns is explained by a common reaction to macroeconomic news. Firstly, he found that mutual fund flows show a contemporaneous correlation with stock returns of 0.46 According to Jank (2012), the information-response hypothesis has two main implications: (i) variables that predict the economic activity should be related to mutual fund flows and (ii) if mutual fund flows react to news about future economic activity, then mutual fund flows should help predict the evolution of real economy.
In order to test the first implication, he used predictive variables as proxies for macroeconomic news and noted that there was a co-movement of flows and first differences of those predictive variables.
In order to examine the second implication of the information-response hypothesis, the author also investigated whether mutual fund flows contain macroeconomic information by themselves. Four variables were chosen as measures for economic activity, namely the GDP growth, the industrial production growth, the consumption growth and the labor income growth. He used a bivariate vector autoregressive (VAR) model of mutual fund flows and macroeconomic variables. For all four variables, the results were the same, i.e.,
Portuguese Journal of Finance, Management and Accounting. ISSN: 2183-3826. Vol 2, Nº 4, September 2016
60
mutual fund flows contain statistically significant information about the macroeconomic variables but the macroeconomic variables does not contain information about mutual fund flows. This result was supported by the Granger causality F-test. Moreover, he concluded that both stock returns and mutual fund flows contained partly redundant information about future economic activity and that is why the co-movement between them exists. Furthermore, he found that both variables are forward-looking and are able to help predict the economic activity.Kopsch et al. (2015) relied on Swedish quarterly data on mutual fund flows over the period 1998-2013. Similar to Jank (2012), the authors found support for the information-response hypothesis: stock market returns and flows to mutual funds commonly react to financial and macroeconomic information. Additionally, the authors find new financial variables that have predictive power in determining mutual fund flows, namely; market fear (VIX), exchange rate, households’ expectation regarding inflation as well as outflows from mutual bond funds.
Finally, Babalos et al. (2016) examined the effects of the global financial crisis on the relationship between equity fund flows and stock market returns in the US employing monthly data for the period January 2000- August 2015. They found statistically significant causality-in-mean running from stock market returns to equity fund flows in the post-September 2008 period only. This finding lends support to the feedback-trader hypothesis over that period. The study thus shows that the relationship between the two series may not stable over time as it can be significantly affected by periods of crisis.
3. DATA AND METHODOLOGY 3.1. Data
Following Jank (2012), six variables regarding the Portuguese economy are considered in this paper, namely, mutual funds flows, stock market index, and the following macroeconomic variables: GDP growth, industrial production growth, consumption growth and unemployment rate growth. The data covers twelve years from the second quarter of 2000 to the second quarter of 2012. Data on aggregate flows into equity mutual funds and on the total amount under management by each fund were provided by APFIPP
Portuguese Journal of Finance, Management and Accounting. ISSN: 2183-3826. Vol 2, Nº 4, September 2016
61
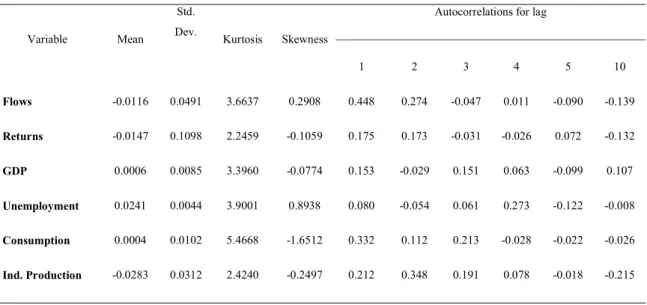
(Associação Portuguesa de Fundos de Investimento, Pensões e Patrimónios - the Portuguese Association of Mutual Funds) and we calculated quarterly net flows as new subscriptions minus redemptions as a percentage of total market value in the previous quarter. The proxy for the Portuguese market return is the PSI-20 index obtained from NYSE Euronext. All the macroeconomic variables were obtained from INE (Instituto Nacional de Estatística – the National Institute of Statistics).Table 1 shows the descriptive statistics for the variables under study. The figures of the quarterly mean observed in the variables fund flows and stock returns reflect the impact of the financial crisis that strongly affected the Portuguese economy during part of the sample period. The standard deviation of the fund flows and stock returns are higher than the macroeconomic variables which supports the assertion that financial markets tend to be more volatile than the real economy.
Table 1: Descriptive statistics
Variable Mean
Std.
Dev. Kurtosis Skewness
Autocorrelations for lag
1 2 3 4 5 10 Flows -0.0116 0.0491 3.6637 0.2908 0.448 0.274 -0.047 0.011 -0.090 -0.139 Returns -0.0147 0.1098 2.2459 -0.1059 0.175 0.173 -0.031 -0.026 0.072 -0.132 GDP 0.0006 0.0085 3.3960 -0.0774 0.153 -0.029 0.151 0.063 -0.099 0.107 Unemployment 0.0241 0.0044 3.9001 0.8938 0.080 -0.054 0.061 0.273 -0.122 -0.008 Consumption 0.0004 0.0102 5.4668 -1.6512 0.332 0.112 0.213 -0.028 -0.022 -0.026 Ind. Production -0.0283 0.0312 2.4240 -0.2497 0.212 0.348 0.191 0.078 -0.018 -0.215
Besides fund flows and unemployment, the variables present a negative skew. Taking into account the autocorrelations, it is clear that each series is positively auto correlated at lag one. This is particularly significant in the case of fund flows where the lagged autocorrelation presents the highest value. This pattern suggests that an inflow (outflow) is more likely to be followed by another inflow (outflow) of funds.
Portuguese Journal of Finance, Management and Accounting. ISSN: 2183-3826. Vol 2, Nº 4, September 2016
62
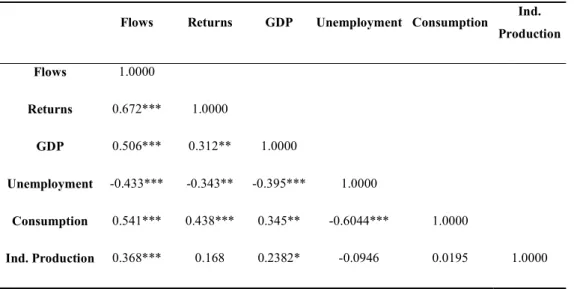
Table 2 below presents the correlations between mutual fund flows, stock returns and the macroeconomic variables under study.Table 2: Correlation matrix
**
Significance at the 5% level, *** Significance at the 1% level.
One can observe a significant co-movement between mutual fund flows and stock returns (correlation coefficient of 0.672 statistically significant at the 1% level).
There are other variables that have presented a high and statistical significant correlation with fund flows, such as the GDP (0.506) and Consumption (0.541). It is also noteworthy that all correlations involving the fund flows are statistically significant. Unemployment has a negative correlation coefficient with all other variables which is consistent with the reasoning that in an economic downturn, consumers tend to reduce their spending provoking a decrease in the proportion of people that are employed.
3.2. Methodology
The empirical study is structured in three parts. In the first part we will test the existence of a possible co-movement between mutual fund flows and stock returns. Thus, we will follow Warther (1995) and Jank (2012) regressing the mutual fund flows both on this lagged variable and on stock market returns. This procedure, whose results will be presented in
Flows Returns GDP Unemployment Consumption Ind. Production Flows 1.0000 Returns 0.672*** 1.0000 GDP 0.506*** 0.312** 1.0000 Unemployment -0.433*** -0.343** -0.395*** 1.0000 Consumption 0.541*** 0.438*** 0.345** -0.6044*** 1.0000 Ind. Production 0.368*** 0.168 0.2382* -0.0946 0.0195 1.0000
Portuguese Journal of Finance, Management and Accounting. ISSN: 2183-3826. Vol 2, Nº 4, September 2016
63
section 4.1., will allow one to test the existence of co-movement between mutual fund flows and stock returns.In the second and the third parts, we will test two implications of the information-response hypothesis as an explanation for the co-movement between mutual fund flows and stock returns. This hypothesis states that both fund flows and stock returns are driven by new information. One of the implications is that if mutual fund flows react to news about future economic activity, then they may contain information about economic activity. In order to investigate this we will apply the notion of Granger-causality adopting a bivariate vector auto regressive (VAR) approach. According to the Hannan-Quinn information criterion with 10 lags, the appropriate lag length was found to be one. The results of this procedure will be presented in section 4.2.
The third part of the empirical study, to be addressed in section 4.3., investigates another implication of the information-response hypothesis, i.e., that mutual fund flows and stock returns are forward-looking in the sense that they help to predict the evolution of economic activity. We will follow Ludvigson (2004) and Jank (2012) running several regressions of variables that proxy for economic activity against the same lagged variables and lagged market returns and/or flows. In this case, the baseline model is the macroeconomic variable regressed against that same variable lagged from one to four periods. Then, we will add the lagged market returns and/or mutual fund flows in order to compute the change in the adjusted . Thus, the purpose of this model is to test whether the lagged market returns and mutual flows provide additional information to the baseline model. If that is the case, we will be able to conclude that these two variables have a forward-looking feature.
4. EMPIRICAL RESULTS
4.1. Mutual fund flows and stock returns
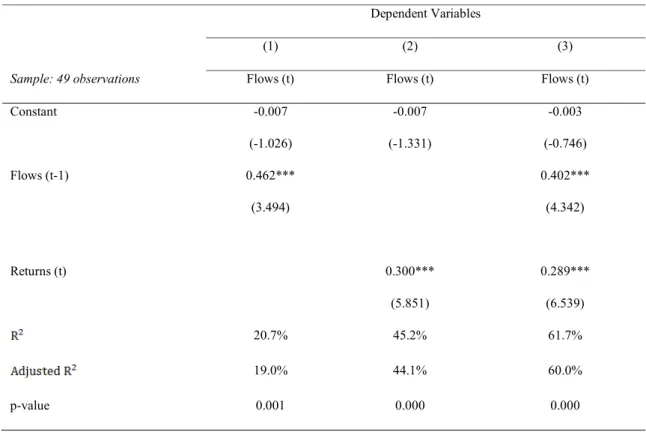
The correlation coefficients presented in table 2 suggest that there was a positive co-movement between mutual fund flows and stock returns. We will explore this hypothesis following the procedure described in section 3.2. The results of the regression of mutual fund flows against lagged flows and contemporaneous market returns are shown in table 3 below.
Portuguese Journal of Finance, Management and Accounting. ISSN: 2183-3826. Vol 2, Nº 4, September 2016
64
Table 3: Mutual fund flows and stock market returnsWhite heteroskedasticity-consistent t-statistics are in parentheses. *** Significance at the 1% level.
In regression (1) mutual fund flows are modeled following an AR (1) model. The results confirm the existence of a significant autocorrelation as mentioned in the analysis of the descriptive statistics. Regression (2) has an higher adjusted which signals a positive correlation between mutual fund flows and stock returns as previously observed in the correlation matrix. The coefficient of stock market returns is 0.300 and it is statistically significant at the 1% level. This coefficient estimate implies that for every percentage point of variation in stock returns, there is an associated 0.3 p.p. of variation in the same direction of the mutual fund flows in the same quarter.
In regression (3), we have included both one period lagged fund flows and stock returns, being that these variables are able to explain 60.0% of the mutual fund flows’ variance and the coefficients are substantially similar to those observed in regressions (1) and (2). Therefore, these two explanatory variables seem to better explain the evolution of mutual fund flows.
Dependent Variables
(1) (2) (3)
Sample: 49 observations Flows (t) Flows (t) Flows (t)
Constant -0.007 (-1.026) -0.007 (-1.331) -0.003 (-0.746) Flows (t-1) 0.462*** (3.494) 0.402*** (4.342) Returns (t) 0.300*** (5.851) 0.289*** (6.539) 20.7% 45.2% 61.7% 19.0% 44.1% 60.0% p-value 0.001 0.000 0.000
Portuguese Journal of Finance, Management and Accounting. ISSN: 2183-3826. Vol 2, Nº 4, September 2016
65
The results presented in tables 2 and 3 suggest that mutual fund flows and stock returns tend to move together. These findings corroborate previous literature which provided evidence of a significant positive relation between fund flows and stock market returns (e.g., Warther, 1995; Edelen and Warner, 2001; Goetzmann and Massa, 2003; Jank, 2012). In the next section we will explore the reasons for such co-movement.4.2. Mutual fund flows and economic activity
As previously stated, the information-response hypothesis has two main implications: First, variables that predict the economic activity should be related to mutual fund flows; secondly, if mutual fund flows react to news about the future economic activity, then mutual fund flows should be able to predict real economic activity.
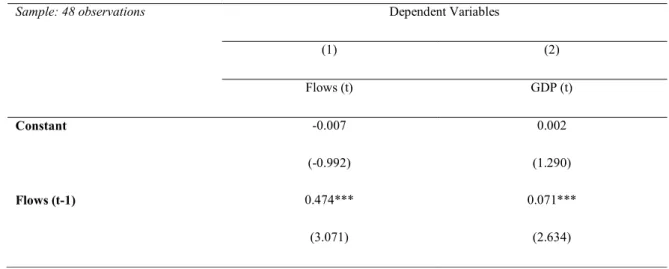
We follow the method described in section 3.2 to test the first implication. Table 4 displays the results of a VAR (1) model of mutual fund flows and GDP growth. The table also presents a Granger causality test. In column (1) is presented the Granger causality F-statistic testing whether GDP Growth causes mutual fund flows and in column (2) whether mutual fund flows causes GDP growth. The results show that mutual fund flows have contained information about GDP growth whereas this variable has not been informative regarding the evolution of mutual fund flows. This is also supported by the results of the Granger causality test.
Table 4: VAR (1) of mutual fund flows and GDP growth
Sample: 48 observations Dependent Variables
(1) (2) Flows (t) GDP (t) Constant -0.007 (-0.992) 0.002 (1.290) Flows (t-1) 0.474*** (3.071) 0.071*** (2.634)
Portuguese Journal of Finance, Management and Accounting. ISSN: 2183-3826. Vol 2, Nº 4, September 2016
66
T-statistics are in parentheses. *** Significance at the 1% level.We can also note that the only statistically significant variable in both equations is the lagged flows.
In table 5 we present the results of a VAR (1) model for mutual fund flows and the industrial production growth. The results suggest that industrial production growth does not contain information about the mutual fund flows whereas mutual fund flows contain information about industrial production growth. We can also observe that the Granger causality test is statistically significant at the 10% level for the industrial production growth equation. However, in this case the results are not so clear, since the F-statistic is smaller than in the previous models for the GDP growth. Furthermore, none of the independent variables is statistically significant in the industrial production growth equation. This suggests that the lagged flows variables do not add explanatory power to the industrial production growth equation. As a matter of fact, in this VAR (1) model, the only statistically significant variable is the lagged flows in the flows equation.
Table 5: VAR (1) of mutual fund flows and industrial production growth
GDP (t-1) -0.140
(-0.156)
-0.044
(-0.281)
Granger causality F-statistic 0.024 6.942
p-value 0.876 0.008
Sample: 48 observations Dependent Variables
(1) (2)
Flows (t) Ind. production (t)
Constant -0.008
(-1.200)
0.004 (0.847)
Portuguese Journal of Finance, Management and Accounting. ISSN: 2183-3826. Vol 2, Nº 4, September 2016
67
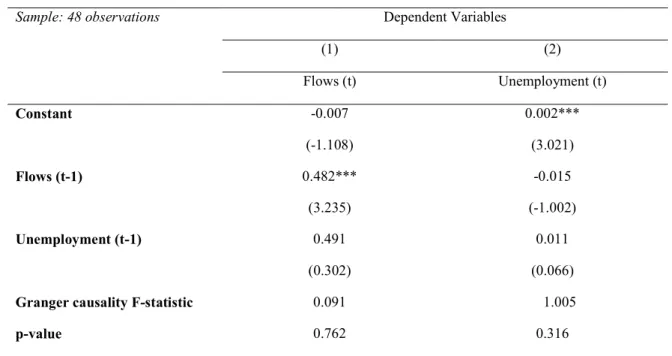
T-statistics are in parentheses. *** Significance at the 1% level.Table 6 below documents the results of a VAR (1) model for mutual fund flows and the unemployment rate growth. In this case the results are significantly different as they suggest that neither the industrial production growth contain information about the mutual fund flows nor the mutual fund flows contain information about industrial production growth. This conclusion is supported by the results of the Granger causality test.
Table 6: VAR (1) of mutual fund flows and unemployment rate growth
T-statistics are in parentheses. *** Significance at the 1% level.
Finally, table 7 below documents the results of a VAR (1) model for mutual fund flows and the consumption growth. The results are similar to the ones referring to the unemployment
(2.803) (0.727)
Ind. production (t-1) 0.209
(0.918)
0.113 (0.727)
Granger causality F-statistic 0.843 2.701
p-value 0.358 0.100
Sample: 48 observations Dependent Variables
(1) (2) Flows (t) Unemployment (t) Constant -0.007 (-1.108) 0.002*** (3.021) Flows (t-1) 0.482*** (3.235) -0.015 (-1.002) Unemployment (t-1) 0.491 (0.302) 0.011 (0.066)
Granger causality F-statistic 0.091 1.005
Portuguese Journal of Finance, Management and Accounting. ISSN: 2183-3826. Vol 2, Nº 4, September 2016
68
rate growth and suggest that neither the consumption growth contain information about the mutual fund flows nor the mutual fund flows contain information about the consumption growth. This conclusion is also supported by the Granger causality test.Table 7: VAR (1) of mutual fund flows and consumption rate growth
T-statistics are in parentheses. ** Significance at the 5% level.
Overall, we may conclude that mutual fund flows contain relevant information about the future evolution of GDP and industrial production. On the other hand, mutual fund flows have had no statistical precedence over the evolution of unemployment and consumption. The macroeconomic variables do not contain information about mutual fund flows, which is in line with Jank’s (2012) findings.
Sample: 48 observations Dependent Variables
(1) (2) Flows (t) Consumption (t) Constant -0.008 (-1.296) 0.001 (0.471) Flows (t-1) 0.363** (2.293) 0.0356 (1.002) Consumption (t-1) 0.861 (1.154) 0.241 (1.47)
Granger causality F-statistic 1.331 1.049
Portuguese Journal of Finance, Management and Accounting. ISSN: 2183-3826. Vol 2, Nº 4, September 2016
69
4.3. Mutual fund flows, market returns and economic activityFrom the results presented in the previous section, we were able to conclude that mutual fund flows contain information about some variables that proxy for economic activity. If that is the case, then mutual fund flows could be useful to predict economic activity. In this section we aim to explore this assertion using the procedure described in section 3.2.
Table 8 below displays the results of a forecasting regression of GDP growth. The baseline model of the forecasting regression (not reported) includes four lags of the dependent variable. The incremental adjusted is the percentage point increase over the baseline model.
Table 8: Mutual fund flows, market returns and GDP growth
Sample: 49 observations Dependent Variable – GDP
(1) (2) (3) Flows (t-1) 0.080*** (4.853) 0.070** (2.265) Returns (t) 0.035*** (3.319) 0.004 (0.326) 24.2 p.p. 18.5 p.p. 22.5 p.p.
White heteroskedasticity-consistent t-statistics are in parentheses. ** Significance at the 5% level, *** Significance at the 1% level.
The results presented in table 8 indicate that mutual fund flows and stock returns help to predict the GDP in addition to its lagged values, since when the fund flows and the stock returns are added to the baseline model, the increases. It can be observed that the incremental adjusted is 24.2 p.p. and 18.5 p.p., respectively, in the case of the addition of the fund flows and of the stock returns. Moreover, both regression coefficients are statistically significant at a 1% level. When both variables are included together, we notice a reduction in regression coefficients as well as in significance for both variables, being that the stock returns coefficient ceases to be statistically significant.
Portuguese Journal of Finance, Management and Accounting. ISSN: 2183-3826. Vol 2, Nº 4, September 2016
70
Table 9 below documents that fund flows add some explanatory power to the industrial production’s baseline model. The fund flows variable is statistically significant at the 5% level and the increases by 8.2 p.p. The fund flows variable alone has the highest incremental and the highest statistical significance. Moreover, the only variable in this table which is statistical significant is the fund flows in regression (1) when only the fund flows are considered.Table 9: Mutual fund flows, market returns and industrial production growth
White heteroskedasticity-consistent t-statistics are in parentheses. ** Significance at the 5% level.
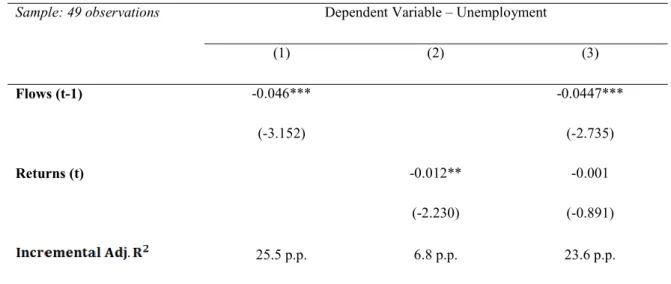
From table 10 below we may observe that all regression coefficients in the three regressions are negative which confirms the negative relation between the unemployment and stock returns/mutual fund flows. The fund flows variable is statistically significant at the 1% level and by itself adds an explanatory power of 25.5 p.p. to the unemployment baseline model. When only the stock returns variable is added to the baseline model, the increase observed in the is much lower, only 6.8 p.p. When both variables are included, stock returns cease to be statistically significant whilst fund flows continue to be statistically significant at the 1% level.
Sample: 49 observations Dependent Variable – Ind. Production
(1) (2) (3) Flows (t-1) 0.200** (2.114) 0.176 (1.133) Returns (t) 0.053 (1.015) 0.014 (0.230) 8.2 p.p. 1.1 p.p. 6.2 p.p.
Portuguese Journal of Finance, Management and Accounting. ISSN: 2183-3826. Vol 2, Nº 4, September 2016
71
Table 10: Mutual fund flows, market returns and unemployment rate growth Sample: 49 observations Dependent Variable – Unemployment(1) (2) (3) Flows (t-1) -0.046*** (-3.152) -0.0447*** (-2.735) Returns (t) -0.012** (-2.230) -0.001 (-0.891) 25.5 p.p. 6.8 p.p. 23.6 p.p.
White heteroskedasticity-consistent t-statistics are in parentheses. ** Significance at the 5% level, *** Significance at the 1% level.
Finally in table 11 below, we report the results of a forecasting regression of the consumption growth. When only the fund flows are added to the baseline model, the increases by 19.8 p.p. and the variable turns out to be statistically significant at the 1% level. When only stock returns are added, the incremental is negative (-0.3 p.p.). With both variables, the incremental reaches 20.3 p.p., the higher variation among the three regressions under consideration.
Table 11: Mutual fund flows, market returns and consumption growth Sample: 49 observations Dependent Variable – Consumption
(1) (2) (3) Flows (t-1) 0.099*** (3.126) 0.065* (1.774) Returns (t) 0.015 (1.066) 0.02 (1.302) 19.8 p.p. -0.3 p.p. 20.3 p.p.
White heteroskedasticity-consistent t-statistics are in parentheses. * Significance at the 10% level, *** Significance at the 1% level.
Portuguese Journal of Finance, Management and Accounting. ISSN: 2183-3826. Vol 2, Nº 4, September 2016
72
In this section we have tested the forecasting ability of fund flows and stock market returns. Overall, the results suggest that mutual fund flows help to predict the economic activity in addition to its lagged values, because when the flows are included in the baseline model, the tends to increase. The observed increase varied between 8.2 p.p. and 25.5 p.p. depending on the variable under analysis. Moreover, when only the mutual fund flows variable is added to the baseline model, its coefficient was always statistically significant at conventional levels.Regarding the inclusion of the stock returns variable, a similar conclusion can be drawn, which is in line with the findings of other authors (e.g., Fama, 1990; Schwert, 1990; Jank, 2012). In this case, the incremental adjusted presents a negative value for the consumption model which is -0.3 p.p. and it reaches the maximum value of 18.5 p.p. for the GDP. It is also worth noting that the addition of mutual fund flows to the baseline model of each macroeconomic variable has led to a higher increase of the adjusted than in the case of the addition of stock returns.
When both stock returns and mutual fund flows were added to the baseline model for the consumption growth rate, the incremental adjusted increased in comparison with the regressions that contained only one of those variables. In all other cases it happened just the opposite which denotes redundant information contained by both variables about future economic activity.
5. CONCLUSION
In this paper we started by investigating the existence of a co-movement between mutual fund flows and stock returns in the Portuguese market. We found a strong positive relationship between the two variables. Our findings are consistent with similar studies (e.g., Warther, 1995; Edelen and Warner, 2001; Jank, 2012).
Then, we examined whether the investor reaction to information could explain the co-movement between fund flows and stock returns. Our results have confirmed that mutual fund flows contain statistically significant information about the Portuguese GDP growth. Finally, our results provided evidence that both mutual fund flows and stock returns, help to predict some of the variables that proxy for economic activity. This means that investors
Portuguese Journal of Finance, Management and Accounting. ISSN: 2183-3826. Vol 2, Nº 4, September 2016
73
tend to sell the stocks they own or liquidate their shares in mutual funds before periods of crisis and tend to buy stocks or shares in mutual funds when anticipating periods of higher economic growth. The fact that those variables are forward-looking is in line with the results obtained by other authors (e.g., Jank, 2012).The results presented in this paper have important implications for the agents who need to predict the evolution of economic activity to the extent that they suggest that financial variables can be used as leading indicators in those forecasts.
The results presented in this article suffer from some limitations related to the characteristics of the sample under study. Among these features we highlight the fact that the selected sample covers a period marked by a severe recession in the Portuguese economy. Taking this into account, we believe that in future research it would be interesting to study the impact of different economic cycles (expansionary vs. recessionary periods) in the relationship between financial and real variables and to explore the potential diverse predictive capabilities of different types of mutual funds (equity funds, bond funds, etc.).
REFERENCES
Alexakis, C., Dasilas, A. and Grose. C. (2013). Asymmetric dynamic relations between stock prices and mutual fund units in Japan. An application of hidden cointegration technique. International Review of Financial Analysis, 28, 1-8.
Babalos, V., Caporale, G. M. and Spagnolo, N. (2016). Equity Fund Flows and Stock Market Returns in the US before and after the Global Financial Crisis: A VAR-GARCH-in-Mean Analysis. Working Paper.
Birz, G. and Lott, J. R. (2011). The Effect of Macroeconomic News on Stock Returns: New Evidence From Newspaper Coverage. Journal of Banking & Finance, 35(11), 2791-2800.
Boyd, J., Jagannathan, R. and Hu, J. (2001). The Stock Market's Reaction to Unemployment News: Why Bad News is Usually Good for Stocks. NBER Working Paper nº 8092. National Bureau of Economic Research.
Chen, N. F., Roll, R. and Ross, S. A. (1986). Economic Forces and the Stock-Market. Journal of Business, 59(3), 383-403.
Portuguese Journal of Finance, Management and Accounting. ISSN: 2183-3826. Vol 2, Nº 4, September 2016
74
Coelho, M. (2005). Ensaios Sobre a Relação Entre Macroeconomia e Mercado Accionista(PhD Dissertation). Instituto Superior de Economia e Gestão, Universidade Técnica de Lisboa, Lisbon.
Delong, J. B., Shleifer, A., Summers, L. H. and Waldmann, R. J. (1990). Positive Feedback Investment Strategies and Destabilizing Rational Speculation. Journal of Finance, 45(2), 379-395.
Duca, G. (2007). The Relationship Between the Stock Market and the Economy: Experience from International Financial Markets. Bank of Valletta Review, 36, 1-12. Edelen, R. M. and Warner, J. B. (2001). Aggregate Price Effects of Institutional Trading: A Study of Mutual Fund Flow and Market Returns. Journal of Financial Economics, 59(2), 195-220.
Fama, E. F. (1970). Efficient Capital Markets - Review of Theory and Empirical Work. Journal of Finance, 25(2), 383-423.
Fama, E. F. (1981). Stock Returns, Real Activity, Inflation, and Money. American Economic Review, 71(4), 545-565.
Fama, E. F. (1990). Stock Returns, Expected Returns, and Real Activity. Journal of Finance, 45(4), 1089-1108.
Fama, E. F. and Schwert, G. W. (1977). Asset Returns and Inflation. Journal of Financial Economics, 5(2), 115-146.
Goetzmann, W. and Massa, M. (2003). Index Funds and Stock Market Growth. Journal of Business, 76(1), 1-28.
Harris, L. and Gurel, E. (1986). Price and Volume Effects Associated with Changes in the Standard-and-Poor-500 List - New Evidence for the Existence of Price Pressures. Journal of Finance, 41(4), 815-829.
Humphrey, J., Benson, K. L. and Brailsford, T. J. (2013). Do Fund Flow-Return Relations Depend on the Type of Investor? Abacus: A Journal of Accounting, Finance and Business Studies, 48(1), 34-45.
Indro, C. D. (2004). Does Mutual Fund Flow Reflect Investor Sentiment? Journal of Behavioral Finance, 5(2), 105-115.
Jaffe, J. F. and Mandelker, G. (1976). Fisher Effect for Risky Assets - Empirical-Investigation. Journal of Finance, 31(2), 447-458.
Portuguese Journal of Finance, Management and Accounting. ISSN: 2183-3826. Vol 2, Nº 4, September 2016
75
Jank, S. (2012). Mutual Fund Flows, Expected Returns, and the Real Economy. Journal ofBanking & Finance, 36(11), 3060-2070.
Kopsch, F., Song, H. and Wilhelmsson, M. (2015). Determinants of Mutual Fund Flows. Managerial Finance, 41(1), 10-25.
Ludvigson, S. (2004). Consumer Confidence and Consumer Spending. Journal of Economic Perspectives, 18(3), 29-50.
Pindyck, R. S. (1984). Risk, Inflation, and the Stock-Market. American Economic Review, 74(3), 335-351.
Rakowski, D. and Wang, X. X. (2009). The Dynamics of Short-Term Mutual Fund Flows and Returns: A Time-Series and Cross-Sectional Investigation. Journal of Banking & Finance, 33(11), 2102-2109.
Ritter, J. R. (2005). Economic Growth and Equity Return. Pacific-Basin Finance Journal, 13(5), 489-503.
Schwert, G. W. (1990). Stock Returns and Real Activity – a Century of Evidence. Journal of Finance., 45(4), 1237-1257.
Warther, V. A. (1995). Aggregate Mutual Fund Flows and Security Returns. Journal of Financial Economics, 39(2-3), 209-235.
How to cite this article:
Lobão, J. & Levi, A. (2016). The relation between mutual fund flows, stock returns and macroeconomic variables: evidence from Portugal. Portuguese Journal of Finance, Management and Accounting. 2 (4), 54-75. Disponível em http://u3isjournal.isvouga.pt/index.php/PJFMA