Disclosure of tax incentives and the corporate
liabilities in Brazilian public companies: a quantitative
study
Henrique Formigoni, Liliane Cristina Segura*
and Flavio Roberto Mantovani
CCSA – Center of Applied Social Science, Presbyterian Mackensie University,
Rua da Consolação, 930, 01302-907, São Paulo, Brazil Email: hformigoni@mackenzie.br
Email: liliane.segura@mackenzie.br Email: flavio.mantovani@mackenzie.br *Corresponding author
Francisco Alegria Carreira
Department of the Business and Administration School, Instituto Politécnico de Setúbal, Portugal
Email: francisco.carreira@esce.ips.pt
Rute Abreu
Instituto Politécnico da Guarda,
Business and Economics Scientific and Technical Unit, Technology and Business Higher School at
the Instituto Politécnico da Guarda, Portugal Email: ra@ipg.pt
Abstract: This article aims to evaluate the effect of tax incentives on the
liability level of firms listed in Brazilian Stock Exchange. Obtaining the tax incentives require many investments from the company. This paper contributes with the literature to identify if the companies that disclosed their fiscal incentives have any changes in their debt, because of these investments. The final sample was 382 firms, for the years 2010–2013, and with a total of 1,528 observations. We used a regression model for the panel data in order to estimate the relation between liabilities and the fiscal incentives. The results show that encouraged firms have higher long-term debt and total debt than those who are not encouraged. In addition, the authors found a positive relationship between the assets of these companies and the tax incentive.
Keywords: tax incentives; disclosure; liabilities; Brazil; public companies. Reference to this paper should be made as follows: Formigoni, H.,
Segura, L.C., Mantovani, F.R., Carreira, F.A. and Abreu, R. (2016) ‘Disclosure of tax incentives and the corporate liabilities in Brazilian public companies: a quantitative study’, Int. J. Auditing Technology, Vol. 3, No. 2, pp.95–112.
Biographical notes: Henrique Formigoni is an Accounting Professor and
researcher at the Center of Applied Social Science of Mackenzie Presbyterian University in São Paulo, Brazil. He received his Pos-Doctorate from Universidad de Salamanca, Espanha in 2012, PhD in Accounting from FEA/USP in 2008, and Master of Science in Accounting from PUC/SP in 1999. He is the coordinator of Master in Controllership at Mackenzie Presbyterian University. His fields of study corporate tax, corporate governance, corporate social responsibility and financial accounting.
Liliane Cristina Segura is an Accounting and Finance Professor at the Center of Applied Social Science of Mackenzie Presbyterian University in São Paulo, Brazil. She received her Master’s degree in Business Strategy from the University of São Paulo, Brazil in 2003 and her PhD in Accounting and Finance from Mackenzie Presbyterian University in São Paulo, Brazil and Post-Doctoral Study in Accounting and Finance from the Universidad de Salamanca, Spain. She worked as Director and Manager in several Brazilian companies for 15 years and currently works as a researcher and Professor at Mackenzie Presbyterian University. Hers fields of study corporate governance, corporate social responsibility and financial accounting.
Rute Abreu is an Accounting and Finance Professor in the Business and Economics Scientific and Technical Unit of the Technology and Business Higher School at the Instituto Politécnico da Guarda, Portugal. She received her Master’s degree in Industrial Engineering from the Universidade Nova de Lisboa, Portugal in 1996, and her PhD degree in Accounting and Finance from the Universidad de Salamanca, Spain in 2009. Since 2010, she has been the Director of the Master of Integrated Management Systems (Quality, Environment, Security and Social Responsibility) and works on activities with a social responsibility research network; researches and publishes papers in several journals; and participates frequently in conferences and meetings all over the world.
Flavio Roberto Mantovani holds a PhD in Accounting and Controlling from the University of São Paulo – USP. He held controller and CFO positions in multinational companies. He is also partner of SDS Consulting in Accounting and Finance. He is the speaker and author of several academic articles. Francisco Alegria Carreira is an Accounting Full Professor in the Accounting and Finance Department of the Business and Administration School at the Polytechnic Institute of Setúbal, Portugal. He received his PhD degree in Business Science, specialty in Accounting from the Autonomous University of Madrid, Spain in 2003 and his Master’s degree in Management from the University of Lisbon, Portugal in 1992. Since 2014, he has been the Director of the Accounting and Finance Department and works on activities with a social responsibility, environmental accounting and sustainable development and taxation; researches and publishes papers in several journals and participates frequently in conferences and meetings national and international.
1 Introduction
Although the chief function of taxes is providing resources for the State to realise its constitutional activities for the benefit of the population, additionally, taxes work for different reasons such as, social, political and economic matters and it acquires an
extra-fiscal configuration, denominated tax waivers, in which tax incentives are created. The income tax exemptions for legal entities located in specific geographic areas is an example of the extra-fiscal nature of the taxes in Brazil (Fabretti, 2000; De Luca and Lima, 2007; Elali, 2007; Monteiro, 2007).
Rodrigues (2007) states that in Brazil companies that make use of tax incentives have a competitive advantage over others. In the USA, research indicates that some kinds of tax-free businesses have an advantage over their taxed competitors, providing them with opportunities of wealth concentration as well as greater growth (Guthmann, 1951; Goddard et al., 2002). In the same way, Tatom (2005) studied the effects of the tax exemption of credit unions in the USA and observed that such an exemption has an effect of increasing total assets as well as the total index of shareholders’ equity/assets in such institutions.
If tax exemption increases the relation between shareholders’ equity and total assets, that is, it increases its own capital participation; it is supposed that tax exemption causes a reduction of the liabilities regarding the composition of the capital structure. Tax exemption also causes the reduction of income tax rate of a company, connected to the theory proposed by Modigliani and Miller (1958, 1963), which states that the indebtedness of a company causes a gain due to the leverage from the result between the income tax of the company and the debt market value. The higher the income tax of the company, the greater the gain of the leverage and, consequently, the greater the stimulus for the indebtedness. The effective rate of income tax tends to be lower for the companies that make use of tax incentives; that being so, the stimulus for the indebtedness in such companies will be smaller, and may cause a capital structure different from the ones whose companies do not make use of tax incentives.
It is observed that the studies concerning tax incentives performed in Brazil and abroad suggest an increase in the profitability of companies that make use of tax incentives as well as a particularity in the capital structure of such companies (Frischmann et al., 2008; Ramírez et al., 2014). De Luca and Lima (2007) say that tax incentives, despite being classified as a very important source of capital, do not affect the total volume of liability of a company. As a result of the issues presented, the question examined by the study is:
What is the liabilities behaviour in public companies whom disclosure tax incentives and the others that do not disclosure?
Thus, this article aims to evaluate the effect of tax incentives on the liability level of such companies.
Although many tax incentives have been determinate by the Brazilian Government in the past, in order to develop some sectors of the economy, few studies have taken the tax incentives as determinant to influence the structures of the company. Some studies analysed the effects of fiscal incentives in many perspectives (Lacombe, 1969; Cardoso, 1971; Santos and Candiota; 1974; Roesch 1984, 1990; Durand et al., 1997; Perobelli and Famá, 2002; Ponciano and Campos, 2003; De Luca and Lima, 2007; Formigoni et al., 2008; Scharlack, 2008; among others). Obtaining the tax incentives require many investments from the company. However, we could only found the study of Perobelli and Famá (2002) that has studied the debt and the fiscal incentives and concluded that this company does not have incentives for raising the debt. In this way, this paper contribute with the literature to identify if the companies that disclosure the fiscal incentives has any
considerations, it is important to know that they will have or not changes in their debt because the use of the tax incentives.
The remainder of this paper is organised as follows. The second section will conceptualise in the literature review the theme of tax incentives, with particular emphasis on the agency theory conflict in the current institutional framework. The third section will present the awareness complexities that are involved in capital structure decisions, in order to propose a model with a hypothesis to test and to discuss the corporation tax incentives in relation to debt presented in the literature review. The fourth section will present the methodology, in order to conduct a longitudinal exploratory analysis, based on panel data carried out in the period from 2010 to 2013, about companies listed on the Bovespa (Brazil) Stock Exchange. The fifth section will be dedicated to presenting the discussion based on the empirical analysis of the corporate control and capital structure decisions. Finally, the last section summarises and it will contribute to the debate of the corporate tax incentives and on the liability decision level within the Brazilian context.
2 Conceptual framework
2.1 Definition of tax incentives
Tax incentives are waiving of public income that benefits the tax payers. It is based on instruments of tax reduction where the State gives a different tax treatment to the tax payer, having the objective, for example, of promoting the regional economic development; and reducing national and regional social differences (Shah, 2006; De Luca and Lima, 2007; Melo, 2007; Pires, 2007).
It is necessary to highlight that tax incentives do not aim to privilege the tax payer, but, to promote actions or behaviours on behalf of society, such as: exemptions; aliquot and calculation basis reduction; zero aliquot; subsidies, presumed credits; and deferment. In conclusion, a juridical rule that is not linked to the promotion of the common good cannot be classified as a tax incentive, being named a tax benefit, generating privilege directly connected to the tax payer (Diniz and Ribeiro, 2004; Elali, 2007; Rodrigues, 2007).
We can observe that tax incentives do not aim towards the privilege of the tax payer, though initially they have it as a consequence. They cause an effect of inequality in the competition with other tax payers that do not make use of the incentives. In the economic plan, the concepts of tax benefits, incentives and exemptions are comprehensive, achieving any mechanism of exoneration or tax burden reduction that causes the same effect as the exemptions (Torres, 2007); there is no conceptual common sense about the comprehension of these terms (Pires, 2007).
In general, what there is in common between tax benefits and tax incentives is the facts that both relate to tax issues and work towards diminishing or eliminating the effects of taxes. The difference between them is that the benefit exists to solve harmful past results, while the incentive creates positive results in the future.
2.2 Studies about tax incentives in Brazil
Lacombe (1969) explains that, since 1930, substantial modifications have taken place in the political and fiscal theory highlighting the natural inequality among several regions in Brazil. The increase of tax burden, which occurred mostly with the Second World War, was, at the same time, cause and effect of the extra fiscal aspect, then assumed by the fiscal policy.
The Amazon was a poor region and because of tax incentives had a significant increase in the volume of investments to implement projects in the region. The revaluation of fixed assets (Governo do Brasil, 1958) on projects implemented with its own resources generated incentives to deduct income tax (Cardoso, 1971).
Santos and Candiota (1974) found that tax incentives, from income tax exemption on interests and commissions concerning estate financing, among other factors, had a relevant effect on the profitability of the assets of the savings and loan associations, enabling them to have greater growth.
Roesch (1984) evaluated the economical efficiency of governmental politics related to tax incentives with professional formation in companies, from 1976 to 1980, and concluded that tax incentives helped the more profitable companies. In another study, from 1976 to 1982, Roesch (1990) evaluated the government expectation that the training incentive program would be a relaxation instrument of regional income; she concluded that it tends to benefit, primarily, large firms, ratifying the previous study.
Durand et al. (1997) studied cultural tax incentives – donations and sponsorships – and found that the areas of sport, environment, social assistance and education, science and technology were the most used resources for institutional strengthening of image. They concluded that the number of companies to opt for the tax incentives related to the culture increased and that most of the cultural incentive laws did not cause real results in intensity to allow an evaluation.
Perobelli and Famá (2002) claim that the companies who have other tax incentives, those that are not generated by debt such as tax incentives, should have less incentive for debt, and they would take less advantage of the tax incentives generated by the payment of interest.
Ponciano and Campos (2003) evaluated the effects of tax relief on exports of agricultural and agribusiness activities concerning the economy performance. They concluded that the elimination of taxes on these activities causes a slight recessive effect on the Brazilian economic activity level, causing a decrease in the family’s income. The tax elimination on the export of agriculture and cattle farming products as well as the textile agribusiness, fertilisers and coffee makes these activities more competitive in the foreign market, causing a reduction in rural unemployment, due to the expansion of exports of products in these activities and an increase in urban unemployment due to a drop in the level of other activities.
De Luca and Lima (2007) studied the importance of tax incentives granted by the State of Ceará to the beneficiaries and the effect on their assets, with financial statements of the company Grendene SA, in the years 2003 to 2004 and concluded that:
1 shareholders’ equity was impacted materially and increased due to the of tax incentives
2 the amounts financed through tax incentives accounted for 30% of the total value of the debt burden
3 the share of tax incentives in relation to company’s results was relevant, influencing directly to improve economic and financial ratios over time.
Formigoni et al. (2008) studied the relation between the tax benefits from the Industrial Technological Development Program and social economic development offered by the company permitting an evaluation by the participants in these projects, the government, company and the society. The results showed there was no significant statistical relation between the benefits involving the Industrial Technological Development Program and the social economic program by the companies. The authors clarified that, although it would not have been possible to ratify the research hypothesis, also, it cannot be stated that the companies do not provide the social economic program to their employees because there is a time gap between the benefit from such programs and the repercussion on the employees’ development social program.
Scharlack (2008) explains the benefits of taking advantage of incentive, systematic and official programs in order to lead company planning, by doing so, assuring safe economy of tax, resources optimisation and as consequence an increase in competitiveness. He warns us that the risks of reducing tax expenses by the adoption of an official program is, with any doubt, infinitely lower than when tax planning is administrated. He argues that when one opts for one or more tax incentives, the cost is reduced and the return of investments is increased, without increasing the tax risk and is to the benefit of public interest.
2.3 Other studies about tax incentives
Guthmann (1951) examines the tax exemption of income tax as a competitive factor in business in the USA, through the consumer cooperatives and cooperative purchasing of farmers that compete with other commercial enterprises. He claims that a differential tax treatment can be a deciding factor for companies exempt from taxes, giving them an advantage over other taxed companies, regardless of their comparative efficiency.
Similarly, Somers (1951) states that tax exemption is a powerful economic political weapon. His studies about tax-free entities in the USA involved in competitive business with companies subject to taxation. He concluded that tax exemption enables price reduction, causing an increase in sales.
Harriss (1954) explains that tax benefits are given to motivate activities that have not presented tendencies to stand their own expenses. He states that in the USA it is very difficult to obtain the necessary data to determine with reasonable accuracy the amount of tax exemptions on income, goods and sales. However, he warns that the amounts are great and probably will be greater in the future. He concluded that the more the taxes increase, the more tax exemption increases as well and that in practice, the subsidising policy, such as exemptions, is not re-checked when changes in taxes alter the value of an existent exemption.
Croteau (1956) tries to determine if there are qualitative and/or quantitative differences among big, (those that have assets higher than $1 million) credit unions in the USA. He found no significant difference among the credit unions of different sizes.
Black and Dugger (1981) study the structure of credit unions, the sector situation and the developing character of the institutions in relation to the market power and regulators,
in order to verify the capacity of the credit unions to absorb credit risks due to legal, regulating and competitive changes. They state that from the period 1976 to 1980 the capital of credit unions decreased year by year. The index capital/asset was reduced from 8% in 1970 to 6.3% at the end of 1979. They concluded that the release of the Monetary Control and the deregulation Act of 1980, authorising the payment of interest in the accounts transactions and loans to customers to economic institutions, increased the competitive capacity of the banks and of the savings and loans associations.
Barron et al. (1994) argue that the organisations get older and become more vulnerable to the competition of new companies, who are more innovative and dynamic. Nevertheless, there is an alternative view that big companies benefit from the experience, ability to form new partnerships and the exercising of market power. In order to check the relevance of these rival hypotheses, still in the research line on credit unions, the age is included as an explanatory variable in the multivariate analysis. A variation of temporal series of the financial structure of the credit union and performance indicators are, equally, included in the multivariate analysis. The statistical evidence suggests that: a a credit union with above-average growth in a period, has a below average growth in
the next
b small credit unions tend to have small variability in terms of growth than the bigger ones
c among the state credit unions, the big ones grow faster than the small ones. In the case of federal credit unions, the opposite takes place.
Goddard et al. (2002) investigate the credit unions growth in the USA, in a final sample of 7.603 cooperatives, from 1990 to 1999 and like Smith (1986), Amburgey and Dacin (1993) and Barron et al. (1994) they used the total of assets as a standard for one of the measurements of size of the company. They concluded that the non-regulation of credit unions since 1970 created new opportunities of growth and of concentration in the area.
Hannan (2002) highlights various studies that show evidence of competitive interactions between banks and credit unions, such as: Emmons and Schmid (1999, 2000a, 2000b), Tokle and Tokle (2000), Feinberg (2001, 2002a, 2002b) and Hannan and Prager (2001). He analysed the impact of the presence of credit unions in the customer deposit market and found that the deposit rates offered by the banks were lower than ones offered by the credit unions.
Tatom (2005) evaluates the consequences of federal tax exemption of credit unions in the USA and found that tax reductions appear as retained earnings in the equity of such cooperatives. The extra profit, invested again in the cooperative, provides new capital that permits it to grow faster than other institutions. He concluded that the dominant effect of the tax exemption is to boost the index of equity (shareholders’ equity-assets) of the credit unions.
All in all, we can observe that in the USA there is a research line that studies the credit unions and commercial banks that compete in the same consumer market; however, the first ones are tax free while the second ones are taxed. The interest in this line of research is probably due to the relevance of the total funds handled in total transactions, the fact that both sectors compete in the same market and the fact that one is taxed and the other not.
3 Methodology
The methodology describes the research population and sample, the dependent, independent, and control variables, and presents the analysis techniques in detail.
3.1 Research population and sample
According to fundamentals proposed by Popper (1975), this research develops a hypothetical deductive study. It is characterised by the establishment of hypotheses to be tested through empirical research, namely, the observation of reality. The data used for hypothesis testing was econometric analysis using multiple regressions (Hair et al., 2005; Wooldridge, 2006; Greene, 2012) and, because of it, this is a quantitative study with empirical analysis.
The set of firms in the sample was obtained from those who were active in the year 2013 on the list of the Brazilian Stock Exchange (hereafter, BM&FBovespa). Those firms without accounting data, missing information and with financial economic activity, due to peculiar characteristics, were excluded. After the depuration process, the final sample was 382 firms, for the years 2010–2013, and with a total of 1,528 observations. The information about the fiscal incentives was collected in two databases: if the firm is part of the list of incentive firms by BM&FBovespa (taking 1 if they are on the list, 0 otherwise) and the amount of incentive earnings disclosed on the reported cash flow. Another process of confirmation has been made for the data collected and verification of consistencies during the years 2010–2013. It was possible to corroborate that some firms did not have data for all the years observed, so, the authors used an unbalanced panel.
3.2 Hypothesis
Tax exemptions increase the relation between shareholders’ equity and total asset, that is, they increase their own capital participation (Tatom, 2005); it is supposed that tax exemption causes a reduction of the liabilities regarding the composition of the capital structure. Considering that, tax exemption also causes a reduction of the income tax rate of a company, connected to the theory proposed by Modigliani and Miller (1958, 1963), which states that the indebtedness of a company causes a gain due to the leverage from the result between the income tax of the company and the debt market value.
The higher the income tax of the company, the greater the gain of the leverage and, consequently, the greater the stimulus for the indebtedness. The effective rate of income tax tends to be lower for the companies that make use of tax incentives; that being so, the stimulus for the indebtedness in such companies will be smaller, which may cause a capital structure different from the ones whose companies do not make use of tax incentives.
Due to the literature and considering that there is much research that pointed to a negative relationship between fiscal incentives and liabilities (Perobelli and Famá, 2002), and also, some studies that also pointed out that there is no relationship between fiscal incentives and liabilities (De Luca and Lima, 2007), we have formulated the following hypothesis:
H1 Companies who disclosure fiscal incentives presents less liability than others that do not disclosure.
3.3 Research design and variables definitions
In order to test the hypothesis proposed in this article, we used a regression model for the panel data in order to estimate the relation between liabilities and the fiscal incentives. According to Hsiao (2007), panel data models allow us to obtain a more accurate inference, because a larger number of observations are used, and, in this way, there are more degrees of freedom and the efficiency of the model is enhanced. Also, it is used to control omitted variables (missing or unobservable), and also to capture the unobservable heterogeneity among individual units over time. Because of this, it derives more accurate predictions for individual outcomes.
Using panel data enables us to assess the behaviour of liabilities over time by analysing observations from several consecutive years for the same sample companies. Moreover, considering the temporal dimension of the data, particularly in periods of great change, it could bring a more detailed study. In this regard, panel data enable us to control for the effects that fiscal incentives may experience each year, providing the analysis with a certain degree of dynamism and achieving both greater consistency and better explanatory power. Panel data also allow more information to be obtained on the same parameter, leading to greater efficiency.
The parameters were estimated consistently (and with standard error) in the model in order to lead to valid inferences. In this way, this research relies on the literature for estimators that can deal with different endogeneity problems. Nevertheless, even the most robust methods are not able to deal with all endogeneity problems, given the inconsistency of the model. Indeed, Pindado and Requejo (2012) stated that panel data are adequate for model specification and testing but warn against making predictions, because in the estimation process part of the error term (i.e., the unobservable heterogeneity) was eliminated. Lee (2007) also argued that the consistency of parameter estimators and the validity of their economic interpretations as marginal effects depend on the correct functional form specification and controlling for unobserved heterogeneity.
3.4 Dependent and explained variables
The variable used in this study was drawn from other researchers that examine the capital structure decisions. The Brazilian companies have been studied by Strong (2005), Brito et al. (2007), Soares and Kloeckner (2008), Barros (2005), Anderson and Reeb (2003) and Acharya and Viswanathan (2011) and Segura et al. (2014). So, the conceptualisation of this research is the same. The dependent variable is the debt, represented by the abbreviation end, and it could be analysed by different liabilities levels.
• Total liabilities (TotLiab): Include the Total debt of company i in year t; composed by the current liabilities of corporation i in year t; non-current liabilities of company i in year t; divided by the Total of Assets of the company i in year t.
• Total financial liabilities (TotalFinLiab): Was treated by several authors (Barros, 2005; Strong, 2005; Anderson and Reeb, 2003; Segura et al., 2014) as a measure of the financial leverage on the company. The calculation represented financial liabilities, that it is the company debt (including commercial papers and bonds, excluding debentures) in year t; composed by the short term financial liabilities (i, t), that is the financing debt with financial institutions for short-term of the company i in year t; and non-current financial liabilities (i, t), that is the financing debt with financial institutions for long-term of the corporation i in the year t; both divided by the total of assets of the corporation i in year t.
• Non-current financial liabilities (NCFinLiab) that is the financing debt with financial institutions for long-term of the company i in the year t; divided by the Total of assets of the company i in year t (Brealey and Myers, 2007; Damodaran, 2007; Brigham and Ehrhardt, 2009; Penman, 2013).
• Current liabilities (CurrentLiab) measures the short-term debt made by the corporation, whether as their accruals, whether on account of short-term debt and knowing that is the short-term debt of corporation i in year t divided by the total assets of corporation i in year t (Brealey and Myers, 2007; Damodaran, 2007; Brigham and Ehrhardt, 2009; Penman, 2013).
• Non-current liabilities (NCLiab) measures the long-term debt made by the company and was composed by total non-current liabilities of company i in year t divided by the total assets of company i in year t (Brealey and Myers, 2007; Damodaran, 2007; Brigham and Ehrhardt, 2009; Penman, 2013).
3.5 Independent and explanatory variables 3.5.1 Independent variables
• Disclosure of tax incentives (TI): Is a categorical variable with the value of the company which has disclosured or does not have disclosured tax benefits. Tax incentives will be identified by a binary variable by 1, if it has tax incentives and 2 if it does not have tax incentives. The tax incentive was identified by the business listing complied by the BM&FBovespa.
• Disclosure of benefits and tax incentives (BenefTaxInc): Is the value of the benefits of the tax incentives disclosured from the Cash Flow Statement of the company i in year t. (Brealey and Myers, 2007; Damodaran, 2007; Brigham and Ehrhardt, 2009; Penman, 2013).
3.5.2 Control variables
• Size: Is a numeric variable that represents the firm size and is measured by the logarithm of total assets of the company i in year t. According to agency theory, larger firms have greater visibility in the market and society and tend to be more compliant in the production of information (Bonsón and Escobar, 2004; Craven and Marston, 1999; Gul and Leung, 2004; Marston and Polei, 2004; Oyelere et al., 2003; Prencipe, 2004).
• Sector: Is a categorical variable that represents the major economic sector activity. It takes values between 1 and 6, and has often been used in studies to eliminate from the expected results the effect of the economic sector activity in which the firm operates.
• Plant and equipment (Plant&Equip): Is the total amount disclosed on the Balance Sheet divided by the total assets of the company i in year t (Brealey and Myers, 2007; Damodaran, 2007; Brigham and Ehrhardt, 2009; Penman, 2013).
• Investments (Invest): Is the total investments disclosed in the balance sheet divided by the total assets of the company i in year t (Brealey and Myers, 2007; Damodaran, 2007; Brigham and Ehrhardt, 2009; Penman, 2013).
• Earnings = Total earnings: Is the total earnings disclosure in the balance sheet divided by the total assets of the company i in year t (Brealey and Myers, 2007; Damodaran, 2007; Brigham and Ehrhardt, 2009; Penman, 2013).
• Return on equity (ROE): Focuses on just the equity component of the investment and is the quotient of the net income by the book value of the equity of the company i in year t (Brealey and Myers, 2007; Damodaran, 2007; Brigham and Ehrhardt, 2009; Penman, 2013).
• Working capital (WCP): is the cash conversion cycle or the value of the time lag between the expenditure for the purchases of raw materials and collection of sales of finished goods (Deloof, 2003).
The authors used the Arellano and Bond (1991) and Arellano and Bover (1995) method called the generalised method of moments (GMM). The GMM is indicated for cases in which the time variable (‘T’) is small and the number of variables (‘N’) is high. This method is also suitable when there are independent variables that are not strictly exogenous and are possibly also correlated with the error. This panel uses fixed effects and assumes that there is heteroskedasticity and autocorrelation among individuals.
4 Results
4.1 Descriptive analysis
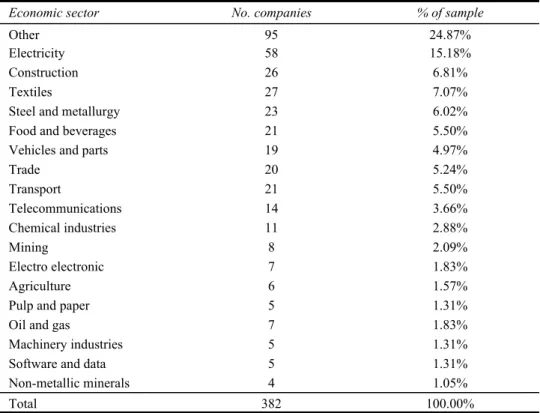
Following the opinion of Hair et al. (2005), with regards the sample size as a general rule, the minimum is to have at least five times as many observations as there are variables to be analysed. Table 1 presents the sample size of 382 companies and represents a subset of the population of companies in Brazil (SEBRAE, 2010).
The sample represents 382 companies that have been analysed during 2010–2013 for four years. Companies were classified by economic sector of activity as shown in Table 1. The sample is spread across 19 sectors, excluded financial sector, based on the classification of BM&FBovespa (2014). The most representative is the sector of electricity (15.18%), followed by construction (6.81%), textiles (7.07%) and steel and metallurgy (6.02%). The main sector ‘other’ is a group of all other sample sectors, except financial.
Table 1 Distribution by economic sector of companies of the sample, 2010–2013
Economic sector No. companies % of sample
Other 95 24.87%
Electricity 58 15.18%
Construction 26 6.81%
Textiles 27 7.07%
Steel and metallurgy 23 6.02%
Food and beverages 21 5.50%
Vehicles and parts 19 4.97%
Trade 20 5.24% Transport 21 5.50% Telecommunications 14 3.66% Chemical industries 11 2.88% Mining 8 2.09% Electro electronic 7 1.83% Agriculture 6 1.57%
Pulp and paper 5 1.31%
Oil and gas 7 1.83%
Machinery industries 5 1.31%
Software and data 5 1.31%
Non-metallic minerals 4 1.05%
Total 382 100.00%
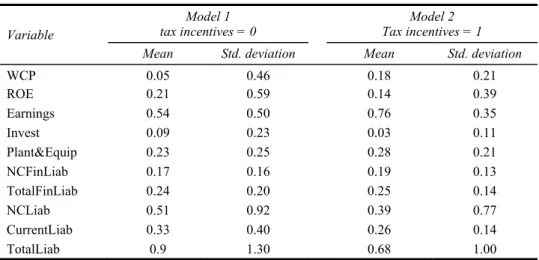
Table 2 presents the mean and standard deviations separated by groups (group 1 for companies that do not have disclosure fiscal incentives, group 2 for companies that have disclosure fiscal incentives). All variables are divided by the total assets. As we can observe, companies that have fiscal incentives disclosure, in the mean, superior ratios of WCP, earnings, plant and equipment, non-current financial liabilities and total financial liabilities than the companies who does not have fiscal incentives disclosure. At the same time, the companies that disclosure fiscal incentives also have inferior ratios of ROE, investments, non-current liabilities and current liabilities than the others.
4.2 Multivariate statistics
Table 3 presents the results of five regressions by GMM method. The authors decide to use GMM in order to reduce the possibility of the error being correlated with any of the variables in the models. All data were winsorized by 5%, in order to drop the outliers.
By the analysis of the model, it is observed that there is a positive and significant relationship between non-current financial liabilities and fiscal incentives and also between total liabilities and fiscal incentives. This indicates that companies that have more incentives are also more financially leveraged and/or total leveraged. It can be explained by the fact that companies that receive fiscal incentives are required to invest in plants and equipment, hire more personnel and invest all the incentives in order to promote growth to the environment that the company is inserted. Also, it can be observed that there is a positive relationship between the investment in plants and equipment, which means that they must invest while they are receiving the incentive.
Table 2 Descriptive statistics of variables of model 1 and model 2
Variable
Model 1
tax incentives = 0 Tax incentives = 1 Model 2 Mean Std. deviation Mean Std. deviation
WCP 0.05 0.46 0.18 0.21 ROE 0.21 0.59 0.14 0.39 Earnings 0.54 0.50 0.76 0.35 Invest 0.09 0.23 0.03 0.11 Plant&Equip 0.23 0.25 0.28 0.21 NCFinLiab 0.17 0.16 0.19 0.13 TotalFinLiab 0.24 0.20 0.25 0.14 NCLiab 0.51 0.92 0.39 0.77 CurrentLiab 0.33 0.40 0.26 0.14 TotalLiab 0.9 1.30 0.68 1.00
Notes: WCP = working capital; ROE = return on investment; Earnings = net earnings; Invest = total investments; Plant&Equip = total plant and equipment; NCFinLiab: non-current financial liabilities; TotalFinLiab = total financial liabilities; CurrentLiab = current liabilities; TotalLiab = total of current liabilities plus non-current liabilities. All variables were winsorized at level 5%.
Table 3 Model from the regression analysis with GMM method
Model NCliabilities financial Liab Total NCfinLiabil CurrentLiabilities Total liabilities
BenefTaxInc 1.290 0.553 12.611** 1.409 13.281*** 0.813 0.943 5.31 0.904 5.54 SIZE –0.145 –0.017* 0.0237 0.005 –0.01 0.008 0.009 0.055 0.009 0.07 Plant&Equip 0.637* 0.194 0.686** –0.6128*** 0.917** 0.054 0.0632 0.355 0.605 0.359 INVEST –0.087** –0.1437** 0.744** –0.636*** 0.744** 0.042 0.0495 0.2788 0.0474 0.316 EARNINGS –0.009 0.061** –0.0314 –0.022 –0.12 0.024 0.0276 0.155 0.0266 0.159 ROE –0.027** –0.061*** 0.353*** 0.076*** 0.320*** 0.012 0.014 0.0811 0.014 0.087 WCP –0.027* 0.068*** –0.342*** –0.0670*** –0.342*** 0.014 0.0173 0.0977 0.0166 0.098
YEAR Yes Yes Yes Yes Yes
F 3.67 9.23 7.59 234.74 7.59
Prob > F 0.000 0.000 0.000 0.000 0.000
Prob > Chi2 0.029 0.000 0.007 0.000 0.007
Notes: WCP = working capital; ROE = return on investment; Earnings = net earnings; Invest = total investments; Plant&Equip = total plant and equipment; NCFinLiab: non-current Financial Liabilities; TotalFinLiab = total financial liabilities; CurrentLiab = current liabilities; TotalLiab = total of current liabilities plus non-current liabilities. All variables were winsorized at level 5%.
However, we find a negative relationship between size, investments, earnings, ROE and working capital, which could indicate that companies that receive fiscal incentives could be, in that time, smaller than the others in the sample, do not invest in subsidiaries, they do not have much money available because of the investment in plant and equipment and other requirements by the law. Also, it can be seen that the performance is negatively related with the fiscal incentives, which can be explained because, as they have to keep this amount inside the equity, the relation between return and equity became lower than the others.
The GMM analysis shows that it is possible to observe a positive and significant relationship between non-current liabilities and also total liabilities. These results do reject our hypothesis H1, and indicate that companies that have fiscal incentives are more leveraged those others. It can be explained by the fact that these companies are obliged to invest more and, consequently, they need more capital than their competitors that do not have the same incentives.
5 Discussion and conclusions
The research focuses on the explanation and dynamic of tax incentives and companies on the pressure through capital structure decisions. However, the authors elaborated the following research hypothesis: companies who disclosure fiscal incentives present less liability than others that do not disclosure.
The practical implications of the research are to promote the awareness of the complexities involved in the disclosure of tax incentives and the liabilities levels. So, research is needed in order to make efforts in fighting for financial changes, without any advantage for the company. It is crucial to invest in research as this one as basic requirement to honour the accounting and taxation perspectives.
Discussion of tax incentives and their implications in the company has increased in recent years. The government gives up revenue, largely incentives, as a way to make companies play the role of the government with regards benefits to society. Thus, companies and investments are developed, jobs must be created, and investments should be made continuously in order to meet the requirements of keeping the tax incentives.
Thus, this study aimed to evaluate the effect of tax incentives on the liability level of the companies who disclose these incentives. Brazil is one of the countries with the largest number of different taxes and one of the most complex tax systems in the world. Also, this increases the types of benefits that a company may have. Thus, the sample chosen was one that disclosed the amounts of tax incentives revenues in the 2010–2013 period.
The results show that encouraged firms have higher long-term debt and total debt than those who are not encouraged. In addition, the authors found a positive relationship between the assets of these companies and the tax incentive. Thus, the results reject the research hypothesis of this article.
This study presents evidence that is contrary to the studies of Perobelli and Famá (2002), De Luca and Lima (2007) and pointed to another possible line of investigation. Further investigation must be conducted in order to understand why the companies that are encouraged by the government to invest are increasing their liabilities.
It must be noted that the tax effect on debt considered in the study by Modigliani and Miller (1958, 1963) refers to income tax. However, in Brazil, there are several types of
taxes, direct and indirect, that affect income, in the first case, and others that are charged inside the revenues, in the second case, and therefore the downward effect of the liabilities cannot occur because the tax incentive is not directly linked to income tax. Thus, there would be no incentive effect of taxation on debt.
In addition, government requirements for granting tax incentives increase a company’s investments and thus, at first, can increase the indebtedness of a company.
The first limitation of this research is that the tax incentives are important to many companies and the impact on the liability levels; they will reflect the economic, social, political and cultural environment of a specific country. Governments that want to protect the investors and companies fight against threats, frauds or scandals, reduce the incidence of great levels of debt and then improve effectiveness and efficiency in corporate control.
The second limitation of this research is that some companies have difficulties in understanding the great diversity of the laws, regulations, practices and traditions that determine the corporate tax and financing performance. The models developed in this research are based on the same principle for which the capital structure is applied internationally and it generates equal measures for companies with different corporate control levels.
The third limitation of this research was the main difficulty of obtaining data from companies, but there is optimism regarding efforts to improve this kind of attitude. Further, this research can be conducted after manually collecting data for more years (the authors expect more availability of data) and examining whether these variable has effect on the determinants of capital structure that they change rapidly due to strong development or the international economic recession. Analysing a six-year period could also allow the researchers to determine whether or not the greater stability provided by the long calibration model is effective.
References
Acharya, V.V. and Viswanathan, S. (2011) ‘Leverage, moral hazard, and liquidity’, Journal of
Finance, Vol. 46, pp.99–138.
Amburgey, T.L. and Dacin, M. (1993) Evolutionary Development of Credit Unions, Center for Credit Union Research, The School of Business, University of Wisconsin-Madison.
Anderson, R. and Reeb, D. (2003) ‘Founding-family ownership and corporation performance: evidence from the S&P 500’, Journal of Finance, Vol. 58, No. 3, pp.1301–1328.
Arellano, M. and Bond, S. (1991) ‘Some tests of specification for panel data: Monte Carlo evidence and an application to employment equations’, Review of Economic Studies, Vol. 58, pp.277–97.
Arellano, M. and Bover, O. (1995) ‘Another look at the instrumental-variable estimation of error-components models’, Journal of Econometrics, Vol. 68, pp.29–52.
Barron, D.N., West, E. and Hannan, M.T. (1994) ‘A time to grow and a time to die: growth and mortality of credit unions in New York City, 1914–1990’, The American Journal of Sociology, Vol. 100, No. 2, pp.381–421.
Barros, L. (2005) Decisões de Financiamento e de Investimento das Empresas sob a Ótica dos
Gestores Otimistas e Excessivamente Confiantes, Tese de Doutorado em Administração,
Faculdade de Economia, Administração e Contabilidade da Universidade de São Paulo. Black, H. and Dugger, R.H. (1981) ‘Credit union structure, growth and regulatory problems’,
Journal of Finance, Vol. 36, No. 2, pp.529–538.
Bonsón, E. and Escobar, B. (2004) ‘Voluntary disclosure of financial reporting on the internet: a comparative world-wide analysis’, Spanish Journal of Finance and Accounting, Vol. 33, No. 123, pp.1063–1101.
Brealey, R. and Myers, S. (2007) Principles of Corporate Finance, McGraw-Hill, London. Brigham, E. and Ehrhardt, M. (2009) Fundamentals of Financial Management, South-Western
Cengage Learning, Mason.
Brito, G., Corrar, L. and Batistella, F. (2007) ‘Fatores determinantes da estrutura de capital das maiores empresas que atuam no Brasil’, Revista Contabilidade & Finanças, No. 18, pp.9–19. Cardoso, R.C. (1971) ‘A reavaliação do ativo imobilizado frente aos incentivos fiscais’, Revista de
Administração de Empresas, Vol. 11, No. 3, pp.77–84, Rio de Janeiro.
Craven, B.M. and Marston, C.L. (1999) ‘Financial reporting on the internet by leading UK companies’, The European Accounting Review, Vol. 8, No. 2, pp.321–333.
Croteau, J.T. (1956) ‘The large credit union’, The Journal of Finance, Vol. 11, No. 3, pp.347–362. Damodaran, A. (2007) Investment Valuation: Tools and Techniques for Determining the Value of
Any Asset, John Wiley and Sons, New York.
De Luca, M.M.M. and Lima, V.F.L. (2007) ‘Efeito dos Incentivos Fiscais no Patrimônio das Entidades Beneficiárias do Programa FDI, do Governo do Estado do Ceará’, Contextus –
Revista Contemporânea de Economia e Gestão, Vol. 5, No. 1, pp.29–44.
Deloof, M. (2003) ‘Does working capital management affect profitability of Belgian firms?’,
Journal of Business Finance and Accounting, Vol. 30, Nos. 3/4, pp.573–587.
Diniz, M.L.C. and Ribeiro, M.F. (2004) ‘O direito ao crédito-prêmio do IPI’, Jus Navigandi,
Teresina, Vol. 8, p.379 [online] http://jus2.uol.com.br/doutrina/texto.asp?id=5471
(accessed 7 September 2008).
Durand, J.C.G., Gouveia, M.A. and Berman, G. (1997) ‘Patrocínio empresarial e incentivos fiscais à cultura no Brasil: análise de uma experiência recente’, Revista de Administração de
Empresas, Vol. 37, No. 4, pp.38–44, São Paulo.
Elali, A. (2007) ‘Incentivos fiscais, neutralidade da tributação e desenvolvimento econômico: a questão da redução das desigualdades regionais e sociais’, in Martins, I.G.S. et al. (Eds.): Incentivos fiscais: questões pontuais nas esferas federal, estadual e municipal, Vol. 1, pp.37–66, MP, São Paulo.
Emmons, W.R. and Schmid, F.A. (1999) ‘Credit unions and the common bond’, Review of the
Federal Reserve Bank of St. Louis, No. 33, pp.41–63.
Emmons, W.R. and Schmid, F.A. (2000a) Banks, Credit Unions, and the Dynamics of Competition.
Federal Reserve Bank of St. Louis, Working paper.
Emmons, W.R. and Schmid, F.A. (2000b) ‘Bank competition and concentration: do credit unions matter?’, Review of the Federal Reserve Bank of St. Louis, pp.29–42.
Fabretti, L.C. (2000) Contabilidade tributária, Atlas, São Paulo.
Feinberg, R.M. (2001) ‘The competitive role of credit unions in small local financial services markets’, Review of Economics and Statistics.
Feinberg, R.M. (2002a) ‘Credit unions: fringe suppliers or cournot competitors?’, Review of
Industrial Organization, pp.105–113.
Feinberg, R.M. (2002b) The Determinants of Bank Rate-Setting in Local Consumer Lending
Markets: Comparing Market and Institution-Level Results, Working paper.
Formigoni, H., Antunes, M.T.P., Cia, J.C. and Margarido, R. (2008) ‘Investimento em capacitação tecnológica industrial, com incentivo fiscal, e desenvolvimento socioeconômico’, 8º
Congresso USP Controladoria e Contabilidade, São Paulo.
Frischmann, P., Shevlin, T. and Wilson, R. (2008) ‘Economic consequences of increasing the conformity in accounting for uncertain tax benefits’, Journal of Accounting and Economics, Vol. 46, pp.261–278.
Goddard, J.A., Mckillop, D.G. and Wilson, J.O.S. (2002) ‘The growth of US credit unions’,
Governo do Brasil. (1958) Lei 3.470 de 28 de novembro de 1958, Altera a legislação do imposto de
renda e dá outras providências [online] http://www3.dataprev.gov.br/sislex/paginas/
42/1958/3470.htm (accessed 14 August 2009).
Greene, W. (2012) Econometric Analysis, Prentice Hall Inc., London.
Gul, F.A. and Leung, S. (2004) ‘Board leadership, outside directors’ expertise and voluntary corporate disclosures’, Journal of Accounting and Public Policy, Vol. 23, No. 5, pp.351–379. Guthmann, H.G. (1951) ‘Competition from tax-exempt business’, The Journal of Finance, Vol. 6,
No. 2, pp.161–177.
Hair, J., Anderson, R., Tatham, R. and Black, W. (2005) Análisis Multivariante, Prentice-Hall, Madrid.
Hannan, T.H. (2002) ‘The impact of credit unions on the rates offered for retail deposits by banks and thrift institutions’ [online] http://www.ssrn.br/id386880 (accessed 28 August 2008). Hannan, T.H. and Prager, R.A. (2001) The Competitive Implications of Multimarket Bank
Branching, Working paper, Federal Reserve Board.
Harriss, C.L. (1954) ‘Government expenditure: significant issues of definition’, The Journal of
Finance, Vol. 9, No. 4, pp.351–364.
Hsiao, C. (2007) ‘Panel data analysis, advantages and challenges’, Test, Vol. 16, No. 1, pp.1–22. Inchausti, B.G., Gisbert, M.A., Millán, N.C. and llopis, A.R. (2003) ‘Incentivos para la divulgación
voluntaria de información: evidencia empírica sobre la información segmentada’, Revista
Europea de Dirección y Economía de la Empresa, Vol. 12, No. 17, pp.69–86.
Lacombe, A.L.M. (1969) ‘Algumas considerações sobre os incentivos fiscais’, Revista de
Administração de Empresas, Vol. 9, No. 4, pp.107–117.
Lee, Y. (2007) ‘Diagnostic testing for dynamic panel data models’, 14th Conference on Panel
Data, No. 39 [online] http://www.wise.xmu.edu.cn/panel2007/paper/LEE(YoonJin).pdf.
Marston, C. and Polei, A. (2004) ‘Corporate reporting on the internet by German companies’,
International Journal of Accounting Information Systems, Vol. 5, No. 3, pp.285–311.
Melo, F.S. (2007) ‘Incentivos fiscais e segurança jurídica’, in Martins, I.G.S. et al. (Eds.):
Incentivos fiscais: questões pontuais nas esferas federal, estadual e municipal, pp.138–139,
MP, São Paulo.
Modigliani, F. and Miller, M.H. (1958) ‘The cost of capital corporation finance and theory of investment’, American Economic Review, Vol. 48, No. 3, pp.261–297.
Modigliani, F. and Miller, M.H. (1963) ‘The cost of capital corporation finance and theory of investment: corporate income and taxes and the cost of capital: a correction’, American
Economic Review, Vol. 53, No. 3, pp.433–443.
Monteiro, J.V. (2007) ‘A promoção do crescimento econômico em 2007–10’, Revista de
Administração Pública, Vol. 41, No. 2, pp.357–368.
Oyelere, P., Laswad, F. and Fisher, R. (2003) ‘Determinants of internet financial reporting by New Zealand companies’, Journal of International Financial Management and Accounting, Vol. 14, No. 1, pp.26–63.
Penman, S. (2013) Financial Statement Analysis and Security Valuation, McGraw-Hill/Irwin, London.
Perobelli, F.F.C. and Famá, R. (2002) ‘Determinantes da estrutura de capital: aplicação a empresas de capital aberto brasileiras’, Revista de Administração, Vol. 37, No. 3, pp.33–46, São Paulo. Pindado, J. and Requejo, I. (2012) ‘Panel data: a methodology for model specification and testing’,
Finance Volume of Wiley Encyclopedia of Management.
Pires, A.R. (2007) ‘Ligeiras reflexões sobre a questão dos incentivos fiscais no Brasil’, in Martins, I.G.S. et al. (Eds.): Incentivos Fiscais: questões pontuais nas esferas federal,
Ponciano, N.J. and Campos, A.C. (2003) ‘Eliminação dos impostos sobre as exportações do agronegócio e seus efeitos no comportamento da economia’, Revista Brasileira de Economia, Vol. 57, No. 3, pp.637–658.
Popper, K. (1975) A lógica da pesquisa científica, Cultrix, São Paulo.
Prencipe, A. (2004) ‘Proprietary costs and determinants of voluntary segment disclosure: evidence from Italian listed companies’, European Accounting Review, Vol. 13, No. 2, pp.319–340. Ramírez, C.Z., Rojas, J.M. and Torres, J.A.R. (2014) ‘Accounting for income taxes and
comprehensive income: value relevance for the Spanish financial market’, Spanish Accounting
Review, Vol. 17, No. 2, pp.174–182.
Rodrigues, M.T.M. (2007) ‘Incentivos fiscais: desenvolvimento econômico e a jurisprudência do STG para o ICMS – ‘guerra fiscal’ entre estados’, in Martins, I.G.S. et al. (Eds.): Incentivos fiscais: questões pontuais nas esferas federal, estadual e municipal, Vol. 15, pp.299–325, MP, São Paulo.
Roesch, S.M. (1984) ‘Analisando a implementação de políticas públicas: o caso da Lei nº 6.297/78, de incentivos fiscais à formação profissional nas empresas’, Revista de Administração de
Empresas, Vol. 24, No. 4, pp.265–277.
Roesch, S.M. (1990) ‘O impacto do programa de incentivos ao treinamento nas empresas’, Revista
de Administração de Empresas, Vol. 30, No. 1, pp.27–43.
Santos, S.D.P. and Candiota, L.R.S. (1974) ‘Sociedade de crédito imobiliário: o único setor financeiro cuja expansão e rentabilidade estão garantidas por décadas’, Revista de
Administração de Empresas, Vol. 14, No. 1, pp.69–78.
Scharlack, J.R. (2008) ‘Incentivos fiscais e planejamento empresarial’ [online]
http://www.rodantescharlack.com.br/pdf/joserubens/artigo-planejamento-tributario.pdf (Accessed 4 October 2008).
Segura, L.C., Abreu, R. and Milani Filho, M.A.F. (2014) ‘Assessing accounting for citizenship: an empirical analysis of the corporate control and capital structure decisions’, International
Journal of Auditing and Technology (IJAUDIT), No. 2.
Serviço Brasileiro de Apoio às Micro e Pequenas Empresas (SEBRAE) (2010) Boletim Estatístico
da Pequena e Média Empresa, Observatório SEBRAE, São Paulo, Brazil.
Shah, A. (2006) ‘Fiscal incentives for investment and innovation’, No. 12 [online] http://ssrn.com/ abstract=896144.
Smith, D.J. (1986) ‘A test for variant objective functions in credit unions’, Applied Economics, Vol. 18, No. 18, pp.959–970.
Soares, R. and Kloeckner, G. (2008) ‘Endividamento em corporações com alta propensão à expropriação: o caso de corporações com um controlador’, Revista de Administração de
Empresas (RAE), Vol. 48, No. 4, pp.73–96.
Somers, H.M. (1951) ‘Competition from tax-exempt business: discussion’, The Journal of Finance, Vol. 6, No. 2, pp.178–186.
Strong, D. (2005) Estudo sobre a estrutura de capital das empresas brasileiras no período pós
Plano Real (1995–2005), Tese de Doutorado, Universidade Presbiteriana Mackenzie,
São Paulo, Brasil.
Tatom, J.A. (2005) ‘Competitive advantage: a study of the federal tax exemption for credit unions’,
Tax Foundation [online] http://www.ssrn.com/abstract=923110 (accessed 20 October 2007).
Tokle, R.J. and Tokle, J.G. (2000) ‘The influence of credit union and savings and loan competition on bank deposit rates in Idaho and Montana’, Review of Industrial Organization, Vol. 17, No. 17, pp.427–438.
Torres, R.L. (2007) ‘O princípio da isonomia, os incentivos do ICMS e a jurisprudência do STF sobre a guerra fiscal’, in Martins, I.G.S. et al. (Eds.): Incentivos fiscais: questões pontuais nas
esferas federal, estadual e municipal, Vol. 16, pp.327–345, MP, São Paulo.
Wooldridge, J. (2006) Introductory Econometrics: A Modern Approach, Thomson South-Western, New York.