Master Thesis
Mergers and Acquisitions:
The Case of Microsoft Corporation and Activision Blizzard Inc.
Author: Robert Stenmark Hand-in date: 4th of June 2012 Supervisor: Peter Tsvetkov Programme:
Master of Science in Business Administration Major in Corporate Finance and Control
This thesis is a part of the MSc programme at Universidade Católica Portuguesa. The school takes no responsibility for the methods used, results found and conclusions drawn.
"Never count on making a good sale. Have the
purchase price be so attractive that even a mediocre
sale gives good results."
Acknowledgements
Writing this dissertation has been an enlightened and interesting experience. Although it required hard work and determination, the experience has provided me with better analytical skills and valuable insights in an area of finance I find particularly interesting. Moreover, this dissertation could not have been completed without the support and advice from the people whom I am indebted.
I would like to express my sincere gratitude to my supervisor Peter Tsvetkov for his constant availability and for providing me with constructive feedback, invaluable insights and clear guidance. I could not have wished for a better supervisor.
I also want to give a special thank to my close friends Torbjørn Skjelde, Martin Strandenæs and Mette Skattebo for their comments, encouragement and patience. I am forever grateful for their support and for believing in me.
Last but not least, I want to express my gratitude to my beloved family for their constant support and for having confidence in my abilities throughout my studies.
Lisbon, June 2012
Abstract
Globalization, geographic diversification and deregulation of markets have led to an increasingly competitive environment for most companies. Increasing competition often leads to higher efforts to persuade consumers to by the given company’s product, and consequently margins are affected. Moreover, this development of the business environment also faces as a threat to most companies’ organic growth. For this reason, companies often envision mergers and acquisitions as a solution to this problem. The decision of taking on a larger transaction to acquire another company is often motivated by the fact that it may create additional opportunities for the company, enable higher growth, and ultimately create shareholder value.
Mergers and acquisitions are especially apparent in industries that are highly affected technological innovations. The rationale for this is grounded in the potential target company’s technological assets or specific capabilities, which may pose as highly valuable for the acquirer. The acquisition of the target company enables the transfer of these skills and may create a competitive advantage, which in turn creates a driver for long-term sustainable growth.
This paper will analyze the possibility of creating additional value through mergers and acquisition. The paper will start of by surveying literature on various theories on valuation of companies. This part will also present evidence on what valuation techniques that proves to yield reliable results, and discuss value creation in the light of mergers and acquisitions. In the second part the paper the presented theory will be put into practice by through a proposed M&A-situation between Microsoft Corporation and Activision Blizzard, Inc. This part will present a thorough company- and industry analysis that will provide the basis for a valuation of the companies, both on a standalone basis and on a consolidated basis. The final part of the paper will present the acquisition process itself, and discuss issues that are related to the acquisition. This part will also present the optimal way for Microsoft to proceed in acquiring Activision Blizzard.
When valuing the companies individually, both companies show indications of being undervalued compared to their average market values for the last year. Microsoft value is displaying signs of being overly undervalued, while Activision Blizzard only is slightly undervalued. A valuation of the combined company reveals that there were considerable opportunities for additional value creation through a merger.
Finally, based on the analysis and the valuations in the paper suggests that that Microsoft should proceed with the acquisition. The acquisition will be presented to Activision Blizzard’s shareholders as a friendly tender offer, in order to persuade them to sell their shares in the company. The price offered for the outstanding shares of the company is suggested to provide current shareholders with a premium of 29.4% to the average market capitalization of the company. Moreover, the acquisition will be financed with a cash-only transaction, as to maintain financial flexibility and in line with Microsoft’s acquisition history.
Table of Contents
1. Introduction 1
2. Literature Review 2
2.1 Measuring Value 2
2.1.1 The Components of Discounted Cash Flow Models 3
2.1.2 The Discounted Cash Flow Models 8
2.1.3 Relative Valuations 11
2.2 M&A Essentials 13
2.2.1 Classifying Acquisitions 13
2.2.2 Creating and Valuing Synergies 13
2.2.3 The Focus of the M&A 14
2.2.4 The Optimal Structure of the Deal 15
2.2.5 What About the Shareholders? 15
2.2.6 Concluding Thoughts 17
3. Company and Industrial Analysis 18
3.1 The Companies 18
3.1.1 Microsoft Corporation (MSFT) 18
3.1.2 Activision Blizzard, Inc. (ATVI) 20
3.2 The Entertainment Software Publishing Industry 22
3.2.1 The Hardware Providers 24
3.2.2 The Content Providers 26
3.2.3 Trends in the Industry and Future Developments 28
4. Rationale For the Proposed Acquisition 33
5. Recent Stock Performance 35
6. Standalone Valuation 36
6.1 Performance Forecast and Valuation 36
6.1.1 Microsoft Corporation 37
6.1.2 Activision Blizzard, Inc. 57
7. Valuation of the Merged Company 75
7.1 Valuation of the Merged Company Without Synergies 75 7.2 Valuation of the Merged Company With Synergies 77
7.2.1 Analysis of Potential Synergies 77
7.2.2 Value of Synergies 86
7.2.3 Distribution of the Synergies 88
8. The Acquisition 90
8.1 Classifying the Acquisition 90
8.2 Other Potential Bidders 91
8.3 The Acquisition Price 91
8.4 Can the Premium Be Justified? 93
8.5 Financing the Acquisition 95
8.6 The Initial Offer 96
8.7 Other Considerations 96 8.7.1 Winner’s Curse 97 8.7.2 Execution Risk 97 9. Conclusion 99 10. Appendices 100 11. Bibliography 131
List of Appendices
Appendix 1: Company Information and SWOT Analysis 100
Appendix 2: Statement of Financial Structure 105
Appendix 3: Segment Information for Microsoft 106
Appendix 4: Entertainment and Devices Division, Microsoft 107 Appendix 5: Digital Online Channels for Activision Blizzard, Inc. 108 Appendix 6: Product Information – Skylanders: Spyro’s Adventure 109
Appendix 7: Affiliated Industries 110
Appendix 8: Increase in Installed Hardware Base 111
Appendix 9: Geographical Segmentation of Console Market 112
Appendix 10: Growth in Entertainment Software 113
Appendix 11: Stock Performance 114
Appendix 12: R&D Costs for Competitors Recognized by Microsoft 115 Appendix 13: Pure-Play Entertainment Software Companies’ Costs 116
Appendix 14: Standalone Valuation Results 117
Appendix 15: Combined Company Valuation Without Synergies 122 Appendix 16: Average Operational Expenses for the EDD 125 Appendix 17: Calculation of Collection and Payment Periods 126 Appendix 18: Combined Company Valuation With Synergies 127 Appendix 19: Meet the Premium Line Formula Derived 130
List of Tables
Table 1: Examples of Financial and Non-Financial Multiples 12 Table 2: Historical Stock Information for Microsoft and Activision Blizzard 35
Table 3: Computer Hardware Growth, Nominal Terms 38
Table 4: Advertising Spending Forecast 40
Table 5: Forecasted Real Growth for the Office Suit, Real Terms 42 Table 6: Entertainment Software Forecast, Nominal Terms 43
Table 7: Industry R&D Costs 45
Table 8: Valuation Parameters for Microsoft 53
Table 9: Implied Probability of Default for Microsoft 55 Table 10: Microsoft’s Sensitivity to Terminal Growth Rate 56 Table 11: Microsoft’s Sensitivity to Increased Amounts of Debt 56 Table 12: Forecasted Growth in Distribution Compared with Real GDP 62
Table 13: Pure-Play Companies’ Costs 66
Table 14: Historical Effective Income Tax for Activision Blizzard 68 Table 15: Valuation Parameters for Activision Blizzard 72 Table 16: Activision Blizzard’s Sensitivity to Terminal Growth Rate 73 Table 17: Activision Blizzard’s Sensitivity to Increased Amounts of Debt 73
Table 18: Weighted Average Calculations 76
Table 19: Valuation Parameters for Merged Company 76
Table 20: Average Expenses for the EDD Division (MSFT) 80 Table 21: Operating Margin for the EDD Division (MSFT) 81 Table 22: Potential Synergy of Increased Credit Lines 83
Table 23: Property and Equipment for MSFT and ATVI 84
Table 24: Value of the Synergies 87
Table 25: The Acquisition Price 92
Table 26: Implied Maximum Premium with Current Synergies 95
List of Figures
Figure 1: Future Cash Flows 4
Figure 2: Enterprise Valuation of a Single-Business Company 9 Figure 3: Adjusted Present Value of a Single-Business Company 10 Figure 4: The Principal Assumption of Relative Valuation 11
Figure 5: Steps in Valuing Synergies 14
Figure 6: Breaking Down the Acquisition Price 15
Figure 7: Value Creation in Acquisitions 16
Figure 8: The Meet the Premium (MTP) Line 17
Figure 9: Segment Information for MSFT (Pie Chart) 19
Figure 10: Segment Information for MSFT (Bar Chart) 19
Figure 11: Entertainment and Devices Division 19
Figure 12: Segment Information for ATVI (Pie Chart) 21
Figure 13: Segment Information for ATVI (Bar Chart) 21
Figure 14: Cost and Expenses at ATVI 21
Figure 15: Financial Performance at ATVI 22
Figure 16: Gamer Demographics 23
Figure 17: Market Value of Consoles 24
Figure 18: Total Units of Consoles Sold (LTD-numbers) 25
Figure 19: Growth in Annual Game Sales 27
Figure 20: Digital Revenues as Percentage of Total 28
Figure 21: Household Final Consumption Expenditure 29
Figure 22: Forecasted Market Performance 32
Figure 23: Historical Relative Performance of MSFT and ATVI 35 Figure 24: Forecasted Real Growth for Online Ad Spending 40 Figure 25: Tangible Capital Expenditures, Version 1 (MSFT) 47 Figure 26: Tangible Capital Expenditures, Version 2 (MSFT) 47 Figure 27: Intangible Capital Expenditures in Terms of Total Revenues (MSFT) 48
Figure 28: Historical Inventories Data (MSFT) 50
Figure 29: Microsoft’s Sensitivity to Other Operating Variables 56 Figure 30: Assumed Future Growth in Online Subscriptions (ATVI) 58 Figure 31: Historical Relative Growth in High Definition Platforms (ATVI) 59 Figure 32: Historical Relative Growth in Distribution (ATVI) 62 Figure 33: Costs Associated with Online Subscriptions (ATVI) 64 Figure 34: Last Two Drivers of Cost of Revenue (ATVI) 65
Figure 35: Historical Inventories Data (ATVI) 70
Figure 36: Activision Blizzard’s Sensitivity to Other Operating Variables 74 Figure 37: Distribution of the Synergies Created in the Merger 88
Figure 38: Waterfall Chart of Synergies 89
List of Abbreviations
πa Probability of Bankruptcy
Π Pretax Profit Margin
%P Acquisition Premium in Percent APM Arbitrage Pricing Model
APV Adjusted Present Value
ATVI Activision Blizzard, Inc. Ticker Symbol
βL Levered Beta
βU Unlevered Beta
BC Bankruptcy Costs
BRIC Brazil, Russia, India and China CAGR Compound Annual Growth Rate CapEx Capital Expenditures
CAPM Capital Asset Pricing Model Dt Amount of Debt at Time t
E Amount of Equity
ET After-Tax Earnings
E(rE) Expected Return on Equity
E(rm) Expected Return on the Market Portfolio
EBIT Earnings Before Interest and Taxes EPS Earnings Per Share
EDD Entertainment and Devices Division (Microsoft) FCFE Free Cash Flow to Equity
FCFF Free Cash Flow to the Firm
g Growth Rate
GAAP Generally Accepted Accounting Standards
HR Human Resources
IFRS International Financial Reporting Standards IXIC NASDAQ Composite Index Ticker Symbol
LDT Life to Date (Total Number of Products Sold in Lifetime of Product) M&A Mergers & Acquisitions
MMORPG Massively Multiplayer Online Role-Playing Game MSFT Microsoft Corporation Ticker Symbol
MTP Meet the Premium MVT Market Value of Equity
NC Net Cash
OS Operating System
p.a. Per Annum
PV(x) Present Value of x
rD Cost of Debt
rE Cost of Levered Equity rf Risk Free Rate of Return rU Cost of Unlevered Equity
rWACC Weighted Average Cost of Capital
R Revenue
R&D Research and Development ROIC Return On Invested Capital
SynC Cost Synergies SynR Revenue Synergies
T Effective Tax Rate
TC Corporate Tax Rate
WACC Weighted Average Cost of Capital
WC Working Capital
WCN Working Capital Need
1.
Introduction
This paper will present the case of a proposed M&A situation between the companies Microsoft Corporation (Microsoft) and Activision Blizzard, Inc. (Activision Blizzard). Microsoft is one of the worlds most widely known software companies, while Activision Blizzard is an entertainment software company that publishes video games. The objective of the case study is to present the value creation opportunities that can be created in a M&A situation, and reflect on how to proceed in such a situation. Moreover, it will be analyzed how to value these opportunities and how to increase the likelihood of realizing the value creation.
The literature review will survey literature on various theories on the valuation of companies. It will present the most important theoretical frameworks that are applied practitioners and academics, discuss their reasonableness and their ability reliably capture the value of a given company. These theories will build the framework for assessing the value of the two companies in the proposed merger. Moreover, this section will also shed some light on important considerations in M&A.
The company and industry analysis will present the historical performance for both companies and their respective industries. This information will be necessary to build a reliable valuation model that reflects the current and expected performance of the companies in relation to their respective industry. Without having this information at hand, a valuation may provide dubious results and may misrepresent the value that can be realized through a potential merger.
The following sections will forecast important value drivers that enable the estimation of the standalone values for the companies. When these values have been firmly established, the values of the combined company will be analyzed in order to find potential value enhancements in the merger.
Finally, after valuing the companies on a standalone- and merged basis, the acquisition itself will be considered. This section will provide valuable insights on necessary considerations in an acquisition, and present a proposal for how Microsoft should proceed with its intended acquisition in order to ensure that value is created.
2.
Literature Review
In recent years, the number of mergers and acquisitions (M&A) has soared (Barkema and Schijven, 2008), and it has become an increasingly popular way of attempting to gain ground as a company and creating value for its shareholders. The strategic motives behind M&As differ from transaction to transaction. However, most mergers appear to be justified with the notion that they enhance value of the combined company. This value is often unattainable for the companies operating separately, and is realized only through the combination of the two entities. Damodaran (2005b) refers to this added value as the synergy obtained by the combined company, and is the result of new opportunities created directly through the merger. Whether or not companies are able to consistently capture this added value, and hence create value for its shareholders, remains more or less inconclusive.
Ultimately it will be the price paid for the target, and whether the envisioned improvements are realized, that will determine if the investment yields value for the acquirer’s shareholders. This introduces valuation as an essential part of M&A, and it provides managers with a useful tool to manage value, while it provides investors with a tool for considering potential investments. Hence, a reliable estimate of the corporate valuations can improve the likelihood of realizing the potential added value. The forthcoming section of this paper will provide a discussion on common approaches in the valuation of companies, followed by a review of findings specifically related to M&As.
2.1 Measuring Value
To present date it can be identified a wide range of different approaches to valuation. The rationale for the application each approach is usually different (Koller et al., 2010), and the degree in which it is applied differs by academics and professionals. In academic literature there has been an extensive focus on discounted cash flow models (e.g. Koller, et al., 2010), while practitioners more frequently apply relative valuation frameworks (Lie & Lie, 2002).
Most valuation models base their estimation on some form of present value approach to current and future income streams to the company or its investors (Young et al., 1999), and has its roots in the model presented by Modigliani and Miller (1958). It has become common to distinguish between two broad types of valuation methods, namely equity valuation models and pure enterprise models. The former estimates the value attributable purely to equity shareholders, while the latter estimates the value for the entire business that ascribes to all claimholders of the enterprise. Further, Young et al. (1999) distinguishes between models that focuses on cash flows, returns or multiples. The cash flow models center its attention to the stream of future cash flows that becomes available to investors or other claimholders, while models based on returns link the valuation to the excess return on existing and future investments. The multiples approach implies creating a multiple using one or more fundamental value drives and comparing this to the value of a group of similar companies. This approach implicitly assumes that the market is able, on average, to provide us with the real value (Damodaran, 2005a). Other authors have emphasized that value can estimated using a real options approach (e.g. Copeland & Antikarov, 2003; Trigeorgis, 1996).
Young et al. (1999) argues that most models are based on the same understanding of value creation, and that they will yield the same result as long as the assumptions are applied consistently across models. Damodaran (2005a) shares this
stance, and adds that the determinants of multiples are the same as for discounted cash flow models. This means that relative valuation should produce approximately the same result as for other valuation approaches. Further, it is recommended to rather use scenario-based cash flows with probabilities than to apply the real options approach (Kester & Froot, 1997). The reason for this is that the real options approach is argued to easily overrate the value of follow-on opportunities and hence produce a biased valuation (Kester & Froot, 1997).
The theory presented above suggests that it will be undesirable to evaluate all of the existing models to provide a sound presentation of valuation. The discounted cash flow valuation approach is argued to be the most precise and most flexible model (Koller et al., 2010) and the model with the best credentials (Damodaran, 2005a). For this reason, this model will be the basis for the following discussion on valuation. As a supplement, the model will also be considered in the light of relative valuation.
2.1.1 The Components of Discounted Cash Flow Models
There are multiple versions of discounted cash flow models. In the following section, the focus will be on the components of the Free Cash Flow to Firm model, as this remains the most preferred DCF model by practitioners and academics (Koller et al., 2010). It captures the value attributable to all of the capital providers of the firm. The model will be presented in the next section, with the addition of the Adjusted Present Value (APV) approach that also relies on discount rates.
The discounted cash flow models utilizes the expected cash flows that will yield from the assets in place and the growth assets in the company, and discounts them back to reach a present value for the firm (Damodaran, 2005a). In order to find a value for the future cash flows it is necessary to make qualified assumptions about current cash flows, expected growth and expected return on invested capital (ROIC) (Koller et al., 2010). In addition, the value subsequently attained will rely heavily on the assumptions for the discount rate. These issues will be discussed in more detail below.
Future Cash Flows
The future cash flows are an essential part of any DCF valuation model. In order to estimate the value of the company, it is essential to calculate the free cash flow to the firm, i.e. the value that in reality could be distributed to providers of capital. Although there exist various definitions for this measure, the most common type is described by Damodaran (2005a) as “cash flow after taxes and reinvestment needs but before any debt repayments” (p. 719).
Free Cash Flow to Firm = EBITA(1− TC) − (CapEx − Depreciation) − ΔWC
In order to find the expected FCFF, the underlying cash flows (earnings, costs, etc.) have to be forecasted into the future. An important driver in these cash flows is the expected growth rate (g) for the company. The growth in earnings can be traced back to investments in new assets and improvements in efficiency on existing assets (Damodaran, 2008a).
Large growth rates tend to be more frequently observed in small successful companies, as efficiency improvements and investment opportunities are plentiful. However, as these companies grow larger the efficiency improvements will diminish, and as their success attracts competition the investment opportunities become scarce. As of this reason it is hard to sustain high growth over longer periods of time. Damodaran (2008a) states that companies seldom grow at rates higher than the economy for extended periods. In the same line of thought, the median earnings-growth across companies is found to be close to the earnings-growth in gross domestic product (Chan, Karceski, & Lakonishok, 2003). Damodaran (2008a) defines long-term sustainable growth in operating income as:
g = Reinvestment Rate ⋅ Return on Invested Capital (ROIC) where (Damodaran, 2007)
Reinvestment Rate =CapEx − Depreciation + ΔWC
EBIT (1− TC)
Return on Invested Capital = EBIT (1− TC)
Fixed Assets + Current Assets − Current Liabilities − Cash
There are two things one should take note of in the rearmost formula, for ROIC. First, the invested capital, the denominator of the formula, should always be stated in book value terms to avoid the downward bias and the markup that market values adds to existing assets. Second, the reason why cash is subtracted is to keep the model consistent, i.e. earnings income is our measure of growth, and interest income from cash is not included in the operating income (Damodaran, 2007).
In the long-term, it is also important to remember that the level of depreciation ultimately is based on the size of the capital expenditures. Broadly speaking, this means that in long run it is impossible to have depreciation that is greater than the capital expenditures. Hence, when the company reaches its long-term sustainable growth rate it is common to assume that the depreciation matches the capital expenditures (Coffey, 2009), i.e. the assets are replaced continuously as they wear off. In the following section it will be uncovered how the future cash flows comes into play in the different DCF-models.
70# 85# 55# 100# 140# 100# 55# 180# Historical*Cash*Flows*********Future*Cash*Flows* Historical#cash#flows#obtained# from#Financial#Statements## Figure'1:'Future'Cash'Flows' 110# 190# 90# Based#on#historical#performance,# investments#in#new#assets#and# improvements#in#efficiency#
The Cost of Capital
The rate that should be applied when discounting future cash flows should optimally reflect the investors’ opportunity cost of taking on that particular investment. In other words, the discount rate should reflect the time-value of money (the risk free rate) and a risk premium to compensate the investor for the additional risk (Luehrman, 1997b). One should note that the discount rate applied in each case will depend on the valuation approach. The discount rate utilized in a FCFF valuation is a weighted-average cost of capital (WACC), which is a risk-adjusted rate that reflects the overall risk of the capital provided in the firm. The APV approach is slightly different and hence the discount rates required are the cost of debt and the unlevered cost of equity in order for the model to serve its purpose.
The weighted-average cost of capital is an approach that balances the discount rate in to reflect the risk of the company’s financing sources. In a given company there can be several costs of debt depending on the mixture of liabilities used for financing. Apart from regular bank debt, a company can make use of alternative investment sources through bond offerings, securitization and the hybrid market (Shivdasani & Zak, 2007). The cost of debt is commonly determined as a function of the current level of risk free interest rate and a default spread (Damodaran, 2010).
Cost of Debt (rD) = (Risk−Free Rate + Default Spread)
As the risk free rate affects both the cost of equity and the cost of debt, it is important find a reliable estimate for it. An asset is considered risk free if its actual return equals the expected return, i.e. there is no uncertainty or variance associated with its return (Damodaran, 2008b). Further, for this to be true neither default risk nor reinvestment risk can be present. As the risk free rate tends to vary with time, one should optimally use year-specific rates. However, using rates with longer maturities tend to make little difference if the duration of the risk free rate matches the duration of the cash flows (Damodaran, 2008b). Damodaran (2008b) argues that the risk free rate should be consistent with the currency of the cash flows, and that using a rate with 10-year duration (e.g. Treasury bond) is a good practice for valuation.
The default spread in the model reflects the default risk of the company. As the probability of default increases, the lenders require a higher compensation for the additional risk. This measure can be challenging to estimate reliably for a company. If the debt is widely traded the implied default spread can easily be extracted using the bond price and the risk free rate. However, if the debt is not traded on a regular basis it is more common to estimate the cost of debt by examining similar rated bonds traded in the market. For non-traded debt it is normal to use the historical borrowing history as a proxy (Damodaran, 2010).
The equity investors of the firm, however, require a return rate for their residual claim on the firm – known as the cost of equity. Because these investors only hold the residual claim, increasing debt will affect their overall risk and it consequently needs an alternative assessment. The most frequently used model to estimate the cost of equity is the Capital Asset Pricing Model (CAPM) derived by William Sharpe (1964), John Lintner (1965). The model forms a linear relationship between the cost of equity and the company’s risk profile (β) in relation to the market.
The model is based on the assumption that diversification enables the investor to escape all risks except for the overall market risk. Since all other risks are diversifiable it is argued that only the company’s rate of return to the level of economic activity is relevant in when considering risk (Sharpe, 1964). When the company is purely equity financed, or when using the APV, the model will be expressed as:
E(rU) = rf+βU(E(rm) − rf)
In order to provide a reasonable understanding of the CAPM model, a proper assessment of its components is necessary. The components will be discussed as they appear in the model, except for the risk free rate just discussed.
The beta is a relative measure of systematic risk, i.e. a stock’s risk added to a diversified portfolio (Koller, Goedhart, & Wessels, 2010). This means that if an investor adds a stock that increases the overall risk of the portfolio, this investor will require a higher return. Damodaran (2010) encourages the use of regression modeling to estimate the beta. This should be done my regressing equity returns on a market portfolio, and the resulting slope coefficient measures the company’s beta. Further, he recommends the application of at monthly data, and using a broad index for the market portfolio. However, Kaplan and Peterson (1998) argue that using only one company in the regression induces considerable statistical noise, and hence high standard errors for the beta. They propose using companies with similar characteristics and who operates in the same line of business, to improve the accuracy of beta. The best way to perform this procedure is by estimating the betas for each individual company, unlevering the betas, and using the relevered median as a proxy for the company. The betas are unlevered in order to control for different capital structures within the sample (Kaplan & Peterson, 1998), and relevered to reflect the given company’s capital structure. The following formula converts the beta (Damodaran, 2010). βL=βU 1+ (1− TC) D E " # $ % & ' " # $ % & '
It can be directly observed from the formula that the unlevered beta will always be lower than the levered beta, as one should expect.
The last component of the CAPM model is the equity risk premium (E(rm) – rf), which measures the excess return an investor would expect to earn while holding the market portfolio (or a well diversified portfolio). There is a wide range of determinants of the size of this premium, some of which are investor risk aversion, market liquidity, and macroeconomic volatility.
Studies on the risk premium have used different approaches to find a reliable estimate, but there seems to be little consensus on what is the best approach (Damodaran, 2011). The most apparent approach is using historical premiums over an extended period of time. However, using this approach for a given mature market it may yield historical premiums that are higher than expected premiums due to survivor bias, i.e. failing companies have been removed from the historical databases since they have ceased to exist. Damodaran (2011) argues that looking across multiple markets for very long time periods can mitigate this bias. In their recent report, Credit Suisse (2012) reports a global risk premium of 4.4%, which is close to what Koller et al. (2010) classifies as the appropriate range (4.5-5.5%). Other approaches include
estimating the premium is through surveys, and by using the implied premium. The resulting premiums from surveys tend to vary depending on who the targets are in the survey, and seem to have little prediction of future premiums (Damodaran, 2011). The implied approach has the advantage of being market-based and forward looking, but its results still show signs of being highly dependent on the model chosen for the valuation and the reliability of the inputs (Damodaran, 2011). The research shows that estimating a reliable value for the equity premium is a daunting task, and that assumptions for its value must be made in order to perform important financial analyses or valuations.
Summarizing, the CAPM should consist of a risk free rate with duration of 10-years, a median beta for the industry and an estimate for the equity risk premium. The model has been given extensive attention in literature and is the most common measure for cost of equity (Koller et al., 2010). However, the model has also been heavily criticized for its inability to explain the expected return with solely using the beta on a market risk premium (e.g. Banz, 1981). The frontrunners of these critiques have been Fama and French (1992, 1996, 1997), with the argument that the cost of equity is distressingly imprecise. They argue that there are several other variables (e.g. size, book-value-equity/market-value-equity) that could add increased explanation to the model. However, they also suggest that the CAPM’s inability to describe the cost of equity could be due to bad proxies for the market portfolio (Fama & French, 1996). In spite of this, the model remains common among practitioners and academics alike, and it continues to exist as an important model in valuation.
The Weighted Average Cost of Capital
The cost of debt and the cost of equity come together as an essential input in the WACC model, referred to earlier. The WACC is a tax-adjusted discount rate that also captures the value created or destroyed through financing (Luehrman, 1997a). When incorporating cost of debt and the cost of equity the WACC is mathematically defined as follows: rWACC= E E + D⋅ rE+ D E + D⋅ rD⋅ (1− TC)
Estimating this model may seem as a reasonably easy task considering that the book values of debt and equity is widely available in the financial statements. However, since the WACC forward-looking measure and captures the cost of raising new funds it is more appropriate to apply market value weights (Damodaran, 2010). Koller et al. (2010) takes the discussion one step further by advocating the use of targets rates rather than current rates if the capital structure is expected to change, as the discount rate should reflect the long-term capital structure. The target capital structure should be assessed based on the long-term trend for the company in its particular industry. Furthermore, Damodaran (2009) and Koller et al. (2010) argues that the level of debt should be adjusted to reflect off-balance sheet items such as operating leases and pension liabilities. These items will have significant effects on both the income statement and the balance sheet, and if unadjusted for they might distort the real value of debt. The adjustment needs to be carried out consistently with the definition of the free cash flow.
Nevertheless, the WACC model tends to be suitable only for companies with simple and static capital structures (Luehrman, 1997b), and its calculation often
becomes intricate with the introduction of complex securities (Koller et al., 2010). Harris and Pringle (1985) assert that its application is limited to the evaluation of added risks that are of the equivalent risk as the company’s current operating and financial risk. This should suggest the use of the same proportionate capital structure, and underlying risk, in all projects/acquisitions undertaken by the company. For this reason, a number of alternative approaches have been suggested to improve flexibility, one of which is the Adjusted Present Value (Myers, 1974). It differs in its application by breaking up the independent components of risk and discounts them separately in order to reach the enterprise value.
2.1.2 The Discounted Cash Flow Models
In this section the Free Cash Flow to the Firm model based on WACC will be presented in detail, in addition to the APV model. These are the two most common approaches to value discounted cash flow models. The latter valuation approach was first presented by Stewart Myers (1974) and it values operations with different risks and the financial maneuvers separately. It is argued to be a helpful tool for managers in display where value is created (Luehrman, 1997a).
The Free Cash Flow to the Firm Model
The free cash flow to the firm model, also referred to as the enterprise model, has been widely accepted as the standard of discounted cash flow models (Luehrman, 1997a). The model estimates the value attributable all capital suppliers of the company (equity and debt), and is based on the future free cash flows to the firm discounted back using the WACC. Mathematically the calculation can be written as (Damodaran, 2005a):
Value of Operating Assets of the Firm = FCFFt
(1+ rWACC) t + FCFFn+1 rWACC− gn " # $ % & ' (1+ rWACC) n t=1 t=n
∑
The FCFF model consists of two main components, which each explains the future income streams that are expected to yield to the company. In principle, the formula could be expressed as a function of all the future cash flows discounted at WACC (with only the first part of the formula). However, the practice of discounting each and every of the future can be a tedious process, and it has hence evolved as a common practice to use a terminal value to determine the remaining value after the growth of the firm has stabilized. The second part of the equation is this terminal value, and accounts for the value created after the explicit forecast period. The terminal value tends to capture between 80% and 90% depending on the length of the forecast period (denoted by n in the formula) (Young et al., 1999). The length of the forecast depends on the nature of the company, but it is in general a good idea to use 10 to 15 years of data. Using a shorter explicit forecast period tends to result in undervalued companies (Koller et al., 2010).
When the formula has been estimated, one can obtain the value of equity by incorporating the value of non-operating assets and then subtracting the value of all non-equity claims outstanding (Damodaran, 2005a). The valuation using the free cash flow to the firm can be illustrated as follows.
Adjusted Present Value Model
The Adjusted Present Value, also referred to as valuation by parts, has been argued to be a better valuation model when the capital structure is complex and when the financial side effects are important (Koller et al., 2010). The model can be estimated based on four or more steps, depending on how many different sources capital there are and how the analyst wants to separate the enterprise value. First, the firm is valued as a fully equity financed (unlevered) company and discounted using the unlevered cost of equity. Secondly, the benefits of leverage (provided by the tax shields you obtain) are valued using the cost of debt as the discount rate. Thirdly, the cost of leverage, referred to as cost of financial distress, is valued. Finally, the individual components of value are totaled to reach the value of the firm.
Value of Business = Value of Unlevered Firm +Value of Tax Benefits −Value of Bankruptcy Costs
The real value of this approach is that it provides a more complete and transparent perspective on where the value resides and it can be used as an effective tool to improve value. The formula above can be broken down and expressed as follows (Damodaran, 2006).
Value of Unlevered Firm = FCFFt
(1+ rU) t + FCFFn+1 rU− gn " # $ % & ' (1+ rU) n t=1 t=n
∑
Present Value of Tax Shields (PV (TS)) = TC⋅ rD⋅ Dt
(1+ rD)
t = TCD
t=1 t=n
∑
Present Value of Bankruptcy Costs =πa⋅ PV (BC)
The former of the equations is identical to that of the FCFF, apart from the fact that it discounts the cash flows at the unlevered cost of equity, thereby obtaining the value of the company without debt. The second equation yields the value of future tax shields when the amount of debt is held constant and considering that these tax
110# 140# 100# 120# 180# 427.5# 20# 70# 15# 65# 110# 90# 70# 85# 55# 70# 427.5# Free$cash$flow$ $ $$$$$Enterprise$Value$ Discount#free#cash#flow#by# the#weighted#average#cost# of#capital# ACerDtax#cash#flows# to#debt#holders# Cash#flow#to## equity#holders# Equity#value# 227.5# Debt#value# 200.0# Figure'2:'Enterprise'Valua2on'of'a'Single6Business'Company,'(Kaplan'et'al.,'2010,'p'103)''
shields are as uncertain as the principal and interest payment on debt (discounting with cost of debt). However, it may be unreasonable to use this formula if the firm is growing and expects to increase its debt proportionately with the growth of the firm. This way, the formula is better expressed as (Luehrman, 1997a):
Present Value of Tax Shields = TC⋅ rD⋅ Dt
(1+ rD) t + TC⋅ rD⋅ Dt rD− gn # $ % & ' ( (1+ rD) n t=1 t=n
∑
The expected bankruptcy costs are a function of the probability of default and the costs of bankruptcy. This is often the element in the APV that constitutes an estimation problem since neither the probability or the cost of bankruptcy can be directly observed (Damodaran, 2005a). However, Damodaran (2010) suggest the use of default rates for the given bond rating of the company to find its probability of default. And in assessing the bankruptcy costs he recommends assuming a percentage of firm value, or a scenario-based calculation.
The APV valuation process can be illustrated as in Figure 3 below, where the values of the company are unbundled and rebundled to find its value (Luehrman, 1997a). The valuation approach has both advantages and disadvantages. It provides us with the opportunity to calculate the value of a company with changing capital structure, and to get more insights into where value is created. However, the difficulty of the model lies in the estimation of default and the cost of bankruptcy.
Under the same assumptions, the APV and the cost of capital should provide the same firm value (Damodaran, 2010).
10# 35# 7.5# 32.5# 55# 427.5# Equity'Value' Discount#free#cash#flow#to# equity#by#the#cost#of# unlevered#equity# Figure'3:'Adjusted'Present'Value'of'a'Single7Business'Company,'based'on'informa?on'from'(Luehrman,'1997a)'' 90# 70# 85# 55# 70# 227.5# Value'of'Financing'Side'Effects'
+'
A35# A7.5# A32.5# A65#÷'
A10# 100# 10# 35# 7.5# 32.5# 55# 100# 10# 35# 7.5# 32.5# 65# 120# A120#Posi9ve'Side'Effects' Nega9ve'Side'Effects' Enterprise'' Value' Discount#posiDve#cash#flow# from#financing#acDviDes#at#their# respecDve#risk#adjusted#rates# Discount#negaDve#cash#flow# from#financing#acDviDes#at#their# respecDve#risk#adjusted#rates# e.g.'Interest'Tax'Shields' e.g.'Costs'of'Financial'Distress'
2.1.3 Relative Valuations
In discounted cash flow valuation, the value of a firm is determined by analyzing variables such as future cash flows and growth, and their underlying levels of risks. However, in relative valuation, the value is determined by examining similar assets that are already are priced in the market (Damodaran, 2010). This approach is based on the explicit assumption that the market “makes mistakes on individual stocks, but are correct on average” (Damodaran, 2005a, p. 769). This can be illustrated by the following graph, where the multiple is the straight black line (the average market expectation) and the blue dots illustrates individual companies’ performance.
A note to multiples is that they can yield completely different conclusions about value depending on which set of multiples that are applied to the company (Goedhart, Koller, & Wessel, 2005). For this reason it is important to choose a set of multiples that provides precise and unbiased estimates for value. It is also noteworthy to mention that it is useful to use several multiples in the valuation in order to reach a value that is reliable. Computing several multiples can provide an analyst with a perspective on what drives the value and elements that may provide a more sound valuation.
Multiples can be of financial or non-financial nature, where the non-financial are more suitable for companies with small or negative profits (Goedhart et al., 2005). The financial multiples can be separated into equity-value multiples and total enterprise multiples. In both categories the multiples’ distributions are positively skewed, i.e. the mean of the multiples are larger than the medians (Lie & Lie, 2002). This leads us to suggest that the median is a more proper measure for the multiple, compared to the mean.
Mul$ples:)Assumes)Market)Expecta$ons)for)Value)on)Average)are)Correct) Figure'4:'The'Principal'Assump5on'of'Rela5ve'Valua5on' e.g.'' Enterprise'' Value' e.g.' EBITDA'
Lie and Lie (2002) reports in their analysis of multiples that total enterprise multiples are better estimates of value, and that the multiple Enterprise Value / Book Value yields the most accurate estimator. The reason for the lower precision of the equity valuation multiples are that they include nonoperating or extraordinary items, which lead to misleading multiples (Goedhart et al., 2005). Further, an adjustment that has been advocated is the use of multiples based on forecast rather than historical returns (e.g. Liu, Nissim, & Jacob, 2002; Kim & Ritter, 1999). This adjustment yields greater accuracy and lower prediction error.
When the proper multiples are obtained, it is necessary to find set of comparable companies in order to find a multiple that reflects proper market expectations. Damodaran (2005a) states that all multiples are a function of risk, growth and cash flow generating potential, and hence the companies in the peer group should be comparable on these variables. However, Andrew Alford (1992) found in his research of 4,698 companies that choosing the peer group based on industry, in general, led to improved accuracy of the valuation. Similar results where also found by Kaplan and Ruback (1996). Furthermore, it has been found that industries classified using the Global Industry Classification Standard (GICS) system are significantly better at explaining cross-sectional variations in multiples (Bhojraj, Lee, & Oler, 2003). Still, it is important to not overlook the fact that the companies should have roughly the same growth rates, returns on invested capital, and capital structure (Goedhart, Koller, & Wessel, 2005).
The research on relative valuation suggests that it can provide reliable estimates of value. Furthermore, the approach is given considerable amount of attention by analysts in equity research valuations and acquisitions (Damodaran, 2005a). Koller et al. (2010) suggest using the multiples as a supplement to the DCF valuation as a means to give valuation a reality-check and to control if the valuation makes sense.
Financial'Mul*ples' Non0Financial'Mul*ples' Equity'Valua*on' Total'Enterprise'Valua*on' Total'Enterprise'Valua*on'
Price/Earnings, Price/Forecasted,Earnings, Enterprise,Value,/,Sales, Enterprise,Value,/,Book,Value, Enterprise,Value,/,EBITDA, Enterprise,Value,/,EBIT, Enterprise,Value,/,Web,Site,Hits, Enterprise,Value,/,Number,of,Subscribers, Table&1:&Examples&of&Financial&and&Non6Financial&Mul9ples&
2.2 M&A Essentials
The globalization, geographic diversification and deregulation of markets have been key drivers of mergers and acquisitions across the word (Zenner et al., 2008). The last decade, acquisition activity levels have been soaring (Barkema & Schijven, 2008). However, the conventional wisdom on mergers and acquisitions is that they tend to fail in delivering value. If this was true and failure was inevitable, would not the observed M&A activity in the long run disappear?
In this section important features of M&A will be discussed. Firstly, the distinct types of acquisitions will be established. Secondly, the opportunities created by acquisition will be discussed in the light of valuation considerations. Thirdly, the reasoning behind M&A and structure of the deal will be discussed. Finally, the issue will be examined when taking the shareholders into considerations.
2.2.1 Classifying Acquisitions
Although M&A is referred to as one sort of activity, it can be made a distinction between different types depending on who acquires the company and how the companies intend to operate after the transaction. Damodaran (2002) distinguishes between acquisitions where the acquirer is a company, and where the acquirer are existing managers or outside investors. In this paper, the main focus will be on acquisitions by companies. Damodaran (2002) distinguishes between the transaction types between companies as follows:
• Mergers – target firm becomes a part of acquiring firm
• Consolidations – target firm and acquiring firm becomes a new firm
• Tender offers – target firm continues to exist as long as there are dissident stockholders holding out (successful tender offers ultimately become mergers) • Acquisition of assets – target firm remains as a shell company, but assets are
transferred to the acquiring firm
The acquisition-types with the greatest relevance to this paper are mergers, consolidations and tender offers. These are acquisitions that are virtually the same when considered in the long-term. Tender offers tend to ultimately become mergers, while consolidation is a merger of the companies into a new entity.
2.2.2 Creating and Valuing Synergies
M&A frequently creates new opportunities for the combined firm, and the value generated from these opportunities is referred to as synergies. The synergies are not to be confused with value of control, which is the value of operating the company more efficiently under different control (Damodaran, 2005c). The two elements need to be valued separately in order to obtain a reliable estimate for the value.
Damodaran (2005b) categorizes the synergies into operating synergies that improves operations of the combined company (e.g. economies of scale), and financial synergies that affects the cash flows or the cost of capital (e.g. tax benefits). Moreover, he argues that the best way to attain an unbiased value of synergies is through a three-step procedure. First, the companies involved in the transaction should be valued independently. Second, the combined company should be valued by adding the values found in the first step. Third, the value of the combined company with synergies should be calculated. The synergies will be the difference between the values found in step two and step three. The process can be illustrated as follows.
Some synergies yield value that is more apparent than others, and some tend to be perceived as value improving for the wrong reasons. For instance, use accretive acquisitions of targets with lower earnings per share (EPS) in order to gain an immediate value improvement. This should clearly not add value to the firm apart from the synergies that are apprehended by investors. However, a study on EPS accretion found that it actually yields value, albeit most apparent for companies with unsophisticated investors (Andrade, 1999). Another dubious synergy is the purchase of prospective high growth companies. High growth companies are often highly priced and they will only yield value if the right price is paid.
As not all synergies are equally pronounced and some can be dubious in nature, it is important to exercise with caution when valuing these. In addition, Damodaran (2005b) argues that if the synergies are substantial they should be fairly allocated based on the benefits the companies add to the combined company.
2.2.3 The Focus of the M&A
The potential synergies that are created in M&As are often said to be the underlying motivation behind acquisitions (Damodaran, 2005b). However, these projected synergies often prove to be illusory (e.g. Damodaran, 2010; Buffett, 1997). A frequent question asked in M&A is whether to pursue a diversified or a related acquisition strategy. Morck, Shleifer and Vishny (1990) suggest that managers are motivated to take on diversified acquisitions to make up for poor performance, reduce risk and assure survival of the company. They further report that this type of acquisitions have been performing poorer than related acquisitions. Bruner (2004) argues that the benefits are clearer and easier to exploit in related acquisitions, and they hence provide higher returns. However, the findings on M&A diversification are not unanimous. A study by Morck and Yeung (1997) finds that companies that are information-intensive (e.g. R&D) can benefit from diversification because they possess valuable intangible assets that are problematic to trade. The acquisition of such type of assets can be justified by the potential additional synergies created.
Figure'5:'Steps'in'Valuing'Synergies,'based'on'informa9on'from'(Damodaran,'2005b)''
Step%1:% % % % % %%%%%%Step%2:% % % % %%%%%%%Step%3:%
90# 70# 85# 55# 70# 227.5# 30# 24# 28# 19# 23# 76# Value#the#firms#involved#in#
the#merger#independently# EsAmate#the#value#of#the#combined#firm#without# synergies,#by#adding#the#two# independent#valuaAons# Revalue#the#combined#firm# with#synergies# Target' Acquirer' Value'of'
Target' Acquirer'Value'of'
227.5# 76# Value' Combined' 303.5# 116# 101# 128# 92# 98# 353# Independent'Valua9ons'of'Target' and'Acquirer' Value'of'Combined'Firm'with' Synergies'
2.2.4 The Optimal Structure of the Deal
The optimal structure for the M&A depends largely on the acquisition itself, but research has still managed to find some useful guidelines on method of payment. The alternatives that are present for the acquiring companies are cash-based deals, stock-based deals, or a combination of the two. Acquirers tend to use cash rather than stocks to finance their transactions whenever possible (Zenner et al., 2008). Cash-based deals are frequently associated with better returns than stock-only deals (Bruner, 2004). For instance, Heron and Lie (2002) studied the relationship between payment type and the operating performance of M&As. They reported no significant differences in operating performance based on payment type, however, returns on cash-based deals were higher compared to stock-based deals. Bruner (2004) reports that cash deals tend to have neutral or positive returns, while the straight stock deals tended towards negative returns. It has been suggested that the reason for this negative return is the market’s perception of the acquiring company’s stock. Since managers possess private information about the company’s financial position, they tend to finance deals with cash when its stock is undervalued, and with a stock-based structure when its stock is overvalued (Loughran & Vijh, 1997). Hence, the market perceives stock deals as an indication of overvaluation, and accordingly adjusts for this.
A supplement to cash-based and stock-based payments is the use of earnouts. An earnout provides the deal with a variable payment that is contingent on future performance. Several studies have reported that the use of earnouts has induced higher returns for both payment methods (Bruner, 2004). The acquirer can utilize it as risk management tool for the targets future performance, and improve chances of a successful merger. However, this is a tool that is more appropriate when the target company’s managers have large ownership stakes.
2.2.5 What About the Shareholders?
When considering synergies and the structure of the deal it is of high importance to also have the acquisition price in mind. The value created for acquiring shareholders will directly depend on the price paid for the target. If the premium paid for the target is larger than the potential synergies that can be obtained, the transaction will yield a value loss for shareholders (Damodaran, 2005b).
Book$Value$ of$Equity$ Goodwill$ Acquisi6on$ Premium$ Acquisi'on*Price*of* Target*Firm* Market*Price*of*Target* Firm*Prior*to*Acquisi'on* Book*Value*of*Equity*of* Target*Firm*
Koller et al. (2010) defines the value created for the acquirer with the following formula.
Value Created for Acquirer = (Standalone Value of Target +
+Value of Performance Improvements) − (Market Value of Target
+ Acquisition Premium)
There has been a fair amount of research on the value gain in acquisitions, both for acquirers and for targets. A study performed by Jarrell and Poulsen (1989) revealed that in the short-term, acquirers has a hard time creating value, and that the excess return usually was negative. A similar fashion, Agrawal, Jaffe, & Mandelker (1992) researched the long-term performance of acquirers in M&A transactions. They report that acquiring companies suffer significant losses over the five-year period following the transaction. In more recent and uplifting survey by Robert Bruner (2004), he reports that close to half of his sample experienced value creation, while the remaining companies either had value preservation or value destruction.
The findings for value creation for target companies are more evident. Early studies on the topic suggest that targets in general are able to obtain positive abnormal returns (Asquith & Kim, 1982). The same results are obtained in Bruner’s more recent survey, and he states that “the M&A transaction delivers a premium return to target firm shareholders” (Bruner, 2004, p. 66).
Some research has also considered the merged company as a whole. One such study was performed by Bradley, Desai and Kim (1988), they found an increase in the combined value with an average of 7.4%. Furthermore, they found the value creation to be in line with the literature presented above, i.e. the targets contributed with most of the value creation while the acquirers had negative or neutral creation of value.
In the same vein, the premium paid for the target can affect the acquirer’s performance. Sirower and Sahni (2006) present a useful framework for boards when considering the premium to be paid for the target in relation to potential synergies. Their model, Meet the Premium (MTP) line, defines the premium paid for the target in relation to cost and revenue synergies (operating synergies). The model offers a
Research(Indicates(That….(
Company( Value( Crea9on(
Acquirer( Target( Combined!Company( Neutral(to(
nega7ve( Posi7ve( Posi7ve(
sanity check for assessing a sensible price range in the transaction, given various combinations of synergies (Sirower & Sahni, 2006). In order for a premium to be justified it has to be located above the MTP line, and at the same time within the “plausibility box”, which specifies upper ranges for synergies that can be obtained.
Using this framework, managers will be able to consider the premium in relation to potential synergies, which may provide a better estimate for the premium and the potential value losses may be avoided.
2.2.6 Concluding Thoughts
Media frequently presents M&As as a worrisome case that never succeeds, but is this right? It is true that the findings within M&A are found to fail and that research somewhat inconsistent in providing clear conclusions on M&A effectiveness. Nevertheless, presenting all M&As as a failure waiting to happen is clearly a misstatement.
Research shows that most M&A manage to add value to the economy as a whole. And the existing literature on the topic has inarguably added some valuable insights for practitioners, academics and current managers. However, it is argued that the problem with current research is that it is of semi-strong form and not strong form (Bruner, 2004), meaning that if the conducted studies were of strong form one could, with certainty, draw conclusions on what would have happened if the merger had not been executed. In addition, future research could benefit from a more consistent and organized classification of types of acquisitions that actually adds value for both target and acquirer. Furthermore, a thorough improvement of Damodaran’s (2005b) framework for fair sharing of the benefits of synergies could also prove to be a valuable tool in making acquisitions more successful.
More consistent research and additional useful tools for managers could lead to value enhancement to shareholders of both companies as well as additional value creation for the economy as a whole.
Figure'8:'The'Meet'the'Premium'(MTP)'Line'(Sirower'&'Sahni,'2006,'p.'90)'' 0%' 5%' 10%' 15%' 20%' 0%' 10%' 20%' 30%' 40%' 50%' A" B" C" A" C" B" Insufficient"Synergy"Mix" Insufficient"Synergy"Mix" Sufficient"Mix"of"Cost"and"Revenue"Synergies" 35%$Premium$ 18%$EBIT$Margin$ % SynC $ %SynR$ Upper"Range"for"Cost"and"Revenue"Synergies""
3.
Company and Industrial Analysis
In order to perform an accurate and reliable valuation of a company it is important to have extensive insight into the companies in question, and into their respective industries (Koller, Goedhart, & Wessels, 2010). Having a perspective on this can reveal valuable information on value drivers in the company and its industry, possible competitive advantages, and noticeable trends that may evolving that alter the valuation.
In this part of the paper, an outline of Microsoft Corporation (Microsoft) and Activision Blizzard, Inc. (Activision Blizzard) will be presented. Subsequently, the industries where the companies perform their day-to-day operations will be discussed. The latter part will also be discussing current trends in the industry as well as future developments in terms of products.
3.1 The Companies
For the purpose of this paper, the companies will be discussed with an acquisition perspective in order to understand the companies’ main operational business and what makes them distinct from other firms. For a more sound understanding of each of the companies, their divisions and their competitive position, Appendix 1 provides a company overview and a SWOT-analysis for each respective company.
3.1.1 Microsoft Corporation (MSFT)
Today, Microsoft is ranked among the 500 largest companies in the world in terms of revenue, ranking above all competing computer software providers (Fortune, 2011). The company provides a wide selection of technological products for professional clients as well as consumers. The products include Microsoft Office suit, online search engine Bing, Xbox 360 gaming console, various video games and operating systems for computers, servers and mobile phones (Microsoft Corporation, 2011a),
The company has a healthy capital structure composed of 83% equity and 17% long-term debt. It has a positive working capital and generates a financing source through the short-term operating cycle (through short-term liabilities) (Microsoft Corporation, 2011a). This capital structure enables Microsoft to create positive net cash that can be used for investment purposes or such (see Appendix 2 for more details).
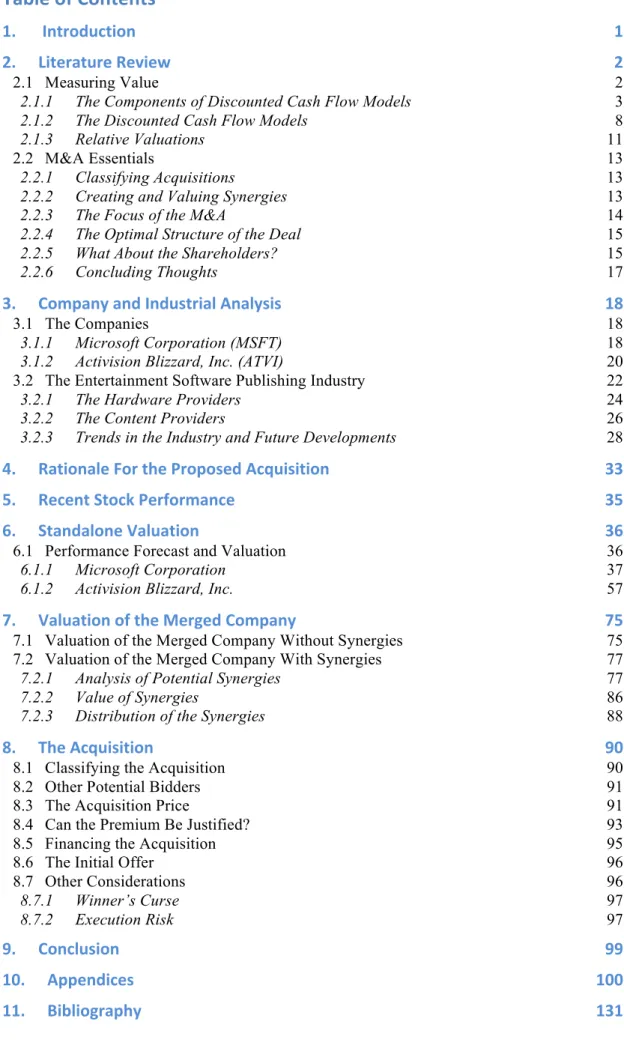
In 2011, Microsoft reported annual revenues totaling almost US$70 billion, and a net income exceeding US$23 billion, obtained from five different business segments. On the next page is an illustration of the revenue development in Microsoft’s specific segments for the last three years. As can be seen in the figures, Microsoft has an own specific division for each market.
The figure shows that Microsoft has experienced an average positive revenue growth of 9.4% year over year (yoy) from 2009 to 2011. A considerable part of the revenue accrues from three of the divisions, which in total accounts for 82% of all revenues. All of these divisions have growth that is fairly close to the average of the business. The Entertainment and Devices Division (EDD) possesses the highest growth of 16.6%. When analyzing the total revenue growth in the period from one year to another, growth was almost twice as high in 2011 compared to 2010 (Appendix 3).
The division with the highest revenue growth serves the market with the greatest importance for the purpose of this paper, namely the entertainment software industry. The growth in this industry can be recognized as the main driver for the acquisition of Activision Blizzard. Consequently, the following discussion will be directly linked to this division. For more information on the other divisions and segments the reader is referred to the first part of Appendix 1.
The EDD offers products meant to entertain and connect people. Principal products and services marketed include Windows Phone, Mediaroom, the Xbox 360 and related products and accessories (detailed product overview and description can be found in Appendix 4). The products associated with the Xbox 360 account for a significant proportion of the revenues, almost 90% of the total over the three-year period. In 2011, Microsoft (2011a) sold 13.7 million Xbox 360 consoles, an increase of 33% from previous year sales of 10.3 million consoles. At present, Xbox 360 consoles have an installed base of 65.8 million worldwide (Microsoft Corporation, 2012d).
The increased sales of Xbox 360 and associated products are the main cause for the recent revenue growth. Increased sales has also lead Microsoft to experience cost increases of 11.2% yoy in this segment as a result of higher cost of revenue, higher marketing expenses and increased cost of R&D (Microsoft Corporation, 2011a). The higher costs partly offsets the increase in revenues and results in an
!"!!!! !10,000!! !20,000!! !30,000!! !40,000!! !50,000!! !60,000!! !70,000!! !80,000!! 2009$ 2010$ 2011$ Re ve nu e& Segment&Informa0on&MSFT& Unallocated$and$other$ Entertainment$and$ Devices$Division$ Microso8$Business$ Division$ Online$Services$Division$ Server$and$Tools$ Windows$&$Windows$ Live$Devision$ In!million!$! CAGR& 35.5%! 16.6%! 7.0%! 9.5%! 7.9%! 9.8%! 9.4%% Avg.% 27%! 24%! 4%! 31%! 13%! 1%! Segment&Informa0on&MSFT& Windows$&$Windows$ Live$Devision$ Server$and$Tools$ Online$Services$Division$ Microso8$Business$ Division$ Entertainment$and$ Devices$Division$ Unallocated$and$other$ Figure!9!and!10:!Segment!informaBon!for!ATVI,!based!on!informaBon!from!(AcBvision!Blizzard,!Inc.,!2011)! 58,437! 69,943! 62,484! In#million#$# CAGR% )19.3%# 21.7%# 16.6%% Avg.% #)#### #1,000## #2,000## #3,000## #4,000## #5,000## #6,000## #7,000## #8,000## #9,000## #10,000## 2009$ 2010$ 2011$ Re ve nu es % Entertainment%and%Devices%Division%%% A'ributable$to$ other$products/ services$ A'ributable$to$ Xbox$360$pla<orm$ Figure#11:#Entertainment#and#Devices#Division#(MicrosoG#CorporaJon,#2011)# 6,416# 6,224# 8,716#