Abstract-The main objective of this research is the study of vulnerability to pollution in an unconfined karstic aquifer system. Aquifer vulnerability assessment to define critical zones of contamination is a core issue an effective monitoring network for groundwater management.
Vulnerability integration is addressed for risk valuation and risk–benefit considerations, focusing the requirements of the European Community’s Water and Groundwater Directives. The development of an integrated vulnerability assessment methodology can be useful for the effective management and protection of this valuable freshwater source. The research insights suggest that an effective governance is mandatory as the future highway, the prison and the airport are overlaying the aquifer’s most vulnerable areas.
Index Terms—Groundwater management, vulnerability, geostatistics, environmental risk.
I. INTRODUCTION
Cleaning and restoring contaminated groundwater has been often technically difficult and a considerable financial burden. Otherwise, searching for alternative sources for water supply is not always feasible. Therefore, the most efficient and realistic result is to prevent groundwater from pollution. A comprehensive regional approach, identifying vulnerability patterns of groundwater to contamination can be a utilitarian instrument to make out this valuable resource.
Vulnerability can be somehow an ambiguous concept. Several sources provide a sound overview of different definitions for vulnerability assessment [1-5]). Vulnerability, as a relative aquifer’s characteristic, is a non-measurable and dimensionless property and should be used as an indicator for risk assessment. The identification of “cold” and “hot” vulnerable spots, and the subsequent overlapping of impacting activities provides policy makers guidance in overcoming urban water governance challenges. In this paper, was used the DRASTIC method [6], a non-parametric method widely used [7-10].
Manuscript received October 7, 2014.
Sanz G. is at University of Vigo, 36310Vigo Spain (e-mail:[email protected]).
Albuquerque M.T.D. is at Polytechnic Institute of Castelo Branco, 6001-909 Castelo Branco Portugal (e-mail: [email protected]).
Martínez-Alegrìa R. is at European University of Miguel Cervantes, 47012 Valladolid Spain (e-mail: [email protected]).
Antunes I.M.H.R. is at Polytechnic Institute of Castelo Branco, 6001-909 Castelo Branco Portugal (e-mail: [email protected]).
Taboada J.C. is at University of Vigo, 36310 Vigo Spain ([email protected])
In the herein work, the results of the vulnerability mapping using DRASTIC are used as an attribute for the sustainability study of the unconfined limestone aquifer of Montes Torozos, Duero river watershed. Torozos area (total area= 10000 km2), is situated in the central northwest of the Iberian Peninsula, extending between the Spanish provinces of Valladolid and Palencia (Fig. 1), encompassing 57 municipalities and parishes [11] with a population around 47000 inhabitants [12]. The main human activities are agriculture and livestock. The anthropogenic impact has grown exponentially in the last fifty years, primarily due to alterations in consumer habits which induced environmental changes and deferred direct effects on the endangered population.
Fig.1. “Montes Torozos” localization - Duero watershed.
The study area has a temperate weather with dry summers and middle temperature, average rainfall of 456 mm/year and 11.14ºC/year [12].
II. MATERIAL AND METHODS
A. Review
Many different methods have been developed for assessing groundwater vulnerability. The DRASTIC method is a point count system model (PCSM) for assessing the intrinsic vulnerability [6]. The acronym DRASTIC stands for the parameter included in the method: Depth to water (D), net Recharge (R), Aquifer media (A), Soil media (S), Topography (T), Impact of vadose zone (I) and hydraulic Conductivity (C) of
Hydrogeological vulnerability assessment in
Urban systems, Spain
the aquifer. The calculated DRASTIC indices are roughly analogous to the likelihood that contaminants released in a region will reach groundwater: higher scores translate into a higher likelihood of contamination [6].
The DRASTIC method includes a numerical index computed as a weighted summation of the seven model parameters. The important media types or categories of each parameter set out between 1 (lower vulnerability) and 10 (higher vulnerability) based on their relative effect on the aquifer. The seven parameters are then assigned weights between 1 and 5 reflecting their relative importance [6].
The DRASTIC has been well accepted in many studies all around the world [13-16]. Recent publications have demonstrated the importance of vulnerability computation in developing nations like China [17], Tunisia [18], Iran [19], among others. The impact of natural and anthropogenic activity assessment is a target issue to a sustainable groundwater resources’ policy guidance in overcoming urban water governance challenges.
B. Layers Construction and Assumptions
Depth to Water (D) parameter was obtained from piezometric head data recorded during 2010-2011 field campaign in 65 wells and 40 springs, homogeneously distributed in the study area (Fig. 2) and interpolated through a geostatistics methodology. In any geostatistical study, an important consideration is the choice of an appropriate, repeatable, and objective search strategy that controls the nearby samples to be included in the location-specific estimation procedure. In order to achieve more reliable sample, in 6 georreferenced points (Fig.2; Black dots) the piezometric level was estimated. Linear regression was taking into account the geological contacts. At last the estimated values were compared with the dataset available in the Confederación Hidrográfica del Duero (Spain) [20].
Fig.2.Sampling Design: gray dots – well and spring collected water points; black dots – estimated points.
The next step was the spatial structural study by computing
the experimental variogram and fitting the most suitable model.
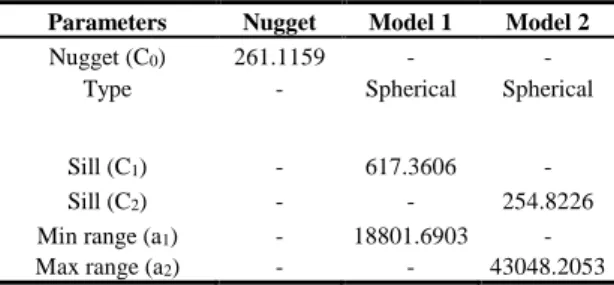
For the 111 piezometric head data, was used a combination of nugget and two nested spherical models to capture variability in an omnidirectional experimental variogram (Table I).
TABLE I:VARIOGRAM PARAMETERS
Parameters Nugget Model 1 Model 2
Nugget (C0) 261.1159 - -
Type - Spherical Spherical
Sill (C1) - 617.3606 -
Sill (C2) - - 254.8226
Min range (a1) - 18801.6903 -
Max range (a2) - - 43048.2053
The two nested structures points to a short distance correlation (range=18802 m) which is predominantly representative in the northeaster of the area and a second structure (range= 43048 m) indicating a long distance correlation which is primarily represented in the southwestern portion of the aquifer (Fig. 3).
Fig.3. Estimated Aquifer Depth layer using ordinary Kriging.
All climatic values have been calculated from Villanubla serial data, located near Monte Torozos area. Other meteorological stations have been turned down as their temporal serial data were incomplete or inaccurate. The values of this meteorological station are useful for any place of Montes Torozos since there are not physiographic borders or micro-climate’s worth notify. It is concluded, that Villanubla meteorological station is the most representative to calculate mean values of precipitation and temperature. The average precipitation and temperature data are the start parameters to calculate the recharge. The recharge has been calculated through useful rain data. The useful rain is the rest of average accumulated precipitation and average real
evapotranspiration and was computed using Turc’s methodology [21].
The aquifer’s net recharge parameter (R) has been calculated taking into account the precipitation and the temperature serial data (1936-2006) [12]. The annual net recharge’s values is 178 mm/year (Drastic level = 6), this value was contrasted with a value of Libro Blanco Del Agua [22]. The obtained DRASTIC value of ten shows a significant contribution of this parameter for vulnerability computation. Net recharge has been correlated with the flow of spring waters which drain to the karstic aquifer. The Pearson correlation index (0.91) was calculated between the natural logarithm of the flow measured on the water springs and the annual average precipitation observed on each spring nearest point using the meteorological Villanubla station’s dataset. This correlation will find out a relation between rainfall and discharge. As the correlation showed to be of 0.91 is possible to conclude that the difference between the rainfall amounts and the spring’s flow corresponds to the recharge after the subtraction of the real evapotranspiration (ET0). In order to compute the ET0, the Turc's methodology was used [21].
The real evapotranspiration has been reckoned with the following equation: 2 2 0 9 . 0 L P P ET Where:
ET0 is the real Evapotranspiration [mm/yr] P is the average accumulated rainfall [mm/yr] t is the average temperature [ºC]
An average real ET0 of 312 mm/year and an average recharge of 178 mm/yr were computed and the correlation coefficients between the natural logarithm of the monthly accumulated rainfall and flow rate calculated. To avoid distortions from the extraction wells during irrigation processes, and taking into account periods of recharge and drought, only the months of October to February were used for 2010-2011 years, as they accumulate more than 50% of the annual precipitation. There is an annual inertia (within the same hydrological year) where the maximum precipitation generates maximum flow and it is approximately of 4 months. The aquifer media parameter (A) was determined taking into account the lithostratigraphic layers [23]. The soil parameter (S) was evaluated using observations collected in the field campaigns, during 2012. Since soil is rather superficial or absent throughout the entire study area, this parameter received the DRASTIC value of ten and will contribute significantly to the computation of vulnerability. The surface slope parameter (T) was established using the Digital Elevation Model (DEM) for the study area [24], after reclassification into the correspondent DRATIC's classes. There are not high slopes, only on borders could be observed slopes between 6-12 %. The vadose zone impact parameter (I) was computed taking into account the aquifer's lithological information. It is an acceptable assumption as groundwater
has shallow characteristics, where water circulation is primarily controlled by the lithological characteristics. Limestone has the highest intrinsic vulnerability associated (Drastic level = 10). The hydraulic conductivity parameter (C) was assigned the value of 1.00 x10⁻⁴m/s based on literature research [20] and corresponding to the DRASTICS’s class number ten, so a low contribution in the subsequent vulnerability computation.
III. RESULTS AND DISCUSSION
The vulnerability maps are a strong tool for inferences and can be used for risk analysis. Taking into account the vulnerability patterns from the study area it will be possible to formulate a sustainable territory management. In fact, the road network and other infrastructures are overlaying the most vulnerable areas (Fig. 4) and the constructed vulnerability maps may help to design and plan some corrective, compensatory or protective measures [25].
Fig.4. DRASTIC mapping.
Note wide the existence of a higher vulnerability in the central region of the aquifer, being overlaid in the south part by hazardous infrastructures such as airport, industrial area and the principal highway (Fig. 4). Near the electric plant there is a gas plant with potential leakage issues and dangerously close to the freshwater’s spring La Mudarra (Fig. 4).
The use of a geostatical approach for the definition of the aquifer depth, taking as data the piezometric levels, allowed the establishment of its spatial structure. Although it was not possible to model the geometric anisotropy, the results showed up a good spatial correlation and an experimental variogram with two different structures stress the presence of
Airport
State Jail Electric station N-610
two different hydraulic behavior, north and south respectively. Two spherical models were fitted, the first with an amplitude of 18801m and the second of 43048m, corresponding, the first one to the north zone (Fig.3 – zone 1) and the second one to the south zone (Fig.3 – zone 2). The differences in the hydraulic parameters can be explained by the geology and also due to the visible throat effect (Fig. 4). The weight of this two spatial structure in the vulnerability computation must be underlined.
IV. CONCLUSION
Vulnerability maps are a powerful tool for hazard analysis and territory’s sustainable management. Mostly when in the presence of highly dangerous hazards, allowing consistent monitoring and adopting preventive and remediation measures.
The most vulnerable areas are located in the central part of the aquifer, which coincides with the highest phreatic level, where the water is closer to the surface. This proximity allows an easy access to groundwater and for that also the most requested for the placement of the hazardous equipment.
The hazard equipment are overlaying the high vulnerable areas, which requires monitoring and taking protective and feasibility actions in future, related to urban activities, airport, roads and electrical plants’ locations.
According to the DRASTIC parameters, Monte Torozos aquifer has a high intrinsic vulnerability associated with its own hydrogeological characteristics. It is important to underline the importance of the piezometric head data for the aquifer conceptual model design. The variographic study showed up the presence of two different and independent hydraulic behaviors, concerning to the south and the north zones, respectively, and was essential to the aquifer geometry definition.
Vulnerability assessment is core knowledge for management optimization and planning, namely in which concerns to road winter maintenance (with massive discharges of brine), traffic of dangerous goods (mainly fuels), urban and industrial waste management, and leak control. Constituting a powerful tool, within the European framework of sustainable development, for the implementation of environmental emergency plans and the construction of prediction scenarios for outbreak crises associated with such activities.
REFERENCES
[1] Y. Bachmat and M. Collin M, Mapping to assess groundwater vulnerability to pollution. V.W. Duijvenbooden and V.H.G. Waegeningh (Eds): Vulnerability of soil and groundwater to
pollutants. Proceedings and Information 38. TNO Committee on
Hydrological Research, 1987, pp. 297–307.
[2] S.S.D. Foster, Fundamental concepts in aquifer vulnerability, pollution risk and protection strategy. V.W. Duijvenbooden and V.H.G. Waegeningh HG (Eds): Vulnerability of soil and groundwater to
pollutants. Proceedings and Information 38. TNO Committee on
Hydrological Research, 1987, pp. 69–86.
[3] C.K. Singh, S. Shashtri, S. Mukherjee, R. Kumari, R. Avatar, A. Singh and R.P. Singh, “Application of GWQI to access effect of land use change on groundwater quality in lower Shiwaliks of Punjab: remote
sensing and GIS based approach,” Water Resour Manag, 25, pp. 1881–1898, 2011.
[4] P. Vishnu, P. Sangam, S. Saroj, K. Chapagain and F. Kazama, “A framework for measuring groundwater sustainability”, Environmental
Science & Policy, 14/4, pp. 396-407, 2011.
[5] P. Ryan, R. Loe and D. Armitage, “A systematic review of water vulnerability assessment tools”, Water Resour Manag, 26, pp. 4327–4346, 2012.
[6] L. Aller, T. Bennet, J.H. Lehr, R.J. Petty and G. Hackett, DRASTIC: a
standardized system for evaluating ground water pollution potential using hydrogeologic settings. U.S. Environmental Protection Agency
EPA/600/2–87/035, Oklahoma, 641 pp, 1987.
[7] J.P. Lobo-Ferreira and M.M. Oliveira, Development of an inventory of
the groundwater resources of Portugal: characterization of groundwater resources and DRASTIC vulnerability mapping of the aquifers of Portugal. LNEC Report 194/93, GIAS/DH, 1993.
[8] M.H. Hamza, A. Added, R. Rodrìguez, S. Abdeljaoued and A.B. Mammou, ”A GIS-based DRASTIC vulnerability and net recharge reassessment in an aquifer of a semi-arid region (Metline-Ras Jebel-Raf Raf aquifer, Northern Tunisia)”, J Environ Manage, 84, pp. 12–19, 2006.
[9] A. Jamrah, A. Al-Futaisi, N. Rajmohan and S. Al-Yaroubi, “Assement of groundwater vulnerability in the coastal region of Oman using DRASTIC índex method in GIS environment”, Environ Monit Assess, 147, pp. 125–138, 2008.
[10] A. Moratalla, J.J.G. Alday, D. Sanz, S. Castaño and J.D.L. Heras, “Evaluation of a GIS-Based integrated vulnerability risk assessment for the mancha oriental system (SE Spain)”, Water Resour Manag, 25 pp. 3677–3697, 2011.
[11] G. Sanz, “Modelo Hidrogeológico para la Gestión Sostenible del Acuífero Superficial Calcáreo de los Montes Torozos”, Ms Thesis, Department of Natural Resources and Environmental Engineering. E.T.S. de Enxeñería de Minas, Univ. Vigo, Spain, 2010
[12] Instituto Nacional de Estadística (May 2013). Padrón, Población por
municipios. [Online] Available:
http://www.ine.es/jaxi/menu.do?type=pcaxis&path=%2Ft20%2Fe260 &file=inebase&L239 =0.
[13] S. Shukla, S. Mostaghimi, V.O. Shanholt, M.C. Collins and B.B. Ross, “A County-Level Assessment of Ground Water Contamination by Pesticides”, Ground Water Monit. Rev, 20(1), pp. 104– 119, 2000. [14] T. Al-Zabet, “Evaluation of aquifer vulnerability to contamination
potential using the DRASTIC method”, Environmental Geology, 43, pp. 203-208, 2002.
[15] M.T.D. Albuquerque, G. Sanz, S.F. Oliveira, R. Martínez-Alegría and I.M.H.R. Antunes, “Spatio-Temporal Groundwater Vulnerability Assessment - A Coupled Remote Sensing and GIS Approach for Historical Land Cover Reconstruction”, Water Resour Manage, 27, pp. 4509–4526, 2013.
[16] F.A.L. Pacheco and L.F.S. Fernandes, “The multivariate statistical structure of DRASTIC model”, Journal of Hydrology, 476, pp. 442-459, 2013.
[17] W. Junjie, H. Jiangtao and C. Honghan, “Assessment of groundwater contamination risk using hazard quantification, a modified DRASTIC model and groundwater value, Beijing Plain, China”, Science of the
Total Environment, 432, pp. 216-226, 2012.
[18] I. Mekki, F. Jacob, S. Marlet and W. Ghazouani, “Management of groundwater resources in relation to oasis sustainability: The case of the Nefzawa region in Tunisia”, Journal of Environmental
Management, 121, pp. 142-151, 2013.
[19] E. Fijani, A.A. Nadiri, A.A. Moghaddam, F.T.C. Tsai and B. Dixon, “Optimization of DRASTIC method by supervised committee machine artificial intelligence to assess groundwater vulnerability for Maragheh–Bonab plain aquifer, Iran”, Journal of Hydrology, 503, 89-100, 2013.
[20] Confederación Hidrográfica del Duero (July 2013), Plan Hidrográfico de la Cuenca Del Duero. [Online] Available: http://www.mirame.chduero.es/DMADuero_09/masaSubterraneaHidr ogeologia.faces.
[21] L. Turc, “Estimation of irrigation water requirements, potential evapotranspiration: a simple climatic formula evolved up to date”,
Annals of Agronomy, 12, pp. 13-49, 1961.
[22] Ministerio de Medio Ambiente, Libro Blanco del Agua en España, España, 2000..
[23] Instituto Geológico y Minero de España. (December 2012), Mapa Geológico de España [Online] Available: http://www.igme.es/internet/cartografia/cartografia/magna50.asp?hoj a=342&bis=.
[24] Instituto Geográfico Nacional Spain (October 2012), Modelo Digital Del Terreno – MDT25. Centro de Descargas del Centro Nacional de Información Geográfica. [Online] Available: http://centrodedescargas.cnig.es/CentroDescargas/index.jsp.
[25] R. Martínez-Alegría, C. Ordóñez and J. Taboada, “A Conceptual Model for Analyzing the Risks Involved in the Transportation of Hazardous Goods: Implementation in a Geographic Information System”, Human and Ecological Risk Assessment: An International
Journal, vol. 9/3, 2003.
Germán Sanz Lobón Valladolid, Spain, Ph.D in
Environmental Technology, 2014, University of Vigo, Spain.
He’s a senior researcher at University of Goiania, Brazil. He’s been working in environmental impact assessment, vulnerability and risk assessment using geostatistical, numerical simulation and GIS tools.
Dr Germán Sanz Lobón worked as senior researcher in the POCTEP project, ÁGUEDA: Environmental models for territorial’s assessment and management. Águeda’s watershed case study.
Teresa Albuquerque Évora, Portugal, Ph.D in
Mining Engineering, 1999, Technical University of Lisbon, Portugal.
She’s an associated full professor at Polytechnique Institute of Castelo Branco, civil engineering department. She’s been working in environmental impact assessment, vulnerability and risk assessment using geostatistical, numerical
simulation and GIS tools.
Dr Teresa Albuquerque is member of IMGA (International Medical Geology Association); IAMG (International Association of Mathematical Geoscience) and she is senior member of the APCBEES-Asia-Pacific Chemical, Biological& Environmental Engineering.
Roberto Martinez-Alegria Oviedo, Spain, Ph.D in
Mining Engineering, 2005, University of Vigo, Spain. He’s an invited professor at Universidad Europea Miguel de Cervantes, Valladolid, Spain and senior researcher at the Spanish agency for civil protection. He’s working in Hydrogeology, geological and environmental hazards.
Dr Roberto Martinez-Alegria worked as hight technician on environmental risk analysis and management for the Spanish Civil Protection Service, and was head researcher in the POCTEP project ÁGUEDA: Environmental models for territorial’s assessment and management. Águeda’s watershed case study.
Margarida Antunes Setúbal, Portugal, Ph.D in
Geochemistry, 2006, University of Coimbra, Portugal. She’s an associated full professor at Polytechnique Institute of Castelo Branco, natural resources department. She’s been working in environmental impact assessment, environmental geochemistry, vulnerability and risk assessment.
Dr Margarida Antunes is member of Portuguese Risk Association (RISCOS); IAMG (International Association of Mathematical Geoscience) and she is senior member of the APCBEES-Asia-Pacific Chemical, Biological& Environmental Engineering.
Javier Taboada Ponferrada, Spain, Ph.D in Mining
Engineering, 1993, University of Oviedo, Spain. He’s a Catedratic full professor at the Universidad of Vigo, Spain. He’s been operating in mining technology, environmental assessment, seismically hazardous and environmental modeling.
Dr Javier Taboada is the coordinator of the Ph.D course in mining engineering at the University of Vigo, Spain. The SISMIGAl software is one of his latest projects aiming the development of a tool for seismic hazard assessment in Galiza, northern Spain.