University of Trás-os-Montes and Alto Douro
Evaluation of the pre-analytical factors effect in the
blood glucose concentration determination and
iatrogenic hyperglycemia effect on leukogram values
Biochemistry Master Dissertation
Ana Clara Sampaio Ribeiro
Advisor:
Prof. Doctor Felisbina Queiroga
Co-advisor:
Prof. Doctor Ana Cristina Ferreira
Jury composition:
This work was expressly elaborated as an original dissertation for the effect
of obtaining the Master degree in Biochemistry at the University of
VII
Acknowledgment
To Reitor Professor Fontainhas Fernandes, from the University of Trás-os-Montes and Alto Douro, for increasingly extolling the name of the academy, enabling students the necessary conditions for conducting research.
To Professor Lucinda Reis and Professor Doctor Francisco Peixoto, Director and vice-Director of Biochemistry master’s degree, for all the accessibility and help and for all the knowledge they have given me over the years.
Special thanks to the two teachers who guided me throughout this project. To Professor Felisbina Queiroga as advisor of this dissertation and Professor Ana Cristina Ferreira, as co-advisor, for the availability provided whenever necessary, patience, understanding and advice that guaranteed the necessary conditions for the improvement and implementation of this work. I also appreciate the criticism, comments and suggestions. Additionally, thanks for all the knowledge transmitted and all the work and time dedicated over these months.
To Tânia Dinis, doctor from the HVUTAD Clinical Pathology Laboratory, for her help in the laboratory, for the excellent teaching and help in the techniques, all time disposal and also for the great support and friendship.
To the HVUTAD clinical pathology laboratory employee Susana Morais, for the friendship, understanding, support and teachings within the laboratory.
To all my friends who accompanied me at this stage, for all their help and support, and especially Marta Barbosa, who always accompanied me throughout this work in the laboratory, for their availability and above all for their good friendship.
To Bruno Mendes for being one of the pillars of my academic life, for the companionship, affection, love, understanding and encouragement that I never give up.
To all my family for the affection, support, all the help and encouragement given throughout my life that somehow helped me to achieve my goals.
To the best parents and sister, for love, patience, strength, optimism and all sacrifices, so this dream could be realized and above all for being the greatest example to my life.
IX
Abstract
There are recommendations specific for measuring blood glucose in serum or plasma and in both cases, it is very important that the samples be centrifuged for the separation of serum or plasma from blood cells, up to 1 hour postcollection. This is important because glycolysis continues in the in vitro blood cells.
In veterinary medicine, although delays between blood collection and analysis are common, in the bovine species, the effect of prolonged contact with the clot in the glucose concentration is not well established. The use of supplemented fluids with glucose is a common procedure and to date there is no published papers about the effect of spurious hyperglycemia in the leucocyte count in dogs and cats.
Thus this dissertation has two main objectives: to evaluate the glucose levels in paired samples of serum, plasma and fluoridated plasma belonging to bovine animals, in order to elucidate the effect of storage time and temperature in glucose concentration and, to formulate specific recommendations for sample storing and processing; to evaluate spurious hyperglycemia effect on the leucocyte cell count (total and differential count) in dog and cat blood with the ProCyte Dx hematological Analyzer (IDEXX).
For the first objective, the total blood samples were divided into tubes without additive, Fluoride/EDTA tubes and heparin lithium tubes. Samples were stored ate 25ºC and 4ºC and glucose concentration was determined 2h, 4h, and 8h after collection by on an automated biochemistry analyser (Randox RX Daytona™).
The results suggest that the mean concentration of glucose in the fluoridated plasma is not statistically different for both storage temperatures. In serum, the mean glucose concentration is statistically different when the samples are stored at 4ºC or at 25ºC. For plasma, the reduction in the mean concentration of glucose at 4 ºC or at 25ºC is not significant. The mean glucose concentration in the fluoridated plasma sample is not statistically different for the four post-harvest dosing times whereas for the serum and plasma samples, the average glucose concentration will decrease over time.
We conclude that the total blood storage at 4ºC limits the decline in glucose concentration by up to 8 hours of storage in fluoridated plasma samples. Storage exceeding 4 hours, even at 4ºC, should be avoided in serum and plasma samples to avoid significant changes in glucose concentration. At 25ºC, the contact time of the serum clot
X
should not exceed 1 hour in serum and plasma samples and 2 hours in fluoridated plasma samples.
For the second objective, dog and cat blood samples were collected for EDTA tubes. The samples were experimentally "contaminated" with glucose to achieve a final concentration of 5%, 10% and 20% and were analysed in the ProCyte Dx ™ (IDEXX).
Any spurious hyperglycemia group don’t show statistical significant difference from hemodilution group. These results are observed both in dogs and cats. We can conclude that apparently spurious hyperglycemia has no effects in the leucocytes parameters.
Key words: Glucose, hyperglycemia, blood, plasma, fluoridated plasma,
serum.
XI
Resumo
Existem recomendações específicas para medir a glicose no sangue no soro ou plasma e, em ambos os casos, é muito importante que as amostras sejam centrífugas para a separação do soro ou plasma das células sanguíneas, até 1 hora após a coleta. Isto é importante porque a glicólise continua nas células sanguíneas in vitro.
Na medicina veterinária, embora sejam comuns os atrasos entre a colheita e a análise de sangue, nas espécies bovinas, o efeito do contato prolongado com o coágulo na concentração de glicose não está bem estabelecido. O uso de suplementos líquidos com glicose é um procedimento comum e, até o momento, não há artigos publicados sobre o efeito da hiperglicemia espúria na contagem de leucócitos em cães e gatos.
Assim, esta dissertação tem dois objetivos principais: avaliar os níveis de glicose em amostras pareadas de soro, plasma e plasma fluoretado pertencentes a bovinos, a fim de elucidar o efeito do tempo e temperatura de armazenamento na concentração de glicose e, formular recomendações específicas para armazenamento e processamento de amostras; avaliar o efeito da hiperglicemia espúria na contagem de células leucocitárias (contagem total e diferencial) no sangue de cães e gatos com o Analisador Hematológico ProCyte Dx (IDEXX).
Para o primeiro objetivo, as amostras totais de sangue foram divididas em tubos sem aditivo, tubos de fluoreto/EDTA e tubos de heparina lítio. As amostras foram armazenadas a 25ºC e 4ºC e a concentração de glicose foi determinada 2h, 4h e 8h após a colheita num analisador bioquímico automatizado (Randox RX Daytona ™).
Os resultados sugerem que a concentração média de glicose no plasma fluoretado não é estatisticamente diferente para as duas temperaturas de armazenamento. No soro, a concentração média de glicose é estatisticamente diferente quando as amostras são armazenadas a 4ºC ou a 25ºC. Para o plasma, a redução na concentração média de glicose a 4ºC ou a 25ºC não é significativa. A concentração média de glicose na amostra de plasma fluoretado não é estatisticamente diferente nos quatro tempos de dosagem pós-colheita, enquanto nas amostras de soro e plasma, a concentração média de glicose diminui com o tempo.
Concluímos que o armazenamento total de sangue a 4ºC limita o declínio na concentração de glicose até 8 horas em amostras de plasma fluoretado. O armazenamento superior a 4 horas, mesmo a 4ºC, deve ser evitado em amostras de soro e plasma para evitar alterações significativas na concentração de glicose. A 25ºC, o tempo de contato
XII
do coágulo sérico não deve exceder 1 hora nas amostras de soro e plasma e 2 horas nas amostras de plasma fluoretado.
Para o segundo objetivo, amostras de sangue de cães e gatos foram colhidas para tubos de EDTA. As amostras foram "contaminadas" experimentalmente com glicose para atingir uma concentração final de 5%, 10% e 20% e foram analisadas no ProCyte Dx ™ (IDEXX).
Qualquer grupo de hiperglicemia espúria não mostra diferença estatística significante em relação ao grupo de hemodiluição. Estes resultados são observados em cães e gatos. Podemos concluir que a hiperglicemia aparentemente espúria não tem efeitos nos parâmetros dos leucócitos.
Palavras-chave: Glicose, hiperglicemia, sangue, plasma, plasma fluoretado,
soro.
XIII
General Index
Acknowledgment ... VII Abstract ... IX Resumo ... XI General Index ... XIII Figures index ... XV Table index ... XVII Abbreviations ... XIX
Chapter I – General introduction ... 3
1. Glucose concentration in serum, plasma or total blood ... 5
2. Importance of pre-analytical errors in blood tests ... 6
2.1. Pre-analytical errors in clinical analyses ... 6
2.2. Specific pre-analytical errors in sample manipulation for glucose measurement ... 7
Chapter II – Objectives ... 11
Chapter III - Storage time, temperature and use of additives effect on serum glucose concentration in cattle ... 15
Introduction ... 15
Material and methods ... 17
Results ... 19
Discussion ... 24
Conclusions ... 27
Chapter IV - Hyperglycemia effect on total leukocyte count determination and leukocyte formula in dog and cat blood ... 31
Introduction ... 31
Materials and methods ... 32
XIV
Discussion ... 41
Conclusions ... 43
Chapter V - General conclusions ... 47
Chapter VI - References ... 51
XV
Figures index
Figure 1 - Physiological factors influencing blood glucose concentration... 4
Figure 2- Analyser Randox RX Daytona ™. ... 17
Figure 3 - Mean glucose concentration (mg/dL) by medium and hours post-blood collection. ... 21
Figure 4 -Variation of glucose concentration (mg/dL) over time... 23
Figure 5 - ProCyte Dx™ Hematology Analyzer. ... 32
Figure 6 - Laser flow Citrometry ... 32
Figure 7 - Optical fluorescence... 33
Figure 8 - Laminar flow impedance. ... 33
Figure 9 - Percentage variation of white blood cell (WBC), neutrophil (NEU), lymphocyte (LYM), monocyte (MONO), eosinophil (EOS) and basophil (BASO) counts in samples of dogs contaminated by a glucose standard solution. ... 39
Figure 10 - Percentage variation of white blood cell (WBC), neutrophil (NEU), lymphocyte (LYM), monocyte (MONO), eosinophil (EOS) and basophil (BASO) counts in samples of cats contaminated by a glucose standard solution. ... 40
XVII
Table index
Table 1 – Mean concentration of glucose (mg/dL) ± standard deviation (SD) according to hours postcollection and storage temperature (T), by medium. ... 19 Table 2 - Mean concentration of glucose (mg/dL) ± SEM (standard error mean) and percentage variation for 3 medium: plasma (P), serum (P) and fluoridated plasma (F), according to temperature and hours postcollection. ... 20 Table 3 – Mean glucose concentration (mg/dL) for interactions medium*hour and medium*temperature. ... 22 Table 4 - Statistical analysis of the effect of spurious contamination of blood samples from dogs for the diagnosis of white blood cells in the total white blood cell (leukocytes), neutrophils (NEU), lymphocytes (LYM), monocytes (MONO), eosinophils (EOS), basophils. ... 36 Table 5 - Statistical analysis of the effect of spurious contamination of blood samples from cats for the diagnosis of white blood cells in the total white blood cell (leukocytes), neutrophils (NEU), lymphocytes (LYM), monocytes (MONO), eosinophils (EOS), basophils. ... 37 Table 6 - Effect of spurious contamination of diagnostic blood samples on total white blood cell (WBC), neutrophil (NEU), lymphocyte (LYM), monocyte (MONO), eosinophil (EOS), basophil (BASO) (mean ± standard error of the mean). ... 38 Table 7 - Effect of spurious contamination of diagnostic blood samples on total white blood cell (WBC), neutrophil (NEU), lymphocyte (LYM), monocyte (MONO), eosinophil (EOS), basophil (BASO) (mean ± standard error of the mean). ... 38
XIX
Abbreviations
EDTA - Ethylenediaminetetraacetic acid GH – Growth hormone
GOD - Glucose oxidase GLUT - Glucose Transporter POD - Peroxidase
Chapter I
3
Chapter I – General introduction
Glucose is the monosaccharide present in greater amount in the blood. The glucose consumed by the organism cells of any living being, is obtained mainly from the diet or liver glycogen. The function of glucose is to generate energy in the form of ATP (adenosine triphosphate) in cells, but for this, it is necessary to be converted into pyruvate, through the glycolytic pathway (Ferreira, 2010). A glucose molecule is converted into two pyruvate molecules. Once pyruvate is synthesized, it can be converted into carbon dioxide and water in aerobic reactions or follow another pathway, being converted into lactate, under anaerobic conditions (Campbell, 2001). In addition to the glycolytic pathway being used in all tissues for glucose oxidation in order to provide energy, it can also be considered intermediate of other metabolic pathways (Champe et al., 2006).
Blood glucose concentration is regulated and influenced by several hormones (Figure 1).
The activity of the hormone insulin, responsible for the reduction of blood glucose level, promotes the uptake, utilization or storage of glucose by hepatocytes, myocytes and adipocytes. However, insulin is not necessary for the transport of glucose in leukocytes, neurons, erythrocytes, platelets or hepatocytes, but influences the uptake of glucose from hepatocytes (Nirmalan and Nirmalan, 2017).
The glucose intake in most cells is mediated by a set of carrier proteins present in the plasmatic membrane, of which are examples of GLUT-1, GLUT-4 and GLUT-7. Through GLUT-4 insulin allows the entry of glucose into the myocytes and adipocytes (Stockham and Scott, 2008).
Glucagon activity, with antagonistic effects on insulin, increases blood glucose by stimulating glycogenolysis and gluconeogenesis (Girard, 2017).
General introduction
4
Figure 1 -Physiological factors influencing blood glucose concentration. (Adapted from Stockham and Scott, 2008).
The activity of catecholamines alter blood glucose by several mechanisms, among which (Adams, 1995; Rizza et al., 1980):
• An α2-adrenergic stimulus of the pancreatic β cells decreases the release of insulin and therefore reduces the use of glucose by hepatocytes, myocytes and adipocytes.
• A β-adrenergic stimulus of pancreatic β cells increases insulin release. However, α2-adrenergic receptors predominate in the pancreatic β cells, so that catecholamines inhibit mainly insulin secretion.
5 • An α2-adrenergic stimulus of the pituitary gland increases the release of GH
releasing hormone (somatotropin).
GH activity increases blood glucose level by reducing glucose uptake by myocytes and adipocytes and cortisol activity increases blood glucose concentration by stimulating gluconeogenesis, creating a state of insulin resistance (Adams, 1995; McMahon et al., 2001).
1.
Glucose concentration in serum, plasma or total blood
Measurement of glucose blood concentration – glycemia – is one of the most frequent laboratory tests (Martin et al., 1995). Accurate glycemia values are of great importance in the diagnosis and control of diabetes mellitus. The reliability of the glycemia results is directly correlated with the pre-analytical phase. From the moment of postcollection, blood cells such as erythrocytes, leukocytes and platelets continue to degrade glucose – glycolysis – to meet their energy needs. The glycolysis rate is dependent on the cell concentration, the possible presence of bacteria and the temperature of the sample (Broso and Buffetti, 1993). There are several methods to prevent glycolysis, such as rapid sample separation, addition of antiglycolytic agents, cooling or immediate determination of glucose (Martin et al., 1995; Taylor et al., 1993).
In the laboratory the usual method to evaluate the blood glucose concentration consists in the measurement of fasting glycemia, which requires a fasting of 12 hours and adequate conditions in the postcollection environment. The reference value used in the determination of glycemia is 99 mg/dL (American Diabetes Association, 2005).
Most clinical laboratories in human medicine are prepared to perform glucose determination in both serum and plasma.
The analytical instruments usually provide useful results if the unit is operating properly, the sample manipulation is correct and the manufacturer's instructions are rigorously followed (Stockham and Scott, 2008).
One of methods for measuring glucose concentration in serum or plasma is the enzymatic photometric test, in which is used glucose oxidase (GOD) (specific enzyme for glucose), which catalyses the glucose oxidation in glycolic acid and hydrogen peroxide. Colour changes can be detected by spectrophotometry or reflectance photometry. The colorimetric indicator used is quinoneimine, which is generated from
General introduction
6
aminoantipyine and phenol by hydrogen peroxide, under the catalytic action of peroxidase (POD) (BioSys, 2013).
Glucose is a water-soluble molecule uniformly distributed in whole blood (freely diffuses between plasma and erythrocytes). However, the whole blood glucose concentration measured by some methods are lower than those of serum or plasma. There are about 71 mL of H2O per 100 mL of erythrocytes and about 93 mL of H2O per 100 mL
of plasma. The H2O content of the whole blood varies with its hematocrit and as there is
less H2O in erythrocytes than in the plasma, the concentration of glucose in the
erythrocytes is about 76% of the plasma. So, the concentration of glucose in the whole blood can be converted to plasma glucose concentration through the following equation (Astles et al., 1996):
𝑃𝑙𝑎𝑠𝑚𝑎 [𝑔𝑙𝑢𝑐𝑜𝑠𝑒] = 𝑊ℎ𝑜𝑙𝑒 𝑏𝑙𝑜𝑜𝑑 [𝑔𝑙𝑢𝑐𝑜𝑠𝑒] (1.0 − (0,0024 × 𝐻𝑐𝑡 𝑖𝑛 %))
2.
Importance of pre-analytical errors in blood tests
2.1. Pre-analytical errors in clinical analysesThe hematological and biochemical analyses are the basis for diagnosis formulation and for the correct monitorization and institution of therapy, in almost all branches of medicine (Buonocore et al., 2015).
The pre-analytical conditions for glycemia determination commonly addressed in the clinical laboratory include, age, gender, physical activity practice, diet, fasting and drug use for therapeutics or other purposes. Proper specimen post collection also has an essential role for a reliable examination (Pegoraro et al., 2011).
Among the numerous possible errors occurring during blood postcollection with vascular devices, contamination of blood samples through exogenous glucose solutions
7 is a typical pre-analytical error that has been pointed out as a cause of false hyperglycemia (Lippi et al., 2015; O’Hare and Chilvers, 2001).
Contamination of blood samples can occur when taken blood from the infusion line or when is used saline solutions and glucose solutions to wash the arterial lines. This, is a clinically important problem, since the glucose readings falsely increased may trigger the inconvenient administration of insulin, while the erroneous variation of other parameters may induce inappropriate therapeutic actions (Lippi et al., 2013; Sinha et al., 2007; Ponto et al., 2002).
Studies show that a contamination of 5% to 20% of the total blood samples with a standard glucose solution is a source of bias in the leukocyte count affecting not only, the total leukocytes count, but also the differential leukocytes count and erythrocytes subpopulations. This information assumes great importance in patients with hyperglycaemic with concomitant bacterial infections, in which the total leukocyte count is possibly the most important parameter, so that a false decrease in blood glucose can interfere with the reasoning of the diagnosis (Buonocore et al., 2015).
2.2. Specific pre-analytical errors in sample manipulation for glucose measurement
With regard to the specific conditions for measuring blood glucose in serum or plasma, in both cases it is very important that the samples be centrifuged for the separation of serum or plasma from blood cells, up to 1 hour postcollection. This is especially important because glycolysis continues in the in vitro blood cells (Pegoraro et al., 2011). If the plasma or serum is kept in contact with the cells at room temperature before separation is performed, the glucose concentration will decrease by about 5%-10% per hour, in addition, the presence of leucocytosis and erythrocytosis may accelerate this process. To decrease the rate of glucose consumption the sample can be placed in a cold environment, yet the clot formation will also decrease which may impair the subsequent separation of serum or plasma during centrifugation (Stockham and Scott, 2008).
To achieve a good separation of the serum is recommended the use of tubes containing an activator, silica, which improves the formation of the blood clot because it has the function to accelerate the coagulation process, or a gel that facilitates the separation of the clot and the serum, simplifying the laboratory routine and decreasing the risk of pre-analytical error (Garrett and Grisham, 2013)(Latimer, 2011). After
General introduction
8
centrifugation, the serum glucose level will remain stable up to 48h in the refrigerator if the gel barrier remains intact (Laessig et al., 1976; Bush et al., 2001). Rapid serum separation avoids glucose consumption by blood cells (Latimer, 2011).
When centrifugation of the blood sample is not possible in good time and to avoid the glucose consumption by blood cells, tubes containing the presence of an anticoagulant, sodium fluoride (NaF) may be used. The fluoride/EDTA consists of a solution of EDTA (ethylenediaminetetraacetic acid) and fluoride and has as its main characteristic to be an inhibitor of the glycolytic pathway, preventing the use of glucose by erythrocytes and leukocytes, (Bowen and Remaley, 2014). EDTA acts as a chelating agent of ionized calcium, originating an insoluble complex of EDTA-calcium and the fluoride inhibits the enzyme enolase, being responsible for the conversion of 2-phosphoglycerate into phosphoenolpyruvate. Because, this inhibitor does not act at the beginning of the glycolysis pathway, the levels of glycose stabilizes after 3 hours post collection and remain stable up to 24 hours (Ferreira, 2010; Narayanan, 2000).
Therefore, as previously mentioned, both the determination in serum and plasma are feasible to evaluate glucose, when separation occurs up to 1 hours after postcollection. However, it is important to compare glucose values in whole blood, plasma and serum in the different species in order to standardize results and to confirm whether the determinations in different matrices are overlapping for the species in question (Pegoraro
Chapter II
11
Chapter II – Objectives
Glucose determination is one of the most frequent analytic determinations in Human and Animal Medicine. In Veterinary Medicine, its analytical determination is of particular importance since the probability of pre-analytical errors is relatively high due to the very heterogeneous conditions in which the harvest can occur, mostly in clinics of large animals. On the other hand, in a small animal clinic, the route where fluids are being administered is often used to collect the blood sample for analytic determinations, thus avoiding the need to open a new route causing more stress and pain to the animal.
Thus, the general objectives of the present study were:
• Given the great variability on the time between blood collection and analysis in bovine medicine, we aimed to evaluate the effect of storage time, temperature and additives on blood glucose concentration in cattle.
• Given the absence of data regarding the effect of spurious hyperglycemia in the determination of leucocyte parameters determination in dogs and cats, we aimed to evaluate the effect of spurious hyperglycemia on the leucocytes count (total and differential count) in dog and cat blood when using the ProCyte Dx haematological Analyzer (IDEXX).
Chapter III
Storage time, temperature and use of additives effect on serum glucose
concentration in cattle
15
Chapter III - Storage time, temperature and use of additives effect
on serum glucose concentration in cattle
Introduction
Late separation of serum or plasma from erythrocytes causes artificial hypoglycemia, caused predominantly by continuous absorption and glucose metabolism by erythrocytes (Young et al., 2008; Kaneko, 2008; Christopher and Sharron O’Neil, 2000; Rehak and Chiang, 1988; Joshi, 2006). In most species, erythrocytes meet their energetic needs, through the consumption of glucose via anaerobic glycolysis, which is known as via “Embden – Meyerhof”. However, the rate of utilization of glucose via Embden – Meyerhof in erythrocytes varies among species (Garrett and Grisham, 2013).
Concerning erythrocytes glycolytic activity, it is uncertain how the differences between species affect the blood concentrations of glucose in stored samples. It is known that glucose concentration decreases in total blood samples when they are stored mainly at room temperature. However, specific storage recommendations for different species are limited. (Young et al., 2008; Kaneko, 2008; Kaneko, 1999; Stockham and Scott, 2008; Weiser, 2006; Thomas, 2004; Rendle et al., 2009; Ehsani et al., 2008).
Although delays between sampling and analysis of samples are common in veterinary medicine, either by inadequate handling procedures or by human errors, the effect of prolonged serum clot contact time on serum glucose concentration is not yet well defined (Collicutt et al., 2015). Extreme cases, in which serum contact with the clot exceeds 24h, may result in clinically significant alterations of the serum analyses (Rehak and Chiang, 1988; Sinha et al., 2007). Prolonged contact time with the clot at room temperature is largely associated with continuous glycolysis by blood cells (predominantly erythrocytes), leading to a decrease in glucose concentration (Collicutt et al., 2015).
In addition, serum or plasma samples not readily separated from erythrocytes may contain high lactate concentration due to the continuous uptake and metabolism of glucose by in vitro erythrocytes (Young and Bermes, 1999; Kaneko, 1997).
The separation of serum or plasma from erythrocytes should be performed up to 1 hour postcollection to avoid significant changes in blood glucose concentration. Several procedures can be used to preserve blood glucose, yet each has its own weaknesses (Chan et al., 1989).
Storage time, temperature and use of additives effect on serum glucose concentration in cattle
16
One of the most used methods is the use of Fluoride/EDTA tubes that have sodium fluoride as a glycolytic inhibitor and EDTA anticoagulant. Fluoride/EDTA, preserves cell morphology while maintaining the quality of the sample, inhibiting several glycolytic enzymes by complexation with its cofactor, the magnesium ion. These tubes are recommended for the collection of human and animal blood samples, clinically validated for glucose and lactate dosage, to avoid artificial alterations resulting from glycolysis(Young and Bermes, 1999; Kaneko, 1997).
There is little information available about optimal glucose measurement conditions, regarding sample collection and storage conditions until analytical determination in cattle. In this species, the fact that cattle farms are often far from the analysis laboratories increases the relevance of the study of this subject. In cattle, milk production and health status maintenance require a good balanced blood glucose level (González-grajales et al., 2018). Nowadays glucose metabolism evaluation is gaining relevance and laboratory methods for glucose measurement need standardization.
The main goal of this study was to evaluate the effect of storage time, temperature and additives on blood glucose concentration in cattle. According to blood glucose determination, it was also pretended to formulate specific recommendations for blood sampling, storing and processing in bovine medicine.
17 Material and methods
To achieve our goals, blood glucose concentration was determined, in paired samples, in three different mediums: serum (S), plasma (P) and fluoridated plasma (F) in bovine blood samples.
A blood sample of 15 mL was collected from twenty-four animals from the jugular vein. Blood samples were not taken on purpose for this study. Samples were reused from the clinical pathology laboratory. Samples were collected randomly, without distinction of age or pathology: The blood was distributed for Eppendorf’s without additive (dry tube) in order to obtain serum samples (n=7); 1mL heparin lithium tubes for plasma samples (n=5); and 6mL fluoride/EDTA tubes for fluoridated plasma samples (n=1).
For each animal, as a reference sample, a dry tube was centrifuged at 2164g for 10 minutes, 1h postcollection at room temperature (25ºC).
Three of the remaining dry tubes were stored at room temperature (25°C), and the other 3 were stored in the refrigerator (4°C). One sample of each storage temperature was then centrifuged as previously described at 2h, 4h and 8h post collection. Fluoride/EDTA and heparin lithium plasma samples obtaining process were similar. Serum, plasma and fluoridated plasma were separated from the clot and immediately frozen as previously described.
After separation all samples were immediately frozen and maintained at -20 °C for less than 30 days before glucose measurement, a time interval for which serum glucose concentration is was described as “stable”.
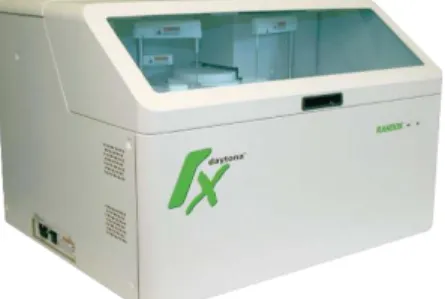
Samples were thawed and the glucose measured by the glucose oxidase method on an automated biochemistry analyser (Randox RX Daytona™)
(figure 2) using reagents, calibrators and controls supplied by the manufacturer.
The RX Daytona ™ is an automated clinical chemistry analyser proposed for in vitro quantitative determination of glucose concentration and other analytics in serum, plasma or other matrices.
As described in the procedure (Manual of RANDOX
Laboratories, 2010), the glucose level is analysed by the colorimetric enzymatic method without deproteinization. Glucose is determined after enzymatic oxidation in the presence of glucose oxidase. The hydrogen peroxide produced, reacts with phenol and 4-aminoantipyine
Figure 2- Analyser Randox RX
Storage time, temperature and use of additives effect on serum glucose concentration in cattle
18
forming the colorimetric indicator, the quinoneimine of red-violet colour. The intensity of the final colour is directly proportional to the glucose concentration and it is measured photometrically at 505 nm.
After validation, results they were integrated into a spreadsheet for statistical analysis.
Statistical analyses
Statistical analysis was performed using JMP® 7.0 statistical analysis software (2007 SAS Institute, INC.).
The “percentage of variation”, corresponds to the variation in glucose concentration, in relation to the control concentration sample (1h, 25ºC), for each medium tested.
Continuous data with repeated measures for the random animal effects were analysed using linear mixed models. When differences were statistically significant, were made multiple comparisons by full factorial ANOVA. When ANOVA analysis revealed significant differences were carried out multiple comparison analyses by the Tukey-Kramer test.
Correlations between medium and hour were estimated by bivariate analysis. The model was analysed by analysis of variance.
19 Results
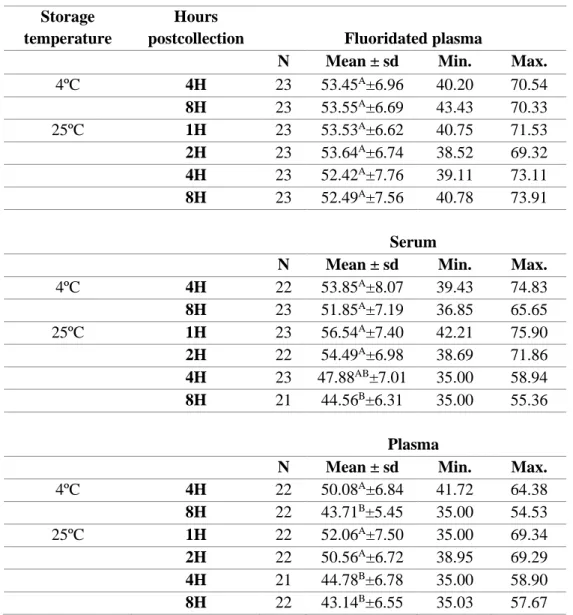
The mean, minimum, maximum and dispersion of the glucose concentration were determined for the medium fluoridated plasma (F), serum (S) and plasma (P) as a function of the postcollection dosing time, and the storage temperature (table 1).
Table 1 – Mean concentration of glucose (mg/dL) ± standard deviation (SD) according to hours postcollection and storage temperature (T), by medium.
Values with different superscripts within the same column and for each medium, are significantly different.
At 4 hours at 4ºC the mean glucose concentration is not different between mediums, while at 8 hours this parameter has a significant lower concentration in heparinized plasma.
Storage temperature
Hours
postcollection Fluoridated plasma
N Mean ± sd Min. Max.
4ºC 4H 23 53.45A±6.96 40.20 70.54 8H 23 53.55A±6.69 43.43 70.33 25ºC 1H 23 53.53A±6.62 40.75 71.53 2H 23 53.64A±6.74 38.52 69.32 4H 23 52.42A±7.76 39.11 73.11 8H 23 52.49A±7.56 40.78 73.91 Serum
N Mean ± sd Min. Max.
4ºC 4H 22 53.85A±8.07 39.43 74.83 8H 23 51.85A±7.19 36.85 65.65 25ºC 1H 23 56.54A±7.40 42.21 75.90 2H 22 54.49A±6.98 38.69 71.86 4H 23 47.88AB±7.01 35.00 58.94 8H 21 44.56B±6.31 35.00 55.36 Plasma
N Mean ± sd Min. Max.
4ºC 4H 22 50.08A±6.84 41.72 64.38 8H 22 43.71B±5.45 35.00 54.53 25ºC 1H 22 52.06A±7.50 35.00 69.34 2H 22 50.56A±6.72 38.95 69.29 4H 21 44.78B±6.78 35.00 58.90 8H 22 43.14B±6.55 35.03 57.67
Storage time, temperature and use of additives effect on serum glucose concentration in cattle
20
At 25ºC, at hours 1 and 2, the mean concentration of glucose is not different in the three mediums; From 4 hours, at 25ºC, the F presents the highest average glucose concentration in relation to the other two mediums under study.
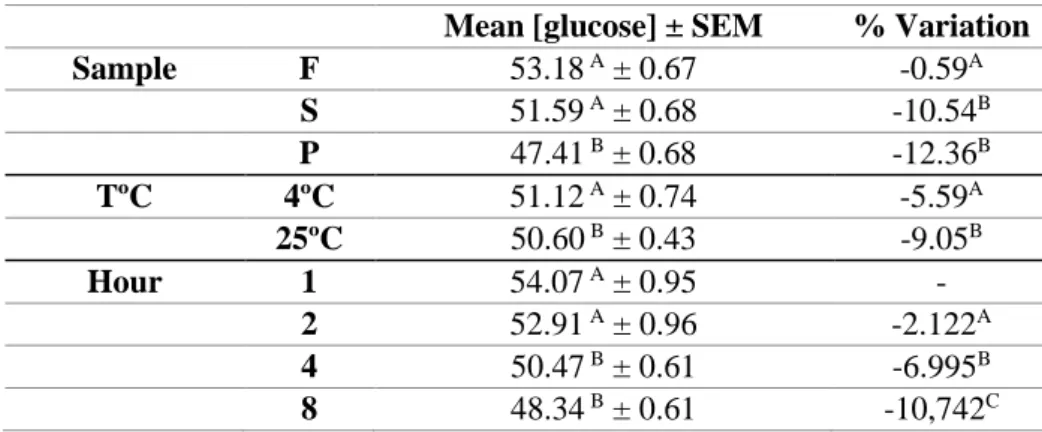
The average glucose concentration by medium, temperature and time postcollection and “percentage variation” is presented in table 2.
Table 2 - Mean concentration of glucose (mg/dL) ± SEM (standard error mean) and percentage variation for 3 medium: plasma (P), serum (P) and fluoridated plasma (F), according to temperature and hours postcollection.
Different superscripts, for the same parameter, by column specify statistically different values.
The effects medium, temperature and time postcollection have a highly significant influence in blood glucose concentration (P<0.0001). The blood glucose concentration varied significantly by medium (P<0.0001), temperature (P<0.0001), time postcollection (p<0.0001) (table 2) and a significant interaction medium*time (P<0.0146) on this parameter level (figure 3 e table 3). Also, the percentage variation of the glucose concentration for the tested time postcollection is significantly different between mediums, temperatures and time (P<0.0001). That effects (medium, temperature and time) significantly the glucose concentration and its variation over time (table 2).
The mean concentration of blood glucose in the fluoridated plasma medium is not significantly different from the concentration obtained in the serum, but it is higher than the average concentration achieved in plasma. The storage temperature significantly influences the mean glucose concentration, as well the time postcollection: the mean glucose concentration is higher in the first two hours postcollection in relation to the subsequent times.
The parameter “% of variation” presents significant differences depending on the tested medium, temperature and hours postcollection. The fluoridated plasma showed the lowest
Mean [glucose] ± SEM % Variation
Sample F 53.18 A ± 0.67 -0.59A S 51.59 A ± 0.68 -10.54B P 47.41 B ± 0.68 -12.36B TºC 4ºC 51.12 A ± 0.74 -5.59A 25ºC 50.60 B ± 0.43 -9.05B Hour 1 54.07 A ± 0.95 - 2 52.91 A ± 0.96 -2.122A 4 50.47 B ± 0.61 -6.995B 8 48.34 B ± 0.61 -10,742C
21 percentage of variation in blood glucose concentration in relation to serum and plasma media, for which the glucose concentration did not varied significantly between them.
As verified for the mean glucose concentration, also the % of variation is significantly affected by the factor “temperature” (table 2). For the time effect, the percentage of variation in glucose concentration is significantly different between time postcollection, with an increase in % of variation that raises as the interval between time postcollection and sample processing time increases.
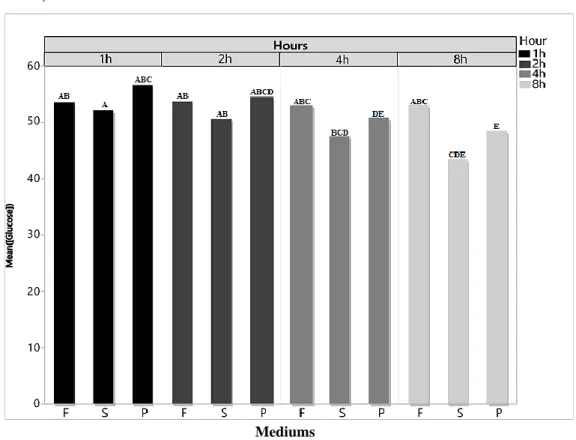
The mean concentration of glucose, by medium, determined for the different times postcollection, revealed that for the fluoridated plasma statistically identical mean values (Figure 3).
For the serum, the mean concentration of glucose decreases for the different measuring times. The reduction in the mean concentration at 1 and 2 hours is not significant, however there is a very significant reduction at 4 and 8 hours compared with the first two hours, presenting at 8 hours the lowest mean value. The same trend was verified for the plasma (figure 3 and table 3).
Mediums
Figure 3 - Mean glucose concentration (mg/dL) by medium and hours post-blood collection.
Storage time, temperature and use of additives effect on serum glucose concentration in cattle
22
The interaction between the studied factors in the mean blood glucose concentration were tested (table 3). The interaction medium*temperature was not statistically significant for the global model (p =0.3465), but when the peer interaction was evaluated, it showed significant effects. Whereas for fluoridated plasma and plasma this interaction had no effect on the mean glucose concentration, in the serum this interaction significantly affected the mean concentration of glucose.
The mean concentration of glucose in media fluoridated plasma and plasma is not statistically different for the two sample storage temperatures. There are no significant differences in the mean glucose concentration at 4ºC or at 25ºC. For serum, the mean glucose concentration is statistically different when the samples are stored at 4ºC or 25ºC.
For the interaction medium*hour (p<0.0008), the hour 1 and the hour 2 do not significantly affect the mean concentration of glucose by mediums. From the hour 4 on, there were significant differences in the mean concentrations between mediums, with reduction of this concentration for serum and plasma (Figure 3 and table 3).
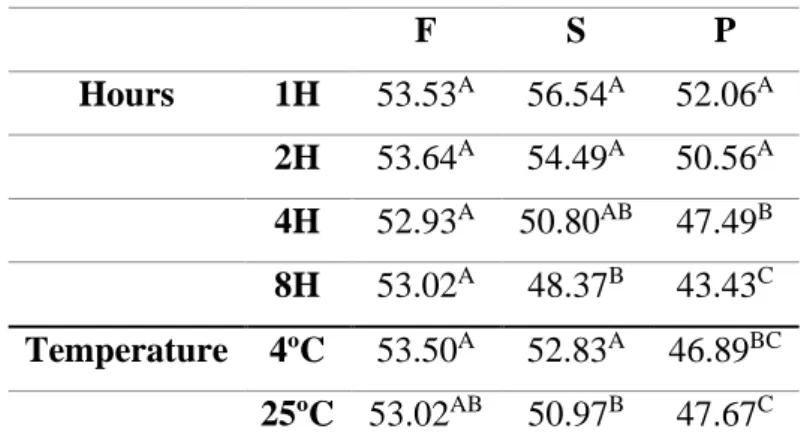
Table 3 – Mean glucose concentration (mg/dL) for interactions medium*hour and medium*temperature.
Different superscripts specify statistically different values
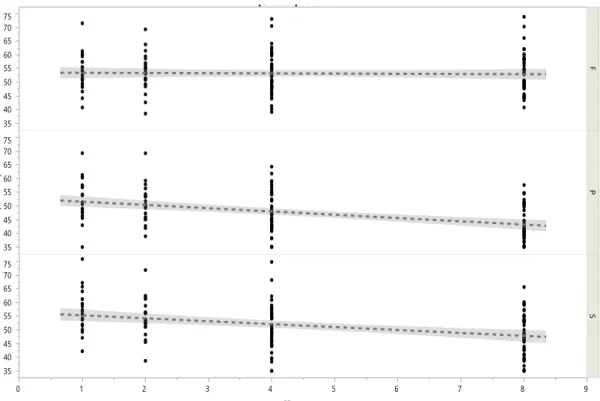
The analysis of the variation of the mean glucose concentration, by medium, over the postcollection times (Figure 4), showed a significant correlation for plasma and serum. In other words, the variation of the glucose concentration for these two mediums over time is significant (p<0.0001), while for the fluoridated plasma the glucose concentration remains stable over time (p=0.9091). F S P Hours 1H 53.53A 56.54A 52.06A 2H 53.64A 54.49A 50.56A 4H 52.93A 50.80AB 47.49B 8H 53.02A 48.37B 43.43C Temperature 4ºC 53.50A 52.83A 46.89BC 25ºC 53.02AB 50.97B 47.67C
23
Hours
Storage time, temperature and use of additives effect on serum glucose concentration in cattle
24
Discussion
For the measurement of glucose in the blood, it is especially important that the samples be centrifugated up to 1 hour postcollection, for the separation of serum or plasma from blood cells, since glycolysis continues in the in vitro blood cells, and consequently decreases glucose concentration (Pegoraro et al., 2011). The samples can be placed in a cold environment to decrease the rate of glucose consumption (Stockham and Scott, 2008).
Our results reveal that glucose concentration decreased over storage time, with the greatest decrease occurring during the first hour for fluoridated plasma. Subsequently, the decrease rate was slower until hour 8 postcollection. This may be due to the process of inhibition of the glycolytic enzyme by fluoride that prevents glucose consumption by red blood cells and leukocytes, which is not immediately perceptive and as a consequence there is a greater decrease in glucose concentration in the first hour than in the subsequents. In contrast, the concentration of glucose in the plasma, and in the serum decreased continuously over time (Gupta and Kaur, 2014).
Therefore, the action of sodium fluoride as an inhibitor is slow, as it inhibits only enzymes at the end of the glycolysis pathway, and thus glucose concentration decreases during the first hour of storage (Fobker, 2014). However, it is effective in preserving glucose in the blood after the first hour, inhibiting the glycolysis process gradually, from the second hour, and inhibiting it completely from the fourth hour of storage. The same is found out in work of Chan and collaborators (1989), where they found that decrease in glucose in fluoride/EDTA tubes in relation to heparin lithium tubes after 1 h was lower than the decrease in glucose concentration in samples treated with heparin. Although they try to tested variations over 3 days and not just in the first 8 hours after collection.
The use of fluoride/EDTA tubes is effective in preserving blood glucose at least up to 8h postcollection. However, for samples analysed within 1 hour after postcollection, these tubes are apparently not needed since from the laboratory point of view they are more expensive and in addition there is a marked decrease in glucose concentration in the first hour.
Therefore, using heparinized plasma and serum in the first hour postcollection are considered effective for blood glucose concentration determinations. For later dosing times, tubes containing fluoride/EDTA are more effective in preventing glycolysis contrary to other tested mediums.
25 Shi and collaborators (2009) and Chan and collaborators (2014), also verified that the rapid separation of blood (until the first hour postcollection) in heparin tubes effectively prevents the in vitro decrease in blood glucose concentration.
According to this study and others such as Pegoraro and collaborators (2011), dry or heparin tubes may be used to analyse fasting blood glucose. This was possible due to laboratory routine of this test does not require an anticoagulant, since the test is done in less than an hour. On the other hand, the Fluoride/EDTA tube is used in tests are performed several hours postcollection, and the antiglycolytic is necessary for the result to be reliable(Junior et al., 2007).
When it is not possible an immediate sample centrifugation, refrigeration (2-8ºC) is used to keep the sample stable for at least 48 hours. When it is not possible it should be used collection tubes with an inhibitor that prevents glycolysis (Wild et al., 2004). However, some studies show that even in the presence of fluoride and with plasma separation in the first hour, a 5-7% drop in the total value of glucose concentration is observed (Dimas and Sohler, 2008).
Our study shows similar results in bovines in comparison with literature.
The stability of the samples has recently emerged as one of the main issues in clinical chemistry tests, where laboratory diagnoses often mean that large volumes of non-centrifugated samples are transported to centralized laboratories, usually over long distances and occasionally under challenging environmental conditions such as high temperatures (Roccaforte et al., 2016).
Therefore, the blood collection tubes are used in the laboratory routine according to the different field conditions. That is, the tubes containing sodium fluoride has a slow but most effective effect on preserving blood glucose for at least 8 hours for determination of its concentration. Its use, however, is unnecessary if glucose concentration is measured within the first hour after sampling and could be used tubes containing heparin, which acts as anticoagulant blocking the coagulation cascade efficiently in the first hour (Sidebottom et al., 1982). As well as the use of tubes without anticoagulant to obtain serum, they should only be used to determine glucose concentration when the centrifugation of the sample is carried out immediately, since these tubes do not contain any type of anticoagulant and there is a contact with the coagulum, causing a large decrease in glucose concentration due to the use of glucose by erythrocytes and leukocytes present in the sample (Stockham and Scott, 2011).
This reveals and reinforces that the concentration of glucose in fluoridated plasma is relatively stable over time as opposed to what happens on plasma and serum. From our study
Storage time, temperature and use of additives effect on serum glucose concentration in cattle
26
we can concluded that fluoridated plasma is the one that showed higher stability in the mean glucose concentration over time. It was also demonstrated that pre-analytical evaluation is fundamental for accurate and reliability of the results, because the way the material is manipulated has a direct relationship with the final result. The protocol used in this work proved to be effective and reliable.
27 Conclusions
Based on the results of this study, specific recommendations can be made for blood samples of cattle for the analytic determination of glucose concentration according to handling and storage procedures in order to avoid degradation/use of glucose and to preserve the endogenous concentration of glucose.
The results of the present study suggest that total blood storage at 4ºC limits the decline in glucose concentration by up to 8 hours of storage in fluoridated plasma. Storage exceeding 4 hours, even at 4ºC, should be avoided in serum and plasma to avoid significant changes in glucose concentration. At 25ºC, the contact time of the serum clot should not exceed 1 hour in serum and plasma and 2 hours in fluoridated plasma. The decrease in the degree of glucose concentration after 8 hours of storage at room temperature was faster in serum, followed by plasma and fluoridated plasma mediums. The results of this study provide veterinarians with clinically useful information on the handling, storage temperature and postcollection laboratory determination time to avoid a false diagnosis and/or a non-correct clinical condition.
It is suggested that similar studies be conducted in other species of veterinary interest in order to test these effects and to establish recommendations that allow a reliable determination of the glucose concentration in blood samples.
Chapter IV
Hyperglycemia effect on total leukocyte count determination and leukocyte
formula in dog and cat blood
31
Chapter IV - Hyperglycemia effect on total leukocyte count
determination and leukocyte formula in dog and cat blood
Introduction
The pre-analytical phase of a laboratory test corresponds to all activities preceding the analysis. Pre-analytical errors along with analytical errors are frequent problems that can compromise the test processing quality and consequently the results consistency (Lippi et al., 2015). Most pre-analytical errors result from procedures at sample collection time that are carried out improperly or in a unstandardized manner. Additionally, errors can also occur during biological samples handling and preparation (Simundic and Lippi, 2012).
Among the sources of pre-analytical errors, contamination of samples by exogenous fluids such as saline solutions for fluid therapy, therapies with antibiotics, potassium-rich fluids and glycosides are relatively common (Anand et al., 2011). Therefore, contamination of the blood sample can lead to diagnostic errors and adverse consequences for the health of patients. Unfortunately this is a relatively common occurrence, having as consequence the inadequate therapeutic correction of false abnormalities such as hyperglycemia or hyperkalemia, for instance (Gupta and Cook, 2013; Thirugnanam and French, 2014).
In human medicine, it has been previously demonstrated that the contamination of the blood sample by glucose solutions can generate a significant bias namely in leucocyte parameters (total and differential count) (Lippi et al., 2013). The underlying causes are probably a combination of glucose-induced effects on leucocyte biology and the different analytical techniques used for leucocyte enumeration and differentiation (Buonocore et al., 2015).
In veterinary medicine the use of fluids supplemented with glucose is a common procedure. To the authors’ knowledge, there is no published papers about the effect of spurious hyperglycemia in the leucocyte parameters determination in dogs and cats. Therefore, the objective of this work was to evaluate if spurious hyperglycemia can affect the leucocytes count (total and differential count) in dog and cat blood when using the ProCyte Dx hematological Analyzer (IDEXX).
Hyperglycemia effect on total leukocyte count determination and leukocyte formula in dog and cat blood
32
Materials and methods
In order to reach the proposed objectives, 30 leftover samples from 20 dogs and 10 cats that were submitted to routine diagnostic work to the Laboratory the Clinical Pathology of the veterinary teaching Hospital of University of Trás-os-Montes and Alto Douro and the blood samples were not collection on purpose for this study. Samples were previously collected for 1.5mL EDTA tubes, by venopunction, and were selected by chance.
For all samples, the state of the animal and the time from collection to delivery in the laboratory were recorded.
The samples were divided into 5 Eppendorf’s of 1.5 mL. One of the samples was left in the original status that served as control, 3 of the samples were "contaminated" experimentally adding a 40% glucose solution (20 g of D - (+) - glucose was weighed and filled up with saline solution until 50mL; Sigma®) to achieve a final concentration of
5%, 10% and 20%. The last Eppendorf was left to hemodilution (annexe A and annexe B).
The samples were left in mechanical agitation approximately 20 minutes at room temperature and were then analysed in the ProCyte Dx ™ (IDEXX) (Figure 5). The equipment was used appropriately, according to the manufacturer's instructions.
The ProCyte Dx ™ (IDEXX) is a bench top automated hematological analyser developed to carry out blood count in animals, which evaluates and provides the results of a total of 24 parameters in approximately two minutes. It combines three major technologies, laser flow cytometry, optical fluorescence and laminar flow impedance. The variables evaluated are red blood cell count, hemoglobin, mean corpuscular volume, mean corpuscular hemoglobin, mean corpuscular hemoglobin concentration and platelet count, as well as total and differential leukocyte count (neutrophils, eosinophils, basophils, lymphocytes and monocytes).
• Through the laser flow cytometry method (figure 6), the system performs two separate analyses, the analysis of mature red blood cells, reticulocytes and platelets, and the analysis and differential classification of the five types of leukocytes. The cellular suspensions are hydrodynamically focused through a
Figure 5 - ProCyte Dx™
Hematology Analyzer.
Figure 6 - Laser flow
Citrometry (Adapted from (IDEXX Laboratories, 2016).
33 narrow orifice that is exposed to the focused red laser light. A laser radiates each cell and the lateral fluorescent light and frontal dispersion are captured to differentiate the mature erythrocytes, reticulocytes and platelets based on the degree of size and cellular fluorescence. These optical signatures provide information about the size, complexity, contents, and structure within each cell (IDEXX Laboratories, 2016).
• Optical fluorescence (figure 7) provides a highly sensitive and accurate reticulocyte count with the use of specific fluorescent patches. Canine and feline platelets are analysed with this method to ensure a superior separation by differentiating platelets and red blood cells of similar size. The process involves the staining of cells, directing the laser light of 633 nm in each cell and gathering several angles of light dispersion.
Wavelengths of 660 nm and larger, are captured for very accurate measurements of the cell's nucleic content (IDEXX Laboratories, 2016; Goldmann et al., 2014; Sireci et al., 2010).
• The laminar flow impedance (figure 8) is the quickest and most accurate method for analysing the size and number of red blood cells and platelets. With this method, a dilute sample is focused through the center of a detection aperture and an electrical signal is interrupted by the presence of each cell. The resistance measured can determine the size and type of each cell. The ProCyte Dx analyser sends the sample
through the aperture in one coaxial core stream of sample and reagent. Simultaneously, the core flow is involved by a faster moving reagent, ensuring that each cell is characterized individually, avoiding any coincidence of counting or recirculating (IDEXX Laboratories, 2016; Bacall, 2009).
Statistical analyses
Statistical software SPSS 24.0 was used for statistical analysis. ANOVA and Student t tests were used for continuous variables to evaluate the difference between the uncontaminated samples and the contaminated aliquots. Linearity was assessed using linear regression analysis.
Figure 7 - Optical fluorescence
(Adapted from (IDEXX Laboratories, 2016).
Figure 8 - Laminar flow
impedance (Adapted from (IDEXX Laboratories, 2016).
Hyperglycemia effect on total leukocyte count determination and leukocyte formula in dog and cat blood
34
The normal distribution of the samples was evaluated by the Shapiro-Wilk test and all values were expressed as mean ± standard error of the mean. In all statistical comparisons, P <0.05 was accepted as denoting significant differences.
35 Results
Descriptive results of leucocyte parameters in control group and groups with spurious glucose contamination for dogs and cats are shown in tables 4 and 5 respectively.
Figure 9 (A to F) describes the correlation values for leucocyte parameters depending on glucoses concentration and hemodilution. In dogs, the percentage of WBC (r=0.255 and p=<0.001), neutrophil (r=0.185 and p=<0.001), lymphocyte (r=0.225 and p=<0.001) and monocyte (r=0.127 and p=<0.001), eosinophil (r=0.120 and p=<0.001), basophil (r=0.002 and p=0.649) decreases significantly comparatively to control group. In cats, WBC (r=0.100 and p=0.025), neutrophil (r=0.053 and p=0.107), lymphocyte (r=0.134 and p=0.009), monocyte (r=0.017 and p=0.368), eosinophil (r=0.128 and p=0.011) and basophil (r=0.0016 and p=0.376) (Figure 10A to 10F) the same tendency was observed.
The results of statistical comparisons among groups are represented in tables 6 and 7. From present results it is possible to observe a statistical significant difference among all the groups (p<0.01) except for basophils in dogs (table 6) and monocytes and basophils in cats (table 7). Groups with any spurious hyperglycemia and hemodilution group were significantly different from control group. However, any spurious hyperglycemia group don’t show statistically significant difference from hemodilution group. These results are observed both in dogs (table 6) and cats (table 7).
Hyperglycemia effect on total leukocyte count determination and leukocyte formula in dog and cat blood
36
Table 4 - Statistical analysis of the effect of spurious contamination of blood samples from dogs for the diagnosis of white blood cells in the total white blood cell (leukocytes), neutrophils (NEU), lymphocytes (LYM), monocytes (MONO), eosinophils (EOS), basophils.
*In basophils the median was used because the distribution does not follow normality. DOGS Control
Glucose solution contamination
5% 10% 20% Hemodilution WBC Mean 10.32 4.99 4.88 4.81 5.05 Median 10.61 508 5.02 4.81 5.20 Standard deviation 2.51 1.53 1.42 1.54 1.49 Min 4.80 1.85 2.46 2.41 2.46 Max 14.88 7.91 7.57 7.74 8.54 NEU Mean 6.77 3.30 3.22 3.18 3.33 Median 6.59 3.27 3.25 3.02 3.28 Standard deviation 2.23 1.31 1.17 1.27 1.24 Min. 2.02 1.07 1.21 1.09 1.05 Max 11.33 6.26 5.49 5.71 6.17 LYM Mean 2.18 0.99 0.98 0.94 1.01 Median 2.08 0.92 0.98 0.87 0.96 standard deviation 0.62 0.36 0.35 0.36 0.32 Min 1.14 0.44 0.37 0.34 0.56 Max 3.46 1.67 1.65 1.72 1.65 MONO Mean 0.75 0.39 0.40 0.40 0.42 Median 0.68 0.36 0.39 0.39 0.35 standard deviation 0.28 0.13 0.14 0.14 0.16 Min 0.43 0.14 0.18 0.17 0.19 Max 1.55 0.63 0.68 0.64 0.83 EOS Mean 0.60 0.29 0.27 0.28 0.28 Median 0.59 0.29 0.24 0.26 0.27 standard deviation 0.31 0.17 0.16 0.16 0.15 Min 0.01 0.00 0.00 0.01 0.00 Max 1.36 0.78 0.68 0.69 0.69 BASO *Median 0.01 0.00 0.01 0.01 0.01 standard deviation 0.02 0.01 0.02 0.01 0.03 Min 0.00 0.00 0.00 0.00 0.00 Max 0.09 0.07 0.07 0.02 0.10
37
Table 5 - Statistical analysis of the effect of spurious contamination of blood samples from cats for the diagnosis of white blood cells in the total white blood cell (leukocytes), neutrophils (NEU), lymphocytes (LYM), monocytes (MONO), eosinophils (EOS), basophils.
.
*In basophils the median was used because the distribution does not follow normality. CATS Control
Glucose solution contamination
5% 10% 20% Hemodilution WBC Mean 13.08 6.45 7.04 6.78 7.06 Median 12.01 5.50 6.74 6.88 6.85 standard deviation 5.89 3.21 3.76 3.05 3.43 Min 5.80 2.94 2.80 2.94 2.85 Max 27.94 14.42 16.76 14.32 14.25 NEU Mean 8.04 3.97 4.36 4.16 4.43 Median 7.73 3.05 4.02 3.97 3.83 standard deviation 5.36 2.89 3.26 2.72 3.25 Min 3.13 1.25 1.30 1.39 0.96 Max 20.85 10.60 12.39 10.44 10.50 LYM Mean 3.56 1.70 1.87 1.80 1.84 Median 3.91 1.84 2.19 1.93 2.08 standard deviation 1.47 0.70 0.79 0.74 0.70 Min 1.61 0.79 0.69 0.76 0.83 Max 5.58 2.81 2.83 2.89 2.73 MONO Mean 0.50 0.27 0.28 0.28 0.28 Median 0.31 0.17 0.17 0.19 0.19 standard deviation 0.61 0.35 0.35 0.31 0.33 Min 0.17 0.09 0.10 0.12 0.07 Max 2.20 1.24 1.26 1.16 1.20 EOS Mean 0.91 0.46 0.49 0.50 0.47 Median 0.86 0.45 0.50 0.47 0.45 standard deviation 0.38 0.22 0.02 0.20 0.19 Min 0.38 0.19 0.02 0.22 0.21 Max 1.55 0.87 0.87 0.90 0.89 BASO *Median 5.50 0.03 0.04 0.02 0.04 standard deviation 3.21 0.03 0.02 0.06 0.05 Min 2.94 0.01 0.02 0.01 0.02 Max 14.32 0.11 0.09 0.20 0.18
Hyperglycemia effect on total leukocyte count determination and leukocyte formula in dog and cat blood
38
Table 6 - Effect of spurious contamination of diagnostic blood samples on total white blood cell (WBC), neutrophil (NEU), lymphocyte (LYM), monocyte (MONO), eosinophil (EOS), basophil (BASO) (mean ± standard error of the mean).
DOGS
No Contamination Glucose Contamination
Control 5% 10% 20% Hemodilution
Value Value Value Value Value p
WBCx109/L 10.32 ±2.51 4.99 ± 1.53 4.88 ± 1.42 4.81 ± 1.54 5.05 ± 1.49 <0.001 NEU×109/L 6.77 ± 2.23 3.31 ± 1.31 3.21 ± 1.17 3.96 ± 2.04 3.33 ± 1.24 <0.001 LYM ×109/L 2.18 ± 0.62 0.99 ± 0.36 0.98 ± 0.35 0.94 ± 0.36 1.01 ± 0.32 <0.001 MONO×109/L 0.75 ± 0.28 0.39 ± 0.13 0.40 ± 0.14 0.40 ± 0.14 0.42 ± 0.16 <0.001 EOS×109/L 0.60 ± 0.31 0.29 ± 0.17 0.27 ± 0.16 0.28 ± 0.16 0.28 ± 0.15 <0.001 BASO×109/L 0.02 ± 0.02 0.01 ± 0.02 0.02 ± 0.02 0.01 ± 0.01 0.02 ± 0.03 0.598
Table 7 - Effect of spurious contamination of diagnostic blood samples on total white blood cell (WBC), neutrophil (NEU), lymphocyte (LYM), monocyte (MONO), eosinophil (EOS), basophil (BASO) (mean ± standard error of the mean).
CATS
No Contamination Glucose Contamination
Control 5% 10% 20% Hemodilution
Value Value Value Value Value p
WBCx109/L 13.08 ± 5.89 6.45 ± 3.21 7.04 ± 3.76 6.78 ±3.05 7.06 ± 3.43 0.002 NEU×109/L 8.04 ± 5.36 3.97 ± 2.89 4.36 ± 3.26 4.16 ± 2.72 4.43 ± 3.25 0.080 LYM ×109/L 3.56 ± 1.47 1.70 ± 0.70 1.87 ± 0.79 1.80 ± 0.74 1.84 ± 0.70 <0.001 MONO×109/L 0.50 ± 0.61 0.27 ± 0.35 0. 28 ± 0.35 0.28 ± 0.31 0.28 ± 0.33 0.680 EOS×109/L 0.91 ± 0.38 0.46 ± 0.22 0.49 ± 0.21 0.50 ± 0.20 0.47 ± 0.19 0.001 BASO×109/L 008 ± 0.03 0.04 ± 0.03 0.04 ± 0.02 0.04 ± 0.06 0.05 ± 0.05 0.195
39
A B
C D
E F
Figure 9 - Percentage variation of white blood cell (WBC), neutrophil (NEU), lymphocyte (LYM), monocyte (MONO), eosinophil (EOS) and basophil (BASO) counts in samples of dogs contaminated by a glucose standard solution.
Hyperglycemia effect on total leukocyte count determination and leukocyte formula in dog and cat blood
40
A B
C D
E F
Figure 10 - Percentage variation of white blood cell (WBC), neutrophil (NEU), lymphocyte (LYM), monocyte (MONO), eosinophil (EOS) and basophil (BASO) counts in samples of cats contaminated by a glucose standard solution.