IV CONGRESSO INTERNACIONAL DE CIBERJORNALISMO IV INTERNATIONAL CONFERENCE ON ONLINE JOURNALISM
04/05 Dezembro 2014
Faculdade de Letras da Universidade do Porto
Livro de Atas – Março 2015 Proceedings – March 2015
Ana Isabel Reis, Fernando Zamith, Helder Bastos, Pedro Jerónimo , (org.) Observatório do Ciberjornalismo (ObCiber)
4 Livro de Atas IV CONGRESSO INTERNACIONAL DE CIBERJORNALISMO Março 2015
Proceedings IV INTERNATIONAL CONFERENCE ON ONLINE JOURNALISM
March 2015
Ana Isabel Reis, Fernando Zamith, Helder Bastos, Pedro Jerónimo (org.) Observatório do Ciberjornalismo (ObCiber)
Porto
355 COMBINING ONLINE JOURNALISM AND SELF-DIGITIZATION:
A NEW PRACTICAL APPROACH
Tiago Gama Rocha
Faculty of Engineering, University of Porto [email protected]
Paulo Frias
Faculty of Arts, University of Porto [email protected]
Pedro R. Almeida
Faculty of Law, School of Criminology, University of Porto [email protected]
João Sousa Lopes
Knowledge Engineering and Machine Learning Group, Universitat Politècnica Catalunya
[email protected] Sofia Leite
Faculty f Medicine, University of Porto [email protected]
Abstract
The Golden Triangle of Technology, social, mobile and real-time, accelerated the establishment of the ‘always-on society’. In the field of journalism in particular, the collision between digital technologies and journalism is tale of disruption. With the advent of automatic curated platforms, a new discussion emerges: human versus algorithm editing. While human-editing does not allow for personalized distribution, algorithms do. In this scenario, as opposed to a wider and more universal social experience, our audience individual footprint becomes of the utmost importance. Wearable Technology (WT) has the potential to add another layer to our individual footprint since it extends and augments the communication bandwidth between human and machine. This can be achieved by tracing our physiological reactions. At a more practical level, for journalism in particular, it can affect the quality of personalized news distribution.
In this research, we developed a system that enables the penetration of WT in journalism. Our objective is to understand whether the used physiological metrics are valid inputs for a real-time system designed to maximize the quality of user experience.
356 We present the methodological design and discuss how WT can be used algorithm-editing and personalized-distribution. Authors already pleads for the field of journalism to turn their attention towards WT. They address how WT can work both as a new distribution medium and as a tool for creating content. However, she neglects the disruptive nature of combining journalism and self-digitalization. Furthermore, there is still a lack of research linking WT and distribution.
We first built an interface to receive and process physiological data from biosensors that measure data from electrodermal-system and cardiovascular system. Then, a synchronistic platform was created to record metadata from visited news and physiological metrics from the user. When the efficiency of this technology was tested, the experimental study took place. In our experimental study, the first task consists of subjects navigating a tablet news aggregator while using the biosensors. In the second task, users accessed a personalized curation of the news. Such personalization was based on the individual levels of arousal extracted from the first task. We analyzed the results focusing on the quality of user experience in the second experiment, both per si and by comparison with the first.
We conclude by addressing the gaps to be fulfilled in order fully operationalize such a system, as well as the ethical implications of augmenting the communication bandwidth between audiences and journalism. Our work provides a systematic overview of the growing use of WT in society, as well as practical insights into the use of these devices as add-ons to the quality of news distribution and user experience. Whatever the next incarnation of journalism should look like, people will be at the center of it.
Key words: Online Journalism, Editing, Personalization, Wearable-Technology, Self-Digitalization
Introduction
Ever since the birth of the World Wide Web (web), digitally connected technology has disrupted the traditional way of doing journalism. At first, news organizations were led to connect to the superhighway of information (King, 2010 pp.154-74). This first step towards entering a new medium was the land mark of the future to come. In other words, the lack of understanding of what the new medium was and the lack of understanding of what the new medium might become were responsible for what authors have coined as the “original sin” (Alves, 2006 pp.93-10; Huey et al.,
357 2013). This concept of original sin can be seen in the work of Alves (2006), where the author addresses the phenomenon of repurposing and shovelware. For the author, in the early days the industry showed a lack of understanding about the characteristics of the new medium; hence, a lack of understanding about the new language that was emerging side by side with the advent of the new digitally connected infrastructure. Also, the original sin is address throughout the work of John Huey and colleagues (2013). The authors questions if the internet ethos of free goods was in itself the original sin. In his own words, “was there some “original sin” that unleashed this fierce tide of disruption — say, the decision by so many original news sites not to charge for content?”. Both Huey and Alves address what we consider to be two of the first consequences of the collision between journalism and digitally connected technology: the birth of new language and the collapse of old business models. From then on, information on the web was free, always-on and the newspaper industry had to compete first with other media outlets (television news organizations) and later with a new breed of audience.
A Tale of Disruption between Journalism and Digital Technologies
During the last decade, it has become widely accepted that the web has brought about the advent of a new active audience (Rosen, 2006a; 2006b). This phenomenon is responsible for experimenting with a less declarative and more discursive conversational model, but most importantly, “the people formally known as the audience” established a new paradigm based on relationship (Jarvis, 2011a). While traditional journalism was still using the new medium to push content to the users, mavericks of the field were already experimenting with interacting directly with the network of users.
After the dot-com bust, some of the most potent and disruptive innovations soared into the mainstream. Although searchability was at the core of the Tim Berners-Lee “Information Management” essay (1989) and search-engines already existed, there is clearly a before-and-after Google era. It is not the purpose of this work to provide in full detail how the fastest growing company changed the landscape of the news industry. For our purpose, it suffices to say that the architecture that supports data flowing and data flowing itself was forever changed (Dilon, 2014; Ghemawat et al. 2003) From target advertising, to content aggregation, to personalized services based on individual profiling, Google changed the rules of the game and subdued the dominant Internet media company of the time, Yahoo (Economist, 2004; Volgenstein, 2007).
358 Google has not created a new language or a new audience; instead, it has created an empire. According to Martin Sorrell (Huey, 2013), Google’s “principal operating principle, it would be disintermediation of established business models and providing you and I as consumers with a cheaper alternative, a better-value alternative…” Sorrel agrees this is “an industrial revolution that probably, for legacy companies, is very difficult to deal with.”
A few years later, the world went social. The expanding social media ecosystem and the growing empowerment of users through the possibility of accessing digitalized information at a very low cost (Cross and Parker 2004) invoked an even deeper pondering of the online journalism place in the network age. The new ecosystem that agglomerates communities of users, being their core functionality the ability to make connections, accelerated the establishment of relationships between users (Donath and Boyle 2004; Ellison et al. 2006). Consequently, the pace of disruption for mainstream media rapidly grew and underlined the need for a renewal of how journalism should act in the new medium. In the 2009 Nieman Lab Report, Richard Gordon underlined how social media platforms create challenges to the news structure (journalists, organizations and media companies) that had just started to embrace social media (Gordon, 2009). Other professionals have talked about how journalism can make use of social media platforms (Betancourt, 2009; Lowery, 2009) and how user behavior is changing news media (Greenshow & Reifman, 2009; Levy 2009; Li and Bernoff 2009; Ostrow 2009; Skoler 2009). Also, a number of articles that aim to provide a better understanding of how the use of social media in daily routines is transforming many aspects of the journalistic field: schools of journalism (Greenhow and Reifman 2009; Klose 2009), the role of the journalist (Gordon 2009; Jarvis 2011b, 2011f, 2011g; Lavrusky 2009; Lewis 2009; Skoler 2009), the role of the user, (Holtz 2009; Jarvis 2011g; Picard 2009), the role of content (Jarvis 2011c, 2011d, 2011e; Jarvis in King 2010), and the ethical challenges ( Jarvis 2011g; Leach 2009; Podger 2009). The most successful and widely used social media platform, Facebook, according to Chris Cox (Huey 2013), has since acted as an “accelerant to help users discover something more quickly online, from news to a new application or website”.
Data Ubiquity: Human Editing versus Algorithm Editing
While the industry was still trying to adapt to being always-on, having to learn new skills and competences to produce content by means of a new language, learning
359 how to interact with a new breed of users, and being more of a process and less of product, the digital world was entering the age of data ubiquity (Pitt, 2013). Together with social, mobile and real-time were coined as the golden triangle of technological disruption (O’Reilly, 2009). As we have become accustomed to real-time feeds that reach us in our evermore ubiquitous all-purpose mobile devices, it has become incredibly valuable to analyze the subsequent data that emerges from the interaction with the triangle. In a broad sense, we can segment this data in three categories of user interaction:
i. data that emerges from user interactions with other users allowing us to separate the influencers from the crowd;
ii. data that comes from users interaction with content helping us to understand individual and/or social interests, and;
iii. data from users interaction with technology enabling us to monitor consumption habits.
To successfully manage these three categories of data is of great value to successfully operate within what Solis calls “the era of an audience of audiences with audiences” (Solis, 2013: 56). In other words, the purpose of all data categories is to improve both the relationship with our audience and to maximize the exposure of our content in the hope it reaches the edges of our network, thus increasing our audience. It is a holistic approach that brings forward better results: knowing the influencers of our network and feeding their interests at the right time is a good recipe for maximizing content exposure.
In fact, the journalistic field is already aware of data’s potential. In recent years, data journalism has gone mainstream and computational journalism emerged as a new and more complex field of research (Howard, 2014). Although still in its infancy, the later has gone beyond non-linear data visualization and has for some time now been exploring with information mining and discovery, web community sensing and tracking information flows, to name a few (Diakopoulos, 2012a). The influence of pattern recognition on journalist processes - information gathering, organizing/sense-making, communicating/presentation and disseminating/public response - is already being discussed. In order to handle the big data generated by these three types of data mentioned above, to understand the structure and the role of the algorithm is crucial to
360 re-define journalism in this new environment. C.W. Anderson proposes the algorithm as an object of news “that intersects both journalistic practices and products, and ultimately affects the definitions of journalism itself” (Anderson, 2011).
In fact, algorithms that aggregate, curate and allow for recommendations systems are now either assisting and augmenting human-editors or competing to replace them (Diakopoulos, 2012b; Wayner, 2013). The real issue is that algorithms are increasingly more ubiquitous, thus “understanding how algorithms control and manipulate your world is key to becoming truly literate in today's world” (Macbride, 2014). Algorithms are not neutral. It is designed by a human, and it is made of internal rules that are voluntarily chosen by the human that ultimately affect the flowing of information. In essence, both sides, human and algorithm editing, are very similar: they are flawed, biased and, to some extent, gatekeepers. Nicholas Diakopoulos (2013c) in his paper “Algorithmic Accountability Reporting: On the Investigation of Black Boxes” argues that journalists need to be capable of demystifying algorithms. He offers a methodology for doing so with a primarily objective of forcing more transparency in those automated systems. For the author it is increasingly important that professionals within the field of journalism pay attention to the new tools that “influence almost all the information you consume, from news stories, to social media updates, to movies, books, and television programs” (Macbride, 2014).
Personalized Distribution and Audience Footprint
Furthermore, we have recently seen a boom of platforms that aggregate content from different sources and provide a personalized curation of news content to audiences. As opposed to other types of relationship, in these services the audience is not asked to embrace the participatory culture. Users are not asked to be the media, to create content, or to contribute to the process. According to Schudson and Fink (2012) this type of relationship only requires audience participation in an “automated, aggregated clickocracy”. These are automated algorithm-based media outlets that relate “with audiences in an aggregated, big-data kind of way”, as argue Michael Schudson and Katherine Fink (2012) when reviewing the work of C.W. Anderson. Once again we can infer that the power is neither belonging to audiences nor to journalists. The real power rests on the programmers “who create the algorithms, and whose analysis of the resulting data drives news decisions down uncharted paths” (ibid.). For this type of personalized services, the audience individual footprint is of great value. Nevertheless,
361 this data-driven footprint is still very shallow: “There’s no opportunity for algorithmic audiences to explain why they clicked, whether they’re glad they did, or whether they’d click on something similar in the future” (ibid.). This is the true limitation of data - it accounts for an explicit behavior analysis, being the explicit behavior what users say or do about a certain “product”. We argue that implicit behavior is an equally important dimension (and nowadays possible) to address once it accounts for the internal physiological reactions that truly mirror the inner response of an individual.
What happens if engineers can tap into human physiology? What will be the ripple effect of having access to the treasure trove of human internal reactions? These questions launch our approach to Wearable Technology (WT) and journalism.
It is different from what Spruill (2013) advices in the sense that she limits her arguments to WT being either as HeadsUp Display or Smart Watches. Indeed, Spruill was one of the first to both discuss how new heads up displays, i.e. Google Glasses, can become a tool for content creation, augmenting the work of the journalist and how Smart Watches, i.e. Apple Watch, can become a new distribution medium. However, the author neglects two other categories of WT: Virtual Reality and Activity Monitors. Our approach will focus on WT as Activity Monitors. By neglecting the human Activity Monitors, the field is neglecting that human-beings are data-generating machines. The human body is a treasure trove of information and, with the mass-usage of WT, emotions, biometrics and behaviors can all be tracked and analyzed.
Wearable Technology adds another layer to this individual footprint
Wearable Technology (WT) as Activity Monitors concerns the integration of sensors within clothes or accessories that people wear in their daily routine. These sensors capture bio-signals, such as heart rate, galvanic skin response, etc, which enables the self-monitoring of physiological states and self-sensing of external data, as location and time. Without being exhaustive, WT concerns a wide range of areas. For instance: Self-experiment (e.g. “The Experimental Man Project”); Self-assessment and and self-diagnosis (e.g. “Digifit”); Lifelogging, lifecaching, and lifestreaming (e.g. “CureTogether”); Behavior management (e.g. “Mappiness”); Location monitoring (e.g “Foursquare”); Biometrics (e.g. “APRIL Face Aging Software”); Physical training and sports (e.g. “RunKeeper”); Health personal data (e.g. “Google Health”); Nutrition and weight loss (e.g. “MyFitnessPal”); Monitoring and improving productivity (e.g.
362 “RescueTime”); Sleep quality (e.g. “Zeo Personal Sleep Coach”), Well-being and mood (e.g. “MoodScope”); Problem-solving skills (e.g. “Anki”).
This tech-clothing and tech-accessories generate impressive amounts of valuable data about one’s life. This type of physiological data covers all three types of data mentioned above and goes beyond the value that current analytics provide. If we consider that the physiological state of an individual informs about the cognitive state (whether they are concentrated, tired, excited), then we are more close of understanding the richness of such data. Moreover, it is worth to add that these tools let people track their physiological responses completely passively, which is comfortable, and that appropriate software and visualization displays make data interpretation greatly facilitated. The fact that people began voluntarily and actively introducing these tools in their lives made Kevin Kelly and Gary Wolf launch the concept of quantified-self, back in 2007. This concept goes hand by hand with others, such as digitization, self-tracing or lifelogging. Actually, a growing segment of the population spends a remarkable amount of time capturing and monitoring their personal data, by using WT. Their interests range from pure entertainment to health and well being concerns.
Also within the scope of WT, intelligent algorithms became increasingly needed to face the challenges of handling such valuable and big amounts of data. These types of intelligent algorithms are capable of learning the information contained in big data databases. These algorithms are the scope of current massive machine learning research and characterize the next generation of smart technology. They can either be used for helping in the decision-making process of human editors or to develop a system that uses this information to infer operating rules, enabling algorithm editing. As previously mentioned, the former option implies that journalists integrate knowledge about how algorithms operate; the latter is especially relevant by the actual capability of creating systems (physiological computing systems) that grow in their autonomy and ability to real-time adapt to user’s needs or expectations in a dynamic and fluid manner.
Overall, what is relevant to extract is the possibility that WT provides of gathering in an easy-and-comfortable-to-use manner physiological data generated by the simple situation of being reading news. This is important because implicit or physiological response tells us about the true expectations and reactions of users, allowing the editor to profoundly know its user, being it a human editor or an algorithm editor. It is now intuitive that physiological computing systems add another layer to the individual footprint of users bypassing the above mentioned “clickocracy”. This
363 advantage applies to a wide range of situations, in which it is favorable to the user that the machine potentiates his/her experience and/or quality of life.
In sum, the dissemination of WT usage was a critical step towards the long-term trend having mass-scale access to a crucial type of data: physiological data. The ideas of intelligent algorithms that make machines establishing a dialogue with users and of a self-digitization phenomenon expand and fuel innovation. In the field of journalism, WT points towards a long-term trend of enhancing the process of editing and distributing news, either via an algorithm or via a human that understands the data flow.
Objectives
We will now present the system we developed to start testing the plausibility of including the potentials of Wearable Technology in the field of journalism. Our major goal was to verify the usability and reliability of this system, so as to set up a reference for future developments. While usability is simple to observe and infer, reliability implies defining a finer-grained goal. As such, our specific objective was to test whether the physiological metrics we chose are sufficiently reliable for establishing a cybernetic loop, i.e., we aimed at understanding whether the chosen physiological metrics are valid inputs for a real-time system designed to maximize the quality of user experience. These will only hold reliable as long as we can extract coherent and consistent results by correlating user’s implicit response with user’s explicit response some time after reading the posts.
Methodology
In order to extract valuable information about news consumption behavior and to infer about the reliability of the chosen metrics, it was required that the system was able to store and synchronize in a single database both the data collected by the wearable biossensores and the metadata that characterizes the news feed the subjects were being exposed to. Only then we could evaluate the matching between both types of responses for a certain news content.
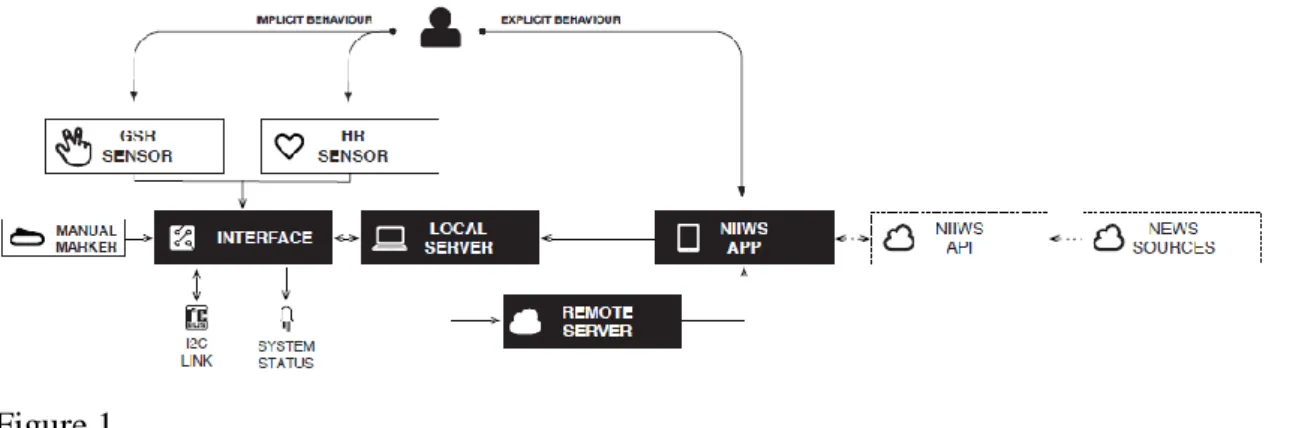
How the system works
During user’s navigation in the news aggregator, physiological data from bio-sensors (implicit data) is captured and send to an interface, where digitalization and
364 serialization take place. Then, this physiological data is sent to the local server, which is responsible for assigning the physiological data to the DB.
The local server also receives and saves the metadata resulting from the user’s interaction with the news aggregator. A remote server continuously mediates communication between the local server and the news aggregator so as to inform the news aggregator where the local server is located.
Figure 1 shows how these modules and devices are connected. A detailed description of each module follows.
Figure 1
Interface
The arduino [master] routine is responsible for the serialization of 1) the analog GSR sensor reading and 2) HR and manual marker digital sensors readings (Figure 2). A digital input may occur between the serialize_loop sample rate (2Hz). For that reason, a main_loop, with a higher sample rate (1024Hz), is used to collect and measure heart rate. The date flows through both serial and I2C protocols. Those channels also allow configuration preferences (sampling rate) and system status orders (on/off digital outputs). The system was design to supply both power and a daisy chained I2C protocol to multiple PCBs. For this reason, adding future extension becomes a straightforward procedure.
365 Figure 2
Local server
It is composed of two independent processes (Figure 3). On one hand, we have an Apache server running an Interaction Logger PHP script that saves the incoming metadata from the user’s interaction with Niiiws app in the DB. On the other hand, we have a standalone python-based app. The Manager firstly updates the Interaction Logger’s local IP in the Remote-Server. Secondly, it is responsible for launching a 4-step-loop process:
o Signal & DB Monitoring – Detects incomplete columns in the DB
resulted from a previous input from the Interaction Logger. If so, 1) activates the Screenshot Service (a new Python independent process) and 2) sends an order to the Interface commanding the System Status visual indicators. It also 1) performs the program variables dependent of the sensors readings and 2) commands function calls within the next steps.
o Real-time Signal Processing (this step is only done over GSR
Conductance value) for the purpose of Data visualization - Firstly it sets a window of 50 readings, as well as its displacement over time. Secondly, performs an FFT to retrieve the sample’s power spectrum. Thirdly, removes every frequency below 2Hz and, reconverts the spectrum into the waveform by means of an iFFT. Finally, it
366 estimates a polynomial curve that best match the values on the waveform. After, the system provides an interactive plot of both GSR Processed Conductance data and HR raw data for purposes of real-time monitoring.
o Data Aggregation – It inserts into the DB the raw value of the sensors
together with the GSR Processed Conductance and, if a screenshot was triggered, the marker flags.
367 Remote server
The single purpose of the remote server (Figure 4) is to inform the Niiws app about the location of the Local-Server. It holds a Write TXT PHP scrip. When a Local Server request arrives, the same file is written in the remote environment.
Figure 4
News aggregator
First, via Remote-Server, the App reads and records the subnet IP of the Local Server.
Second, on each visited content and service personalization, the Niiiws App, via Interaction Logger, sends the correspondent metadata to the Local-Server. (Figure 5)
Figure 5
When visiting content the metadata should be the following: o userEmail (the email of the current registered user)
o niiiwsSection (the Niiiws’ section where the selected news was placed) o niiiwsTags (the Niiiws own generated tags associated with the selected news)
368 o sourceTags (the tags extracted from the source of the selected news by means of a Niiiws’ proprietary automatic parser)
o sourceURL (the URL of the source of the selected news)
When personalizing the service, the metadata will also include the following field:
o addPersonalizedTags (the new “added” tag)
How data is processed and analyzed Signal Processing
In relation to the aggregated data of every participant, the following steps were performed for i) the baseline set, ii) every interval between news and iii) every read news. (Figure 6)
369 GSR signal processing:
o insofar as the interface detected absence of sensor’s contact with participants skin, in the DB values were set as “-1”. Firstly the signal processing discover these error values. Secondly, based on the complete array of acceptable values the -1 are interpolated;
o for the purpose of correcting this sensor recurrent plunging trend a linear detrending function to the values set is applied;
o Both the lowest and the highest value within the set as well as the average value are identified. Equally identified is the position, in ms, where those values are primarily reached.
o Furthermore, the “semi recovery time” (SemiRT) is identified. It implies calculating the forwarding time (in ms) between the average value and the highest value. The SemiRT is marked as Null whenever the highest value position precedes the average value position.
HR signal processing:
o insofar as the interface detected absence of sensor’s contact with participants skin, in the DB values were set as -1. In addition, HR positions where the value either bigger or lower than 5 times the value of previous position are identified and set to Null in the DB. Based on the complete array of acceptable values the -1 and Null are interpolated;
o Both the lowest and the highest value within the set as well as the average value and standard deviation are identified. Equally identified is the position, in ms, where those values are primarily reached.
o By means of a fast Fourier transformation, applying an hanning windowing function on 10 second windows with 5 second overlap, the time domain signal is transformed into frequency domain. Subsequently,
o A band pass filter between 0.15 and 0.4 Hz is applied (this high-frequency range is related to emotional arousal) and the average power of this band is calculated. Finally, the average of this power band is determined for all the windows.
Data Analysis
First, mean values for each news section were calculated and Pearson correlations were extracted to verify the reliability of Niiiws metadata, i.e., to verify
370 whether the sections determined by Niiiws were actually good criteria for discriminating the news content. Correlations between different news of each section (e.g. every “International” news), as well as distinct sections (e.g. between “International” and “Politics”) were calculated, with the purpose of analyzing whether the within section correlation for each physiological signal is significantly higher than the between section. This being the case, then “section” tag provides sufficient reliability to be used as a classification tag. As some subjects visited more contents than others within a specific section, we only considered for analysis those sections that were visited 4 times maximum by at least 4 subjects.
On a second stage, the ranking of contents provided by the GSR and HR responses were compared with the responses participants provided two weeks following the experiment. We expected that responses associated with higher physiological activation would be recalled to a higher degree by the participants.
How the study was designed Procedure
The procedure is composed of two phases. In the first phase, the objective is to track the historical of news consumption behavior of the participants. During navigation in a news aggregator, participants wear two non-invasive wearable bio-sensors, so that both explicit and implicit data are collected. In the beginning of the first phase, participants are also asked to complete a brief socio-demographic questionnaire. All participants were asked in advance to participate in the study, acknowledging it will be longitudinal. They were also asked their current email address to be contacted by the research team. Fifteen days after the first session, participants were then emailed and asked about the topics they remember having read, about those that captured their interest the most, and to describe these contents as detailed as possible. Answers to these questions are relevant explicit data for associating with implicit data we collected and to discuss the reliability of the variables we chose. In the second phase, the objective is to deliver personalized news to the same participants, according to the information extracted in the first phase. The second phase will take place after the first-phase data is analyzed. In the second first-phase, participants will once again navigate in the news aggregator, but this time they are fed with contents that match their implicit preferences of the first phase.
371 Participants
Subjects were sample by convenience. Only 18 subjects participated in the study because we wanted verify the tendency of preliminary data and understand the validity of the system.
The subjects were aged between 20 and 35, men and women, either college students or college graduates, and used to mobile devices and mobile apps for news consumption.
Volunteers diagnosed with mental illnesses, history of traumatic brain injury, or substance consumption did not participate in the study. Those who were accepted for participation abstained from consuming alcohol in the days before the experiment.
Materials (Software and Hardware) Hardware
An iPad2 was used for navigating the news aggregator app. The sensors used for collecting Galvanic Skin Response (GSR) and Heart Rate (HR) data were, respectively, a Libelium e-Health PCB and a Polar T34 Transmitter.
Software
Niiiws app was chosen for the participants to navigate. This is a portuguese news aggregator. By using a news aggregator instead of a single publisher, we can ensure that the editorial line is not biased. Niiiws aggregation criteria are based on Facebook daily views ranking.
Our system
The system we developed is composed of hardware and software and is described in the second section of the methodology.
Setting / Task / Instructions
The experience took place in a quiet silent room. Before starting, participants put the sensors on. Then, they were asked to do simple movements to ensure that the signal is being captured and they sited on a chair in front of a table. The iPad running the Niiiws app was installed on the table in an ergonomic position. The researcher was in the room, out of sight of the participant. The goal was that participants would feel as much comfort as possible so that they would get distracted.
372 The app and its use were then described to the participants. They were also told that they can go through any content they feel like. They should navigate during at least 20 minutes. After 20 minutes, they were told to stop.
Before starting the navigation, participants were asked to create a password protected account and memorize their password. This will enable the creation of a personalized content feed in the second phase. After finishing the navigation time, if the researcher detected that the participant avoided some contents, it was suggested the participant to read some more news about those contents. The goal of this procedure is to ensure a record of physiological reactions to contents that are not likely to interest the participant.
In the second phase, participants will be uniquely told to navigate during how many minutes. After navigation, they will complete a brief questionnaire about this personalized experience.
Niiiws app
The app is composed of one section of highlight news and seven sections of National, Politics, Economy, International, Sports, Culture, and Science&Technology. Each section is composed of five pages, each page composed of five different contents. Fig.1 shows the layout of Niiiws app.
Preliminary Results
Preliminary results concern the extent to which GSR and HR show the reliability of Niiiws metadata, as well as the analysis of correspondence between physiological responses (implicit data) and later recall (explicit data).
In regards to Niiiws metadata, GSR discriminates news sections with an error margin of 11.8%. This is above the optimal value of 5%, but still indicates a tendency for accurate discrimination. On the contrary, HR discriminated between news sections with an error margin of 40%, which is practically a random discrimination. This is translated in graphs 1 and 2. Horizontal lines are the value of the mean correlation within sections and dots represent the values of correlations between section.
373 Graph 1
Graph 2
In regards to the analysis of correspondence, in spite of the reduced number of elements for analysis, results appear promising. In eight of ten cases analyzed (the remaining eight subjects did not answer yet to the questionnaire), the GSR highest response corresponds to the same section as the news content the subjects recall. On the
374 contrary, such correspondence does not occur for HR highest response and Recall, except for two cases. This is shown in table 1.
Table 1
Discussion
Given the reduced number of participants, data analysis is preliminary. Even so, GSR results show that the Niiiws’ news sections are a reliable categorization for discriminating news contents, which was not verified with HR data.
WT used for personalized distribution and algorithm editing
Our preliminary results point towards the direction of discriminating news sections based on physiological data gathered by GSR sensor. We assume to be on the right path to add physiological data to the process of editing and distributing news in an algorithm-based manner that either operates autonomously or that supports human decision making. However, note that our ambition is to show the possibility that physiological data helps feeding users with their preferred news contents, not news sections. To develop an algorithm that informs [either the system or a human] about users’ cognitive and affective reactions to reading news contents still carries some unsolved technical problems.
First of all, we are assuming this possibility based on preliminary results. Increased samples are need for more robust conclusions to be taken. Second, we now assume that GSR signal distinguishes between Niiiws’ news sections, but it is possible that other news aggregators make a different categorization. As such, it might be a consequence that GSR is not a robust measure for all types of categorizations and/or for all news aggregators. The same holds true for editorial lines. What guarantees that the same news content published under different editorial lines elicit the same response? Experimental studies as this one allow us to take only a few conclusions in regards to its external validity. A current limitation of this type of systems is their limited scope of
375 action. At least for now, these systems can only be developed for the specific purpose and situations under which they are tested. Universality is still beyond the horizon. Third, in order to edit and distribute news contents based on physiological data, it is insufficient to distinguish between news sections. Finer discriminations are needed, which implies testing the reliability of finer categorizations. The best case scenario would be to also test the reliability of other physiological data sensors and to combine all these inputs for a more robust index of user’s reaction. Fourth, as we mentioned, these bio-sensors are increasingly used under the umbrella of activity monitors, i.e., systems that let people track their behavior completely passively. As such, we need to find a way to imbed GSR sensors in the accessories/devices people wear/use in their daily routines, so as to subtract the invasiveness of having a GSR attached to two fingers. This might seem an obstacle, but we are benefited by the growing usage of smart-phones and tablets, in which people navigate by touching with their fingers. We suppose these devices could have an in-built GSR sensor. Further technical problems and usability issues arise; however, this scenario is in fact a possibility. Finally, although the journalistic field needs to find new solutions to operate in this evermore message immersed digitally-connected world, and although journalism needs to look ahead and incorporate the technological potentials of nowadays trends, who guarantees that the audience finds value in extending self-digitization to reading news and in feeding news platforms with their personal data?
Conclusion
In a synchronic perspective, the work presented here might seem dependent on who brings WT into their lives and what are the fields or sectors that people mostly associate with the benefits of WT. However, we are not primarily focused on today’s world neither we are trying to guess when a specific trend will happen. As Katherine Fulton (1996) argues, this is about “discussing the shape of the diffusion curve” and not “ignoring overall, long-term trends”. In fact, nowadays, the rapid accelerating short-term trend of WT might point us towards a long-short-term trend of intelligent machines capable of establishing a dialogue with users. In the specific case of journalism, this has expression in algorithm editing and distribution of news contents.
We believe this is a more of a question of a digitized society that is creating a new type of audience: active, social, and quantified. And, as Francis Pisani (2009) advises, the field of journalism must start working to the audiences of tomorrow: “So
376 then, if they prepare only for a world of today that is dominated by people who don’t understand the logic of the Web, they are going to be preparing for yesterday’s world. Therefore, if they think about what will happen in 2040 or in 2050, then they will understand what is going to be useful to them” (Barbero, 2009). Regardless of the technological breakthroughs of the future, “the revolution occurring in the news media provides an opportunity to reconsider the practice of journalism”, says Loren Ghiglione (2010: 6) when addressing the future of news. The horizon may be long, but, actually, time is short. The choice is simple: follow, or lead” (Fulton, 1996).
Literature
ALVES, Rosental (2006). “Jornalismo digital:dez anos de Web e a revolução continua”. In: Comunicação e Sociedade. vol 9-10. Minho: Comunicação e Sociedade, pp. 93-10.
ANDERSON, Chris W. (2011). “Understanding the Role Played by Algorithms and Computational Practices in the Collection, Evaluation, Presentation, and Dissemination of Journalistic Evidence”. 1st Berlin Symposium on Internet and Society. 26 October 2011. Accessed 8 May, 2014.
http://www.hiig.de/wp-content/uploads/2012/04/Intermediaries-in-Public Communication-Algorithm-and-Journalism-Paper.pdf
BARBEDO, S.M. (2009). “Conversation with Francis Pisani: The Popular Custom Journalist Serving the Web”. In: International Journal of Communication 3, vol. 3. Segovia: University of Southern California.
BERNERS-LEE, Tim (1989). “Information Management: A Proposal”. In: PACKER, Randal; JORDAN, Ken (2002). Multimedia: From Wagner to Virtual Reality. New York: Norton, p. 208-224
BETANCOURT, Leah (2009). “How Social Media is Radically Changing the Newsroom”. Mashable. 8 June, 2009. http://mashable.com/2009/06/08/social-media-newsroom/
CROSS, Robert L.; PARKER, Andrew (2004). The hidden power of social networks.Boston: Harvard Business Press.
DILLON, Brendon (2014). “Google Cloud Data Flow – Game Changer”. Logentries. 30 June, 2014. Accessed 30 October 2014. https://blog.logentries.com/2014/06/google-cloud-dataflow-a-game-changer/
377 DONATH, Judith; BOYD, Danah (2004). “Public displays of connection”. In: BT Technology Journal. Vol. 2, No 4, pp. 71-82. Accessed 18 June, 2011.http://www.danah.org/papers/PublicDisplays.pdf
DIAKOPOULOS, Nick (2012a). “Whitepaper: Cultivating the Landscape of innovation in Computational Journalism”.Tow-Knight Center for Entrepreneurial Journalism. April 2012. Accessed 8 May, 2014.
http://cdn.journalism.cuny.edu/blogs.dir/418/files/2012/04/diakopoulos_whitepaper_sys tematicinnovation.pdf
DIAKOPOULOS, Nick (2012b). “Understanding bias in computational news media”.Nieman Journalism Lab. 10 December, 2012. Accessed 8 May 2014.http://www.niemanlab.org/2012/12/nick-diakopoulos-understanding-bias-in-computational-news-media/
ECONOMIST (2004). “Technology Quarterly: How Goolge works”. The Economist.
16 September 2004. Accessed 30 October 2014.
http://www.economist.com/node/3171440
ELLISON, Nicole; HEINO, Rebecca; GIBBS, Jennifer (2006). “Managing Impressions Online: Self-Presentation Processes in the Online Dating Environment”. In: Journal of Computer-Mediated Communication, vol. 11, No 2. Accessed 20 January, 2012.http://jcmc.indiana.edu/vol11/issue2/ellison.html
FULTON, Katherine (1996). “A tour of uncertain future”. Columbia Journalism Review. March 1996. Accessed 20 September, 2014.
http://web.archive.org/web/20040419174730/http://archives.cjr.org/year/96/2/tour.asp GHEMAWAT, Sanjay; GOBIOFF, Howard; LEUNG, Shun-Tak (2003). “The Google File System”. In: ACM, October 19-22.
http://static.googleusercontent.com/media/research.google.com/pt-PT//archive/gfs-sosp2003.pdf
GHIGLIONE, Loren (2010). “Future of news: An introduction”. Daedalus Spring 2010, Vol. 139, No. 2. Boston: MIT Press, p. 1 - 8
GORDON, Richard (2009). “Social Media: The Grown Shifts”. Nieman Reports: Nieman Foundation for Journalism at Harvard, Fall 2009. Accessed 20 January, 2012. http://nieman.harvard.edu/reportsitem.aspx?id=101883
GREENSHOW, Christine; REIFMAN, Jeff (2009). “Engaging Youth in Social Media: Is Facebook the New Media Frontier?”. Nieman Reports: Nieman Foundation for Journalism at Harvard, Fall 2009. Accessed 20 January,2012.
378 http://www.nieman.harvard.edu/reportsitem.aspx?id=101906
HOLT , Shel (2009). “The Continuing Need for Professional Journalism”. A Shel of my Formal Self. 18 May 2009. Accessed 23 January, 2012.
http://holtz.com/blog/media/the_continuing_need_for_professional_journalism/2900/ HOWARD, Alexander Benjamin (2014). “The Art and the Science of Data-Driven Journalism”. Tow/Knight report: Tow Center for Digital Journalism. Accessed 20 September, 2014. http://towcenter.org/wp-content/uploads/2014/05/Tow-Center-Data-Driven-Journalism.pdf
HUEY, John; NISENHOLT , Martin; SAGAN, Paul (2013). “Riptide: an oral history of the epic collision between journalism and digital technology from 1980 to the present.” NiemanLab. Accessed 20 October, 2014. http://www.niemanlab.org/riptide/ JARVIS, Jarvis (2011a). “140 charecters conference: Exploring the state of now.” 16 June 2011. Accessed 14 January, 2012. http://www.ustream.tv/recorded/15421659 JARVIS, Jarvis (2011b). “The storyteller strikes back”. Buzzmachine, 17 June 2011. Accessed 14 January, 2012. http://www.buzzmachine.com/2011/06/17/the-storyteller-strikes-back/
JARVIS, Jarvis (2011c). “Content, dethroned”. Buzzmachine. 27 June 2011. Accessed 14 January, 2012. http://www.buzzmachine.com/2011/06/27/content-dethroned/
JARVIS, Jarvis (2011d). “The article as luxury or byproduct”. Buzzmachine. 28 May 2011. Accessed 14 January, 2012. http://www.buzzmachine.com/2011/05/28/the-article-as-luxury-or-byproduct/
JARVIS, Jarvis (2011e). “An article on the article”. Buzzmachine. 27 June 2011. Accessed 14 January, 2012. http://www.buzzmachine.com/2011/06/27/an-article-on-the-article/
JARVIS, Jarvis (2011f). “The orthodoxy of the article part II”. Buzzmachine. 12 June 2011. Accessed 14 January, 2012. http://www.buzzmachine.com/2011/06/12/the-orthodoxy-of-the-article-part-ii/
JARVIS, Jarvis (2011g) “Readors are our regulators”. Buzzmachine. 11 July 2011. Accessed 14 January, 2012. http://www.buzzmachine.com/2011/07/11/readers-are-our-regulators/ KING, Elliot (2010). Free for all – The internet’s transformation of journalism. Evanston Illinois: Northwestern University Press, pp.154-74
KLOSE, Kevin (2009). “Notes from a New Dean”, American Journalism Review, Issue Jun-July 2009. Accessed 28 January, 2012. http://www.ajr.org/article.asp?id=4759
379 LAVRUSIK, Vadim (2009). “10 Ways Journalism Schools are Teaching Social Media”. Mashable. 19 June 2009. Accessed 15 January, 2012.http://mashable.com/2009/06/19/teaching-social-media/
LEVY, Stevan (2009). “Mob Rule! How Users Took Over Twitter”. Wired Magazine, October 2009. Accessed 19 January, 2012.
http://www.wired.com/magazine/2009/10/ff_twitter
LEWIS, Woody (2009). “Social Journalism: Past, Present, and Future”. Mashable. 7 May 2009. Accessed 22 February, 2012. http://mashable.com/2009/04/07/social-journalism/
LI, Charline; BERNOFF, Josh (2008). Groundswell: Winning in a World Transformed by Social Technologies. Boston: Harvard Business Press, 2008. Print.
LOWERY, Courtney (2009). “An Explosion Prompts Rethinking of Twitter and Facebook”. Nieman Reports: Nieman Foundation for Journalism at Harvard, Fall 2009. Accessed 12 February, 2012.
http://www.nieman.harvard.edu/reportsitem.aspx?id=101894
MACBRIDE, Kelly (2014). “Poynter at SXSW: Algorithms, Journalism and Democracy”. Poynter. 28 February, 2014. Accessed 29 October 2014.
http://www.poynter.org/latest-news/top-stories/240635/poynter-at-sxsw-algorithms-journalism-and-democracy/
O’REILLY, Tim (2009). “Web 2.0 summit starts today”. Radar.oreilly . 20 October 2009. Accessed 20 Setember, 2014. http://radar.oreilly.com/2009/10/web-20-summit-starts-today.html
OSTROW, Adam (2009). “Sharing on Facebook Now More Popular Than Sharing By E-mail”. Mashable. 20 July 2009. Accessed 12 February, 2012.
http://mashable.com/2009/07/20/facebook-sharing-data/
PICARD, Robert G. (2009). “Blogs, Tweets, Social Media and the News Business”,Nieman Reports: Nieman Foundation for Journalism at Harvard, Fall 2009. Accessed 12 February, 2012.
http://www.nieman.harvard.edu/reportsitem.aspx?id=101884
PISANI, Francis (2006). “Journalism and Web 2.0”. Nieman Reports. Nieman Foundation for Journalism at Harvard. Winter 2006. Accessed 9 February, 2011.http://www.nieman.harvard.edu/reportsitem.aspx?id=100293
PITT, Fergus (2014). “Sensors and Journalism”. Tow/Knight report: Tow-Knight Center for Entrepreneurial Journalism. Accessed 20 September,
380
2014.http://towcenter.org/wp-content/uploads/2014/05/Tow-Center-Sensors-and-Journalism.pdf
PODGER, Pamela J. (2009). “The Limits of Control”, American Journalism Review,
Issue Aug-Sept 2009. Accessed 9 February,
2012. http://www.ajr.org/article.asp?id=4816
ROSEN, Jay (2006a). “The people formerly known as the audience”. Huffington Post. 30 June 2006. Accessed 21 February, 2011. http://www.huffingtonpost.com/jay-rosen/the-people-formerly-known_1_b_24113.html
ROSEN, Jay (2006b). The People Formerly Known as the Audience. Press Think. 27 June 2006. http://archive.pressthink.org/2006/06/27/ppl_frmr.html
SCHUDSON, Michael; FINK, Katherine (2012). “The Algorithm Method: Making news decisions in a clickocracy”. Columbia journalism review. 31 January 2012.
Accessed 30 October,
2014. http://www.cjr.org/the_research_report/the_algorithm_method.php
SOLIS, Brian (2013). The end of business as usual:rewire the way you work to succeed in the consumer revolution. New Jersey: Wiley.
SKOLER, Michael (2009). “Why the News Media Became Irrelevant--And How Social Media Can Help”. Nieman Reports: Nieman Foundation for Journalism at Harvard, Fall 2009. Accessed 14 February, 2012.
http://www.nieman.harvard.edu/reportsitem.aspx?id=101897
SOLIS, Brian (2013). The end of business as usual:rewire the way you work to succeed in the consumer revolution. New Jersey: Wiley.
SPRUILL, Fiona (2013). “Wearable tech creeps into the mainstream”. NiemanLab. 16 December 2014. Accessed 20 September, 2014.
http://www.niemanlab.org/2013/12/wearable-tech-creeps-into-the-mainstream/
VOGELSTEIN, Fred (2007). “How Yahoo blew it”. Wired. February 2007. Accessed 29 October 2014. http://archive.wired.com/wired/archive/15.02/yahoo.html
WAYNER, Peter (2013). “Algorithms are the new content creators, and that is bad for news for humans”. Wired. 8 July 2013. Accessed 8 of May, 2014. http://www.wired.com/2013/08/some-arguments-about-fair-use-pit-humans-against-machines/