Water Alternatives 11(3): 933-956
Integrating Water Footprint and Sefficiency: Overcoming Water
Footprint Criticisms and Improving Decision Making
Naim Haie
Water Resources and Environment Division, Civil Engineering Department, University of Minho, Guimarães, Portugal; and International Water Resources Association, Paris, France; [email protected]
Miguel Rodrigues Freitas
Department of Studies and Planning, Águas do Norte, SA (AdP Group), Portuguese Public Water and Wastewater Company, Guimarães, Portugal; [email protected]
Joana Castro Pereira
Lusíada University, Porto, Portugal; and IPRI-NOVA, Portuguese Institute of International Relations, Lisbon, Portugal; [email protected]
ABSTRACT: The Water Footprint Network (WFN) methodology has emerged as a major framework of/for policy analysis as water problems increase. Being addressed by a growing body of literature, water footprint (WF) accounting has advanced substantially in recent years, whereas its sustainability assessment has lagged behind. For this and other reasons, the suitability of WF in guiding water management and planning has been criticised. Simultaneously, water efficiency has gone through much discussion and a new framework called 'sefficiency' (sustainable efficiency) has been presented. It uses a universal law (water balance) to develop systemic and comprehensive performance indicators, integrating water quantity, pollution and value to reveal their trade-offs in multi-level governance with climate descriptors and stakeholder enablers. This article revisits WF criticisms in six categories and advances the sustainability assessment phase of the WFN framework via sefficiency. Starting from, and critically reviewing, a two-country example presented by Dennis Wichelns, we illustrate, through nine (3x3) scenarios, real possibilities of integrating WF and sefficiency. The results reveal that economic and/or WF perspectives alone are insufficient to improve water decision-making processes, not necessarily guaranteeing an increase in the performance of the full system. Consequently, policy makers should be doubly careful about, for example, WF reductions, if sefficiency also decreases.
KEYWORDS: Water footprint, virtual water trade, sefficiency (sustainable efficiency), water resources management, water policies
I
NTRODUCTIONWater-related issues will probably be under a growing global spotlight in coming decades and will intensively mark the political agenda in many countries as the effects of anthropogenic climate change and the increasing demand for food and energy resources intensify (WEF, 2018). Almost all economic activities and human development rely on the sustainability and efficiency of water resources management. Recent severe water shortages in some of the world’s largest cities and regions across different continents – including California (2011-2017), Beijing (2014), Istanbul (2014), São Paulo (2014-2015) and Cape Town (2017-2018) – significantly impacted several socioeconomic sectors (water availability for human consumption, food and energy production, irrigation, etc.), illustrating the gravity and world-wide nature of the challenge.
Sustaining a growing global population – numbering 7.5 billion people in 2017 and predicted to reach almost 10 billion by the middle of the century (PRB, 2017) – is one of the greatest water challenges of our century (Rockström et al., 2014; Berkhout, 2015). Since 1960 globally available fresh water per capita has dropped by 55%; over 40% of the global population currently lives under water scarcity conditions and 11% do not have access to clean and safe water. Furthermore, global demand for water is projected to increase by 50% in 2030, resulting in a 40% gap between water demand and availability; by 2050 an additional 2.3 billion people are expected to live in areas affected by severe water stress. Estimates indicate that the total cost of water insecurity to the global economy is nearly US$500 billion/year (Guppy and Anderson, 2017).
Because water is a rising central issue, new concepts, indicators and frameworks have emerged in the fields of water resources management and environmental sciences. The water footprint (WF) concept has become popular in recent years, mainly due to the methodology developed by the Water Footprint Network (WFN), which was published in its Water Footprint Assessment Manual (Hoekstra et al., 2011). Also, the life-cycle assessment (LCA) community has started to use the term WF to include the impact of water resources use in its framework to assess environmental impacts (ISO 14040 and ISO 14044). However, the term WF has different meanings for the two communities. The LCA community uses it as an impact metric rather than a volumetric descriptive metric, as used by the WFN. These different meanings have led to debates between the two communities, exacerbated by the recent publication of an LCA-based WF ISO standard (ISO 14046) (Hoekstra et al., 2009; Pfister and Hellweg, 2009; Hoekstra and Mekonnen, 2012; Ridoutt and Huang, 2012; Hoekstra, 2016; Pfister et al., 2017). Because the WFN methodology is a much needed water-centric approach and our emphasis is on the sustainable and efficient management of this vital resource, this paper focuses on (and if not otherwise stated, refers to) the WF concept as it is understood by the WFN.
The popularity of the WF concept and its associated supply-chain logic has been successful in drawing attention to water resources management among companies, regions, countries and the press (e.g. SABMiller and WWF-UK, 2009; Rep, 2011; TCCC, 2011; Gnehm, 2012; Henley, 2013; McWilliams, 2014; Zhang et al., 2014; Harvey, 2015). However, as we shall see later, many criticisms emerged regarding the suitability of the concept when studies based on WF calculations tried, in some way, to define water policy solutions and enhance the sustainability of water resources. Criticisms regarding WF studies essentially stem from two sides: the economic perspective, which finds no value in WF calculations in defining trade and production policies, as they fail to assess many other inputs and benefits, and a hydrological point of view, arguing that WF analyses are based on an oversimplification of the hydrological cycle and, consequently, of complex water issues. These criticisms are discussed in a recent paper by the founder of the WFN, Arjen Y. Hoekstra (2017).
We consider that these debates have been somewhat incomplete and confusing. In several cases, what should be a criticism of specific conclusions in some WF studies has become a broad criticism of the WF concept and WFN methodology. There is also a systematic confusion between descriptive and performance levels. Many criticisms ignore that a full WF assessment, as proposed by the WFN methodology, includes a sustainability assessment phase (performance level), which tries to evaluate the impact on the environmental, social and economic dimensions. Indeed, the problem is that WF studies have so far relied mainly on the accounting phase, i.e. the descriptive level (Hoekstra, 2017), which is inadequate for drawing comprehensive conclusions. Consequently, criticisms stating that WF accounting is insufficient to guide better sustainable water management strategies and policies are correct. However, the aim of the accounting phase is not to function as a prescriptive tool. Therefore, our main concern focuses on the sustainability assessment, as this phase is poorly developed in the WFN manual (Hoekstra et al., 2011; Hoekstra, 2017). It is unclear how the methodology could systematically integrate economic and social benefits. Even from an environmental and hydrological point of view, the WFN approach is incomplete and fails to address, in a comprehensive manner, all water flow paths (WFPs) of a water-use system (WUS).
We believe that the WF concept can have a positive role in dealing with global water issues, as one needs to understand how humanity’s lifestyles and consumption patterns impact the planet’s vital and limited resources. Within this context, the main objective of this article is to advance an alternative approach for the sustainability assessment phase of the WFN methodology. To this end we take the following steps:
1. Review the WF concept and confirm the crucial necessity of advancing the WFN sustainability assessment phase, i.e. the performance level (see section 'A Brief Background on WF');
2. Revisit and discuss some of the WF criticisms (see sections 'WF Criticisms Revisited' and 'Appendix A');
3. Introduce the sefficiency (sustainable efficiency) framework as an alternative solution for advancing the performance level of the WFN methodology (see sections 'Sefficiency Framework: A Summary' and 'Appendix B');
4. Provide nine (3x3) scenarios based on a two-country example (Wichelns, 2015a) to illustrate sefficiency’s appropriateness in overcoming some WF criticisms and to demonstrate that economic perspectives alone are insufficient to improve water decision-making processes in water management (see sections 'Application' and 'Conclusions').
A
BRIEF BACKGROUND ONWF
Tony Allan used the concept of virtual water (VW) for the first time in 1997, referring to water embedded in key water-intensive commodities traded in the global system, such as wheat (Allan, 1997). He used the term 'virtual' to underline that the water needed to produce a certain product was far greater than the water that the final product itself contained. Hence, importing a water-intensive product would result in hypothetical water saving equal to all the water needed to produce that product. Allan’s aim was to demonstrate that Middle East and North African (MENA) countries were able to solve water supply problems and avoid conflicts by accessing water via trade in the global system. Based on the idea of VW and inspired by the ecological footprint (EF) concept (Wackernagel and Rees, 1996), Hoekstra (2003) coined the term WF in 2002, which was later the root of the methodology developed by the WFN. The WF concept is described as the direct and indirect volume of freshwater appropriation (consumed and polluted) and can be applied to a single process step or product or to any other economic, political or geographical delimitation (companies, groups of consumers, catchments, countries, global, etc.). The volume of freshwater appropriation is "measured in terms of water volumes consumed (evaporated or incorporated into a product) and/or polluted per united of time" (Hoekstra et al., 2011: 194). For instance, the WF of a country can be described as the sum of the internal WF of national consumption (that is, the total volume of freshwater appropriation for the production of goods consumed within the country) and the external WF of national consumption (that is, the total volume of freshwater appropriation in other countries for the production of goods that are later imported and consumed within the country). The WFN’s Water Footprint Assessment Manual (Hoekstra et al., 2011) and its glossary divide the sources of water into a blue WF (i.e. the volume of surface and groundwater evaporated or incorporated into a product, as well as the volume of water abstracted that does not return to the catchment from which it was withdrawn), a green WF (i.e. the volume of the precipitation that evaporates or transpires through plants and does not run off or recharge the groundwater) and grey WF (i.e. the volume of water required to dilute pollutants and assure established water quality standards).
The VW was the starting point for the concept of WF, but it continues to be used in the WF literature. According to the WFN, the difference between the two concepts is that WF refers not only to a volume of freshwater appropriation but also makes explicit "where the water footprint is located, what source of water is used and when the water is used" (Hoekstra et al., 2011: 167). Yet some
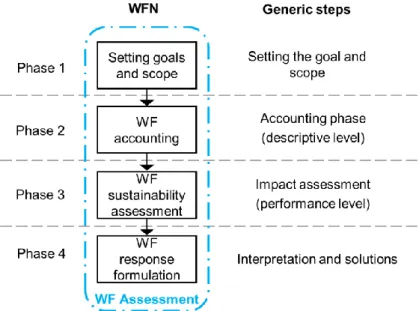
authors noted that a distinction between the two concepts "is not appropriate because they ultimately describe one and the same thing" (Gawel and Bernsen, 2011a: 224). The WFN methodology proposes a WF assessment divided into four phases (see Figure 1): setting goals and scope (phase 1), WF accounting (phase 2), WF sustainability assessment (phase 3) and WF response formulation (phase 4). WF accounting is a descriptive phase, referring to the calculation of the different WF sources (blue, green and grey), in line with the scope and aim of the study. In the WF sustainability assessment phase the WFN approach aims to evaluate "whether a certain WF is sustainable from an environmental, social, as well as an economic point of view" (Hoekstra et al., 2011: 195). However, it seems that full WF sustainable assessments still fail to be conducted because the definition lacks appropriate social and economic indicators. In addition, concerning the environmental dimension, only the blue water scarcity indicator based on water quantity is considered to be in a more advanced development stage (Vanham and Bidoglio, 2013). Thus far there has been a substantial emphasis on the accounting phase, resulting in prescribing water management solutions based on those calculations often without performing a WF sustainability assessment. This has been a core reason why so many criticisms have arisen regarding WF studies.
Figure 1. WFN framework steps. Source: adapted from Boulay et al., 2013.
WF
CRITICISMS REVISITEDCriticisms of the WF concept and its derived studies can be aggregated into a few lines of thought. Appendix A provides a compilation of several examples of these criticisms, divided into six categories, which are briefly reviewed below.
A – Water resources management and international trade strategies need more inputs than just water (see, for instance, Wichelns, 2010; Witmer and Cleij, 2012; Chenoweth et al., 2014; Perry,
2014; Wichelns, 2015a, 2015b; Jia et al., 2017)
Several authors argue that the management of water resources and international trade strategies need a wider set of inputs than simply water to be adequately implemented. These include considering comparative advantages, opportunity costs and several other impacts in diverse socioeconomic contexts (e.g. labour, livelihoods, food security). In this sense, they argue that WF accounting lacks information to enhance decision-making and to prescribe more efficient and sustainable solutions.
These arguments, although self-evident, have two flaws. First, they ignore that WF is a descriptive, rather than performance, indicator. Therefore, some studies that went too far in the use of WF indicators should be criticised, not the WF concept itself, or the WFN methodology. As we have seen, the WFN methodology clearly defines a performance level through a sustainability assessment, in which WF is intended to be economically, socially and environmentally contextualised.
Second, one should not ignore that humanity’s production and consumption patterns, lifestyles and prevailing trade and commercial practices are essentially economy-oriented, i.e. focused on economic growth, while environmental concerns and planetary boundaries are largely disregarded. It was this path that led us to the current ecological crisis (Curry, 2017). Consequently, new approaches, concepts and frameworks are needed. Complex trade-offs are involved, and no tool or framework can act as a 'silver bullet'. However, under increasing water scarcity and pollution, water should be a top priority. This is key both within and between countries prone to severe water problems, meaning that, if one looks at development from a water perspective, the alternative plans may change dramatically. On the other hand, the authors who raise this criticism, i.e. the need to be comprehensive, typically present it or give examples stemming from their own single top priority, such as economics or land. This is a general critical issue in (water) knowledge generation today: practices and examples do not follow the theories and principles employed to reject the alternative understandings.
B – A lower or higher value of WF is not meaningful (see, for instance, Witmer and Cleij, 2012;
Wichelns, 2015c)
Critics have pointed out that WF values do not reflect environmental impacts or account for beneficial aspects of water use. In this sense, a crop or product with a lower WF can be more environmentally harmful than one with a higher WF. In addition, WF reductions can result in lower socioeconomic benefits.
Once again this is mostly true because WF is a descriptive indicator of water quantity and quality, meaning that, for example, decreasing WF does not guarantee better (water) performance of the system under analysis. However, it has an intuitive meaning that raises awareness and focuses policy on water issues, hence its interesting role and vital importance. Higher or lower values of WF need to be analysed through performance indicators. When WF reductions translate into a decrease of the performance indicators, those reductions should always be questioned. In brief, performance levels make WF accounting meaningful and must be included in WF studies that seek to determine water policy choices.
In our perspective, this systematic misunderstanding of descriptive and performance levels leads critics to miss the target. Rather, they should question whether the suggested WFN sustainability assessment (phase 3 in Figure 1), i.e. the performance level, is sufficiently complete and comprehensive to analyse the economic, social and environmental impacts of a specific WF. Indeed, the WFN manual only marginally addresses socioeconomic impacts (Hoekstra et al., 2011: 87-88) and is unclear about how they can systematically integrate the output results of a full WF assessment. At the environmental level, the WFN manual proposes blue and green water scarcity indicators by comparing blue and green WFs with the availability of these water components. The water pollution level is defined by comparing grey WF with the available assimilation capacity. From a hydrological point of view, this is very limited. The methodology does not address a broader and complete set of water flow path types (WFTs) of a WUS (e.g. upstream, downstream and return flows), each with specific ecological relevance and distinct stakeholder interests that should be explicitly evaluated. In addition, water pollution is dealt with by a virtual volume of water that is not hydrologically manageable. In sum, it is hard to envisage how the WFN sustainability assessment can, at this stage of development, measure the performance of a WUS in an integrated economic, social and environmental fashion.
C – Water-related issues are essentially to be addressed locally or regionally and not globally
(see, for instance, Gawel and Bernsen, 2011b; Wichelns, 2011; Perry, 2014; Wichelns, 2015a, 2015b)
This argument can be summarised as follows: because there are regions with abundant water resources and others facing water scarcity, from an international or global perspective the resource is not scarce. It is therefore a local and regional problem, and solutions must be discussed and implemented at those levels. In this sense, WF and its supply-chain logic has no or little value in improving the sustainability of water management practices.
Those who raise this issue are generally traditional, supply-side thinkers who ignore the great influence of demand on planning and management. Production processes utilise local water (supply side) to produce industrial or agricultural goods that are exported for global consumption and use (demand side, in the form of VW). This intricate distinction between water supply and demand is significant for water management. While the impacts are intrinsically felt locally and regionally, one cannot neglect the obvious driving force of the demand side (for instance, tomatoes and bottled water produced in Portugal and shipped to France have important impacts on the water resources of the former’s river basins). Although humanity does not possess the adequate political and governance structures to manage water resources globally and sustainably, thus optimising the demand-supply chain, this should not prevent us from identifying and considering connections and interdependences among countries and regions as a means of achieving the ultimate goal of better water management within the current structures (that is, the existent political and governance regulations and guidelines at the municipal, regional, inter-regional, national and international levels). Identifying those connections and interdependences is also essential for exposing the insufficiency of the current institutions and governance mechanisms in dealing with global and highly complex issues (Dryzek, 2016), such as the sustainable management of water, while devising the future and necessary global governance structures and promoting a new way of thinking about development.
In brief, although it is obvious that we should continue to implement water solutions locally, regionally or at basin level due to their specific characteristics, it is difficult to conceive why analyses beyond the borders are irrelevant in a highly interconnected world (Hoekstra, 2017).
D – It is not possible to improve local water management by changing consumption patterns elsewhere, nor do countries save water by engaging in VW trade (see, for instance, Wichelns,
2011; Perry, 2014; Wichelns, 2015a)
Following the previous local-versus-global argument, some authors assert that unsustainable water management practices will not cease even if external demand becomes less water intensive. It is argued that water resources in those regions can continue to be used in the same way for exporting to new markets or even change water use for more environmentally harmful activities.
Understanding the comments presented in the previous criticism helps in the current argument. If a country consumes less imported meat, the exporting country produces less, which translates into less water consumption, hence, real water 'saving' occurs. A different issue altogether is the fate of the 'saved' water, which is a local/regional management issue. For example, do the laws of the exporting country allow an ad-hoc change in land use (area/crop mixture)? Does the exporting country continue to produce the same amount of meat and export to other countries? Will there be international support to promote adaptive changes in producing countries? As water scarcity increases, and economic and social spheres become visibly threatened, countries are becoming more responsible and careful regarding their (saved) water. Furthermore, as already mentioned, one should analyse water from the supply (more traditional) as well as the demand side, which involves several stakeholders, countries and regions. Such a comprehensive approach makes water a difficult subject of national and international laws and negotiations. It is worth noting, however, that despite the difficulties, WF figures
are helpful in unfolding changes needed in lifestyles and policy mechanisms, and should thus complement any analysis. Bringing demand into discussions will certainly have an increasingly positive influence on water management. Yet any proposed change will generate trade-offs and tensions among the economic, social and environmental dimensions. Consequently, an integrated management of these trade-offs and tensions is crucial "for avoiding the drift in favour of one single dimension to the detriment of the others" (Giovannoni and Fabietti, 2013: 30) and should be part of any performance assessment.
E – A division into water colours is not conceptually appropriate (see, for instance, Witmer and
Cleij, 2012; Chenoweth et al., 2014; Perry, 2014)
Criticisms of water colours arise mainly because they do not reflect the complexity of the hydrological cycle (e.g. blue water ultimately comes from green water; there can be states of water in which the colour is undetermined; and blue water makes no distinction between surface and groundwater). In relation to water pollution, it is also pointed out that the grey WF can be misleading because it does not represent real water volumes, as for the blue and green WFs.
Indeed, water colours aggregate fractions of one or more basic water quantities, including pollution. The fundamental science that describes these quantities is hydrology with well-known laws and principles. As a result, the best practice is to use hydrology for rigour, transparency and consistency. This is important because an increasing number of diverse scientific domains are studying water. Nevertheless, one can employ water colours at the accounting phase particularly if they help in communicating with the public, companies and politicians. Still, one should be cautious that the discussion and use of water colours do not divert us from our main objectives, or induce errors. Hence, the use of hydrological laws and principles and specific water quality standards in assessing the performance of a WUS is strongly recommended. However, this was not the option taken by the WFN when designing its methodology, which would have been essential to avoid these criticisms.
F – The WF concept misuses the term 'footprint' (see, for instance, Wichelns, 2011; Chenoweth et
al., 2014; Perry, 2014)
Some authors consider that the term WF is inaccurate because water does not have a 'footprint' such as carbon. The main argument is that a reduction in carbon footprint (CF) always generates a benefit regardless of when or where it occurs, whereas benefits from WF reductions are time and space dependent and may not generate any positive impact.
Treating it as a standalone statement, we should realise that the concept of ‘footprint’ itself is generic and well understood. For example, the WFN defines footprint (in concordance with a number of dictionaries) as a "measure showing the appropriation of natural resources or pressure on the environment by human beings" (Hoekstra et al., 2011: 166). This makes WF a meaningful concept regardless of scale and condition. Furthermore, the arguments supporting a misuse of the term 'footprint' are mainly focused on a comparison with CF. It is ignored that the CF concept itself is derived from the ecological footprint (EF), in which the assessment of carbon emissions is also designated as CF but with different units and objectives. For this and other reasons, some call into question whether the use of the term 'footprint' is an appropriate choice for the CF concept (van den Bergh and Grazi, 2014). The nature and attributes of different types of footprints vary depending on the focus and top priority of the core advocates of a particular footprint. However, similarities exist. For instance, in the WF, water pollution is transformed into a water volume; in EF, carbon emissions are transformed into land area units. Both footprints have found a way to aggregate the effect of pollution on the same units that water consumption and land occupation are measured. It is also ignored that many authors have questioned the usefulness of the EF concept, as a lower EF may not always be equivalent to a higher beneficial state (Fiala, 2008; van den Bergh and Grazi, 2010; Blomqvist et al., 2013; Giampietro and
Saltelli, 2014). In sum, it is not reasonable to argue that the WF concept should not use the term 'footprint' simply because it lacks properties that even the original EF does not contain.
As we have seen, the failure to conduct an effective performance assessment is a core issue that has fuelled several misunderstandings and criticisms around the WF concept (A to E criticisms; F is essentially a question of terminology). Additionally, the performance assessment proposed in the WFN methodology has its own shortcomings and has not been fully implemented thus far. As a consequence, working on an alternative solution for advancing the performance level of the WFN methodology is critically important. Here, we propose the sefficiency framework, with the following section describing its main features.
S
EFFICIENCY FRAMEWORK:
A
SUMMARYOne of the most important performance indicators for WUSs, such as farms, cities, industries and regions, is efficiency, which is easy to understand but complex to quantify (Stone, 2002). There are various efficiency concepts that many authors use with little attention to the objective validity of their expression/equation. A case in point is water productivity (WP), which is generally defined as the amount of product per unit of water consumed to produce it (Seckler et al., 2003). Some authors employ water-use efficiency (WUE) instead of WP to denote the same thing. Others utilise the inverse definition, i.e. amount of water consumed per unit of product. Several WF researchers use WP or its inverse as the performance indicator for their analyses. However, there is a growing body of literature showing that WP or WUE (and, consequently, its inverse) is a flawed indicator in the context of water reallocation decision-making and should be avoided (Wichelns, 2013, 2015c; FAO and WWC, 2015; Haie, 2016).
Therefore, we introduce 'sefficiency' (sustainable efficiency) as an innovative alternative for the conducting of performance assessments (Haie and Keller, 2012; Haie, 2016). Sefficiency is a water-centric framework aimed at the analysis of WUS policies. A summary of its main features is presented below; in Appendix B there is a more detailed description of its foundations and calculation.
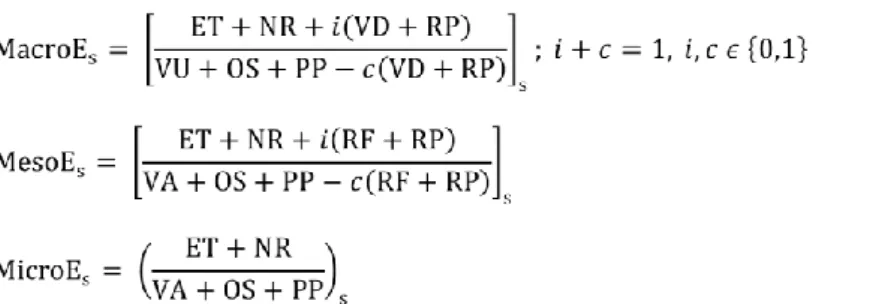
1. Water management has three pillars: water quantity, quality and benefits; however, the last two are the attributes of the first one. For water quantity, sefficiency can be applied to any WUS of any geographic area or activity because it is based on the universal law of conservation of mass, i.e. water balance. Consequently, all inflows and outflows of a WUS should be measured or estimated, without which policy-making will be prone to severe errors. For this pillar, sefficiency uses a fixed structure of nine WFTs (Figure B1; 'B' in reference to Appendix B). Moreover, there is a crucial distinction between consumptive and non-consumptive WFTs, with the former being a type of water, such as evaporation, that would not be available for reuse. 2. Sefficiency utilises two weights, namely, quality and beneficial weights for the two other pillars.
Their values vary between 0 (worst condition) and 1 (best condition) and are defined for each of the nine WFTs. The quality weight depends on the water quality measurements or estimates. The beneficial weight can integrate water values and costs from economic, environmental and social dimensions. Their product is called the 'usefulness criterion' (equation B1). For example, highly polluted water (very low value for its quality weight) or water that evaporates from reservoirs (very low value for its beneficial weight) results in useless water. In general, the usefulness criterion is the degree that a water flow is suitable in accordance with the purposes of the WUS under consideration.
3. There are three levels of performance indices in sefficiency: macro, meso and micro (equation B2). Macro links the WUS to the main water body of the basin or region. Meso and micro are in regard to the performance of the WUS itself. It is recommended to use meso because it is a more complete formulation than micro (see Appendix B).
4. Sefficiency is configured for both 'IN' and 'OUT' efficiencies. The IN sefficiency provides the percentage of the total useful input that is total useful output, and the OUT sefficiency is the percentage of total useful consumption relative to total effective consumption (equation B3). 5. Due to the comprehensive integration of inflows, outflows and their attributes into water
balance, their differentials influence the outcome of sefficiency. For example, it is not the degree of pollution of the water inflows that is of interest to the performance of a WUS but rather the combined difference of the pollution of inflows and outflows.
6. There are trade-offs between the three pillars that directly influence sefficiency due to their explicit integration into one expression. This is indeed crucial because of the non-linearity of the three pillars and their relationships.
7. Each of the nine WFTs has its own specific stakeholders with interests associated to one or more of the three pillars. The explicit and comprehensive structure of sefficiency promotes transparency and learning, and acts as a powerful enabler for stakeholder involvement.
8. Drivers, such as climate change and population, and their influences on water can be modelled by sefficiency (Ahmad et al., 2018). Climate change descriptors, such as temperature and precipitation, are explicitly present in its equations. For instance, temperature is in both evapotranspiration and non-reusable (e.g. evaporation) WFTs, and precipitation in its own WFT. This is significant because efficiency is a major factor in adapting to climate change and population increase.
A
PPLICATIONTo demonstrate the use of sefficiency within the context of the WF debate, we start from a two-country example presented by Wichelns (2015a), in which the countries engage in trade for two crops. The example consists of Country A, which is relatively water scarce (5000 ML of irrigation water available per year) with good climate and soils, and Country B, with 10,000 ML of irrigation water available per year and worse climate and soils. Country A has an average cotton crop yield of 1.5 t/ha and 3.2 t/ha for wheat, whereas Country B has an average cotton crop yield of 0.8 t/ha and 2.67 t/ha for wheat. Irrigation requirements were set equally for both countries at 10,000 m3/ha for cotton and 667 m3/ha for wheat, and output prices of $2000/t for cotton and $257/t for wheat were given. Wichelns provided this example to support the inadequacy of the WF perspective in water (re)allocation decision-making, highlighting that WF calculations did not consider the economic dimension, which includes the evaluation of opportunity costs and comparative advantages, and that more water-scarce countries should not, based only on that fact, adopt less water-intensive crops, as this may result in an economic loss.
Although the WF is a descriptive indicator requiring a performance level to be meaningful, as we have discussed, a purely economic perspective will surely be narrow in the context of sustainability, sefficiency and water (re)allocation discussions. Wichelns’s example assumes that all hypothetical 'saved' water will be fully used by the countries in any circumstance, resulting in an obvious argument that countries should then optimise their strategies to maximise the economic value. There are some issues with this example. First, it is important to note that Wichelns used volumes of irrigation water, omitting values related to crops’ evapotranspiration processes. Because it was a critique of WF, and for the sake of rigour, the example should not be focused on irrigation volumes. Second, water quality is completely ignored in the definition of the best allocation scenario. Third, even with different climates and soils, the irrigation requirements were set equally for both countries and no differentiated production costs were considered. Lastly, and as we have previously emphasised, the assumption that 'saved' water will always be used is not consistent with the necessary paradigm shift in development.
Moreover, the 'saved' water is fundamental to managing uncertainty and increasing the resilience of different WUSs as the effects of drivers such as climate change intensify, in turn safeguarding social, economic and environmental dimensions.
Before advancing in this section, three clarifications are needed: (a) Wichelns presented his example according to the assumptions listed in Table 1; (b) sefficiency is calculated from equation B21 for the meso level (the macro level is impossible to calculate because the conditions of the sources of water in the two countries are unknown, and the micro level is dismissed to underline the relevance of return flows); and (c) the remainder of this section presents three sets of results and discussions, each based on three scenarios. The configuration of the first set follows the example from Wichelns’s paper, with its assumptions included in Table 1. What follows explains in detail the 3x3 sets and scenarios; Figure 2 shows the results.
Table 1. Summary of the assumptions considered in Wichelns’s example. Assumptions
a) the domain of analysis consists exclusively of two countries (explicit) b) countries have distinct agro-climatic conditions (explicit)
c) the total amount of irrigation water can only be allocated between two crops: cotton or wheat (explicit)
d) countries could engage in trade for both crops (explicit) e) water pollution has not been addressed (explicit) f) irrigation water is equal to evapotranspiration (implicit) g) equal costs for both countries (implicit)
h) no arable land limitation is defined (implicit)
In the first set of the three allocation scenarios given by Wichelns, it is demonstrated that sefficiency can follow the presented economic logic if we narrowly assume that the beneficial weight (Wb) only integrates economic benefits. The volume abstracted/applied (VA) is set equal to evapotranspiration (ET). The non-reusable (NR) flow path could include the quantity related to the water embodied in the final goods; however, because of its low value, it is not relevant for the actual purpose. Consequently, NR and all other WFTs are set to zero to secure water balance (this results in iMeso = cMeso = Micro, derived by equations B2). Regarding water flow path (WFP) attributes, the beneficial weight (Wb) for ET integrates the economic benefit of the correspondent crop (here, calculated by dividing the output value per hectare by the maximum value obtained in the two countries for that crop; the best way to integrate economic benefits in Wb is beyond the scope of this paper); the Wb of VA is set to 1; and the quality weight (Wq) is also set to 1 for all WFPs considered because, as mentioned, Wichelns did not include a water quality dimension in his example (this results in a quantity-based sefficiency model, without the integration of water pollution). A summary of the input data for sefficiency calculation is shown in Table 2. Sefficiency results are shown in Table 3, together with the remaining data of Wichelns’s example, and in Figure 2.
1
Table 2. Meso sefficiency input data summary – first set.
Variables Country A Country B
Abstracted Water (VA)
Quantity (Cotton) 100% of irrigation requirements 100% of irrigation requirements
Wq 1.00 1.00
Wb 1.00 1.00
Quantity (Wheat) 100% of irrigation requirements 100% of irrigation requirements
Wq 1.00 1.00 Wb 1.00 1.00 Evapotranspiration (ET) Quantity (Cotton) 100% of VA 100% of VA Wq 1.00 1.00 Wb 1.00 0.53 Quantity (Wheat) 100% of VA 100% of VA Wq 1.00 1.00 Wb 1.00 0.83 All other WFTs
Quantities and Attributes
0 0
Note: Irrigation requirements vary as a function of different crop allocation scenarios, corresponding to the 'Water' column of Table 3.
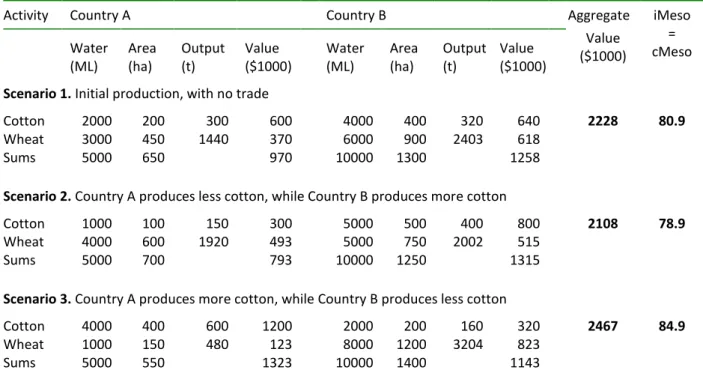
Table 3. Scenarios data with meso sefficiency values – first set. Source: adapted from Wichelns, 2015a.
Activity Country A Country B Aggregate
Value ($1000) iMeso = cMeso Water (ML) Area (ha) Output (t) Value ($1000) Water (ML) Area (ha) Output (t) Value ($1000)
Scenario 1. Initial production, with no trade
Cotton 2000 200 300 600 4000 400 320 640 2228 80.9
Wheat 3000 450 1440 370 6000 900 2403 618
Sums 5000 650 970 10000 1300 1258
Scenario 2. Country A produces less cotton, while Country B produces more cotton
Cotton 1000 100 150 300 5000 500 400 800 2108 78.9
Wheat 4000 600 1920 493 5000 750 2002 515
Sums 5000 700 793 10000 1250 1315
Scenario 3. Country A produces more cotton, while Country B produces less cotton
Cotton 4000 400 600 1200 2000 200 160 320 2467 84.9
Wheat 1000 150 480 123 8000 1200 3204 823
Sums 5000 550 1323 10000 1400 1143
Sefficiency leads us to similar conclusions to those reached by Wichelns. Barring water quality and non-economic benefits, assuming VA = ET, and omitting other WFTs resulted in higher sefficiency values for scenario 3 (iMeso = cMeso = 84.9) and the lowest values for scenario 2 (iMeso = cMeso = 78.9), emphasising that, in this specific context, performance indices vary according to the economic benefits
(it should be noted that, as applied water is the same in all scenarios and equal to ET, the blue + green WF is constant, not allowing any kind of evaluation).
Despite these results one cannot neglect the relevance and importance that water quality, non-economic benefits and the evaluation of a complete set of WFTs (Figure B1) should have in this type of assessment. Hence, making some scientifically based changes to the previous assumptions, we recalculate sefficiency for a second set of the three allocation scenarios to demonstrate how a more integrative approach can lead to important changes in the ranking of our scenarios. In this sense, and not invalidating what Wichelns calls good climate and soils of Country A and worse climate and soils of Country B, some modifications are made in sefficiency variables to make scenarios more hydrologically accurate and complete, by accounting for precipitation (PP), returns (RF+RP) and NR. Higher values of ET and higher use of pesticides in Country A (affecting Wq) are assumed, with particular relevance to cotton crops (Fernandez-Cornejo et al., 2014), as the reasons for higher yields. Higher values of VA for Country B in some way represent a worse climate, with less ability to take advantage of rainwater for growing crops and higher returns and run-off relate to worse infiltration soils and poor irrigation management. The sum of VA and PP is set equal to the defined 5000 ML/year of water availability for Country A and 10,000 ML/year for Country B. The Wb for ET is set higher for Country A, considering more advanced management with both lower non-beneficial ET and energy consumption (associated with VA needs). Finally, differentiated costs for both countries and crops are set to make the aggregate economic benefit constant in the three allocation scenarios, highlighting the importance of an analysis that goes beyond the economic dimension. All sefficiency input data considered for the second set of scenarios are shown in Table 4 and the results in Figure 2. Other assumptions could be equally valid in describing scenarios that fall within what was described by Wichelns, but our logical settings are sufficient for the purposes of this paper.
The results obtained reveal that the highest meso sefficiency values are now associated with scenario 2 (iMeso = 60.9; cMeso = 40.9); surprisingly, scenario 3, which was previously considered the best allocation scenario, is now the worst (iMeso = 55.3; cMeso = 35.6). Considering the particular conditions chosen for this second set of scenarios, sefficiency ranks the scenario with the lower blue + green WF higher. Nevertheless, real water decision-making processes involve a broader set of variables and stakeholders that tend to indicate sefficiency behaviour that is out of line with the conclusions obtained by aggregate economic benefits or stand-alone blue + green WF accounting.
For instance, we calculate a third set of scenarios by changing the following: Country A wheat crop ET to 35% of (VA + PP), Country B ET cotton crop to 45% of (VA + PP) and Country B ET wheat crop to 30% of (VA + PP) – proposing that yield differences in cotton production have more to do with a large non-beneficial ET in Country B. We also evaluate the NR flow path with a lower Wb (0.30) for Country B related with a non-beneficial deep percolation and spills to salt sinks, and a higher Wb in Country A (0.60), in which deep percolation is more useful for salt control (leaching), whereby new meso sefficiency values are computed. One can observe (third set of scenarios in Figure 2) that the lowest blue + green WF scenario (8200 ML/year) now becomes associated with the lowest meso sefficiency values (iMeso = 46.9; cMeso = 22.6), and the highest blue + green WF scenario (8350 ML/year) corresponds to the highest meso sefficiency values (iMeso = 49.5; cMeso = 25.3), thus trade-offs should be carefully and transparently investigated, particularly with the input of stakeholders. Lastly, it should be noted that we did not add a grey WF to the blue + green WF because it was not essential for the arguments of the paper.
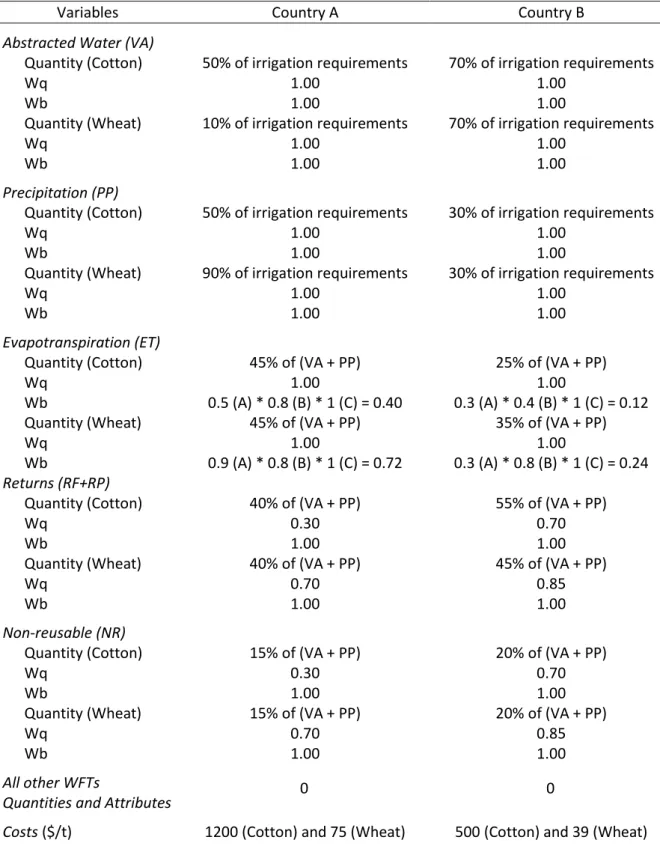
Table 4. Meso sefficiency input data summary – second set.
Variables Country A Country B
Abstracted Water (VA)
Quantity (Cotton) 50% of irrigation requirements 70% of irrigation requirements
Wq 1.00 1.00
Wb 1.00 1.00
Quantity (Wheat) 10% of irrigation requirements 70% of irrigation requirements
Wq 1.00 1.00
Wb 1.00 1.00
Precipitation (PP)
Quantity (Cotton) 50% of irrigation requirements 30% of irrigation requirements
Wq 1.00 1.00
Wb 1.00 1.00
Quantity (Wheat) 90% of irrigation requirements 30% of irrigation requirements
Wq 1.00 1.00
Wb 1.00 1.00
Evapotranspiration (ET)
Quantity (Cotton) 45% of (VA + PP) 25% of (VA + PP)
Wq 1.00 1.00
Wb 0.5 (A) * 0.8 (B) * 1 (C) = 0.40 0.3 (A) * 0.4 (B) * 1 (C) = 0.12
Quantity (Wheat) 45% of (VA + PP) 35% of (VA + PP)
Wq 1.00 1.00
Wb 0.9 (A) * 0.8 (B) * 1 (C) = 0.72 0.3 (A) * 0.8 (B) * 1 (C) = 0.24 Returns (RF+RP)
Quantity (Cotton) 40% of (VA + PP) 55% of (VA + PP)
Wq 0.30 0.70
Wb 1.00 1.00
Quantity (Wheat) 40% of (VA + PP) 45% of (VA + PP)
Wq 0.70 0.85
Wb 1.00 1.00
Non-reusable (NR)
Quantity (Cotton) 15% of (VA + PP) 20% of (VA + PP)
Wq 0.30 0.70
Wb 1.00 1.00
Quantity (Wheat) 15% of (VA + PP) 20% of (VA + PP)
Wq 0.70 0.85
Wb 1.00 1.00
All other WFTs
Quantities and Attributes 0 0
Costs ($/t) 1200 (Cotton) and 75 (Wheat) 500 (Cotton) and 39 (Wheat)
Note: (A) factor related to energy consumption; (B) factor related to non-beneficial ET; and (C) factor related to economic value (Freitas, 2017).
Figure 2. Meso sefficiency values, blue + green WF and economic benefits for the three sets of scenarios.
C
ONCLUSIONSIn recent years research based on WF calculations has emerged in many studies, ranging from product to catchment, municipal, national and global assessments. Although WF accounting has advanced substantially, the full WF assessment proposed by the WFN, which includes a sustainability assessment, has lagged behind. This weakens the validity of the conclusions drawn from WF accounting and assessments. WF reductions are useful to enhance the resilience and help deal with the uncertainty of different WUSs, but these reductions should always be accompanied by a performance assessment, paying special attention if such reductions imply a decrease in performance indices of the full WUS.
In analysing the application of sefficiency and combining it with the previous discussion of WF criticisms, the following virtues of integrating sefficiency emerge:
1. Sefficiency can contextualise WF by integrating a broader set of environmental and socioeconomic inputs, thus responding to the criticisms of a lack of information in WF calculations to guide more sustainable and efficient policy choices. Nevertheless, as already mentioned, WF is intended to be a descriptive indicator; the features that the criticisms point to as lacking must be provided by a proper performance assessment, here conducted by sefficiency (in reference to criticisms A and B).
2. Criticisms regarding the need for more inputs are usually demonstrated by showing that smaller WFs can result in losses for a given top priority, such as economic value. Critics ignore that, in the realm of sustainability, complex trade-offs are involved and one cannot support choices only through optimising the economic value alone or by focusing on any one part of the system. No solutions are advanced by those authors to manage the complexity and trade-offs. Focusing on economic benefits or on one or two water flows (despite their centrality, such as ET in agriculture) can lead to wrong options in water management and design. The application example has shown that sefficiency can analyse the performance of a WUS beyond WF and/or economic benefits, providing valuable information (in reference to criticisms A and B).
3. Sefficiency is suitable for application from farm to global assessments through both water supply and (virtual) water demand. This flexibility allows it to assess performance at traditional management scales (e.g. river basins), as well as national, international and global levels. As discussed, although traditional management scales remain important, understanding what happens beyond them should not be disregarded. Improving our knowledge on demand patterns and impacts among different localities is key in a globalised world, in which the pressure on water resources is increasing rapidly, thus calling for enhanced international cooperation and innovative global governance mechanisms (in reference to criticisms C and D).
4. Sefficiency uses a complete set of basic WFTs based on hydrological laws and principles. This enhances scientific rigour and facilitates the sharing and comparison of data and results between different scientific domains studying water. In relation to water quality, sefficiency uses a water quality weight that can be computed through established water quality standards (e.g. using the Canadian Water Quality Index 2.0, normalised into a 0-1 scale, see CCME, 2017) and applied independently to each WFT. These features make it possible to conduct a performance assessment that overcomes the criticisms the WF concept has received regarding the division into water colours (in reference to criticism E).
It is worth noting that full sefficiency assessments should include a sensitivity analysis and scenario development, integrating important drivers such as climate change and population, preferably with flexible and adaptive solutions. Moreover, requiring the disclosure of the three pillars (i.e. quantity, quality and value) of all WFTs, each linked to at least one stakeholder, crucially enables their involvement. Embracing new paradigms that promote truly sustainable development paths is key to overcoming the greatest global environmental challenges facing humanity. In a world interconnected as never before, in which phenomena are the result of a variety of causal structures, mechanisms, processes and fields, sustainably managing our common water resources requires an understanding of the role played by demand, which reveals the need for profound levels of global cooperation. Unprecedented human interventions in the earth system may lead us to cross vital planetary boundaries, such as freshwater use (Steffen et al., 2015). This also underlines the lack of collective mechanisms of environmental governance and shows that the main driver of international politics is still narrow national interest and the sovereign features of nations (Pereira, 2017). It is therefore essential to provide political institutions with the appropriate tools and resources for dealing with unstructured, long-term and non-linear issues, such as water-related problems (Bostrom, 2013). An honest and transparent integration of the economic, social and environmental dimensions is necessary to conserve our common water resources, and this is the ultimate goal of sefficiency. Fully understanding water as a top priority in development, and that all dimensions of sustainability are linked and affect each other, is fundamental.
Finally, further research is needed to enhance the applicability of sefficiency with WF. Of central importance is the definition of common guidelines and best practices for water valuation (Wb attribute) with the integration of economic, social and environmental dimensions, which is an objective of the UN High Level Panel on Water (HLPW, 2017).
A
CKNOWLEDGEMENTSThis work was partially financed by the Portuguese Foundation for Science and Technology (FCT) under the contract UID/ECI/04047/2013 for the Centre of Territory, Environment and Construction (CTAC) of the University of Minho. We would like to extend our appreciation to the editors of the journal and the two anonymous reviewers.
A
PPENDIXA:
C
OMPILATION OFWF
CRITICISMS Criticisms on WF and VW References A – Water resources management and international trade strategies need more inputs than just water"virtual water perspective does not consider opportunity costs" (Wichelns, 2010: 2206)
"policy makers must consider implications for labor, livelihoods, food security, the environment, and other public issues that are not reflected in virtual water calculations" (Wichelns, 2010: 2218) "the water footprint indicator hardly reflects environmental impacts, or resource use efficiency or sustainability of water use, and is not suitable to be used for setting goals, defining problems, developing strategies or monitoring in the context of sustainability policies" (Witmer and Cleij, 2012: 33)
"much more hydrological modelling precision and socio-economic information is required for formulating (…) policies, which are currently lacking in water footprint assessments" (Chenoweth et al., 2014: 2337)
"for real decision making and policy at the regional and local levels, water footprints have limited use because too much critical information, like the opportunity cost of different water resources, their spatial and temporal dimensions, and the wider socio-economic and environmental context, are currently missing from most applications and assessments" (Chenoweth et al., 2014: 2337) "taken alone, water footprints are not sufficient indicators for selecting policy options" (Perry, 2014: 124)
"water footprints (…) fall short as an analytical construct because they lack sufficient information to support policy analysis or to motivate wise decisions by consumers and firms (…) as virtual water is silent on the issue of opportunity costs, water footprints neglect information describing water scarcity conditions, implications for livelihoods, and the beneficial aspects of water use in any setting" (Wichelns, 2015a: 282)
"international trade should not be modified to reflect virtual water or water footprints" (Wichelns, 2015a: 278)
"sustainability is a complex idea that involves resilience, adaptability, and learning (…) notions of virtual water and water footprints contain too little information to support such analysis" (Wichelns, 2015b: 409)
"efficiency requires that the incremental gains are equated with incremental costs. Water footprints represent the average amount of water per unit of output, and thus are not suitable for determining an efficient water allocation" (Wichelns, 2015b: 410)
"meaningful assessments require the application of legitimate analytical frameworks involving a wide range of perspectives from the social and physical sciences, with due consideration of dynamics, uncertainty, and the impacts of policy choices on livelihoods and natural resources" (Wichelns, 2015b: 410)
"the mistake in the theoretical basis of virtual water trade is to assume that water resources allocation may be optimized considering water as the sole production factor (…) the conditions for optimal multi-factor allocation are much broader and more demanding than the unrealistic assumption of water alone" (Jia et al., 2017: 346)
B – A lower or higher value of WF is not meaningful
"a crop may have a large virtual water content but little environmental impact" (Witmer and Cleij, 2012: 10)
"larger estimates of water productivity are not necessarily better than smaller estimates, and smaller water footprints are not necessarily better than larger ones (…) indeed, in may settings,
efforts to increase water productivity or reduce water footprint will result in smaller net benefits for farmers and society" (Wichelns, 2015c: 1060)
C – Water-related issues are essentially to be addressed locally or regionally and not globally
"water scarcity generally is a local and regional problem, not an international one" (Wichelns, 2011: 638)
"it is not helpful to characterize water scarcity as a global problem to be addressed through virtual water trade" (Wichelns, 2011: 638)
"a virtual water tax would not affect local water management and pricing practices, which are ultimately at the root of the problem. It is often completely distinct policy fields such as global disparities of income, power relations in the world trade regime, or even geopolitical issues that are interrelated with the problems of local water management" (Gawel and Bernsen, 2011b: 166) "problems of water and trade have to be addressed in their own specific arena, which are world trade politics on the one hand, and locally or regionally sustainable water management practices on the other. The virtual water concept then rather resembles a glass bead game, and apart from not being able to offer any practical advice for water governance, it might even lead to highly misleading conclusions" (Gawel and Bernsen, 2011b: 166)
"we do not need water footprints to discover where water is poorly managed or where the environment is threatened by excessive water use. Such situations are observed and resolved locally, through the introduction of adequate water governance" (Perry, 2014: 124)
"the characterization of water scarcity and water quality as global phenomena is compelling, but inaccurate (…) generally there is little relationship between water consumption in one region and water scarcity or water quality in another" (Wichelns, 2015a: 281)
"given the large differences in the inherent availability of water, and in opportunity costs and scarcity values, it is not meaningful to consider a 'global average water footprint' that might serve as a benchmark for evaluating water allocation decisions (…) decisions must be made locally, within regions, and with due consideration of local and regional scarcity values" (Wichelns, 2015b: 406)
D – It is not possible to improve local water management by changing consumption patterns elsewhere, nor do countries save water by engaging in VW trade
"countries do not save water by importing water-intensive crops, nor do they lose water when exporting agricultural products (…) in many cases, importers (…) do not have sufficient water to produce the food and feed they consume each year (…) they do not save water (…) as they cannot save something they do not have in the first place" (Wichelns, 2011: 636)
"a general reduction in demand for a water-intense commodity carries no guarantee that the smaller demand for water will manifest itself in an area where water consumption is excessive" (Perry, 2014: 124)
"there is no conceptual foundation to support the perspective that consumers in one country are responsible for environmental harm in another (…) the responsibility for protection and wise use of natural resources usually is ascribed to state and national governments" (Wichelns, 2015a: 281) "countries do not save water by engaging in virtual water trade" (Wichelns, 2015a: 278)
E – A division into water colours is not conceptually appropriate
"the WFN water footprint indicator contains an inconsistent set of incomparable components. The blue and green water components are resource-use indicators that do not reflect the impacts of water use, while the grey water component is an environmental impact indicator" (Witmer and Cleij, 2012: 12)
"blue and green water components represent incomparable types of water uses which cannot simply be added together; blue water use represents a direct human intervention in the hydrological cycle, while green water use represents water uptake by crops that may not differ significantly from the uptake by natural vegetation" (Witmer and Cleij, 2012: 12)
separate, distinct, and independent sources of water, whereas they are interdependent components of the same hydrological system" (Perry, 2014: 124)
"all aspects of the hydrologic cycle are linked, and (…) interventions in river basins and aquifers at one location will have impacts elsewhere. (…) water footprint analysis (…) is a dis-integrated approach that reflects an over-simplification of complex issues" (Perry, 2014: 124)
"blue water footprints need to be distinguished between surface and groundwater resources, as the potential impacts associated with the use of each blue water source can vary considerably at the local scale" (Chenoweth et al., 2014: 2337)
F – The WF concept misuses the term "footprint"
"water footprints are not analogous to carbon or ecological footprints" (Wichelns, 2011: 638) "water footprints are (…) fundamentally different to carbon footprints" (Chenoweth et al., 2014: 2336-2337)
"water footprints are conceptually different to carbon footprints. Carbon entering the atmosphere causes harm, no matter where it is generated. By contrast, water consumption does not matter globally, but may be of concern locally" (Perry, 2014: 124)
A
PPENDIXB:
S
EFFICIENCYF
RAMEWORKThe sefficiency (sustainable efficiency) framework and its logical proof was originally introduced by Haie and Keller (2012) under the designation 3ME (macro-, meso- and micro-efficiencies), in reference to the three levels of composite water efficiency indicators. It is a relatively new and complex methodology to be evaluated under different conditions and water-use systems (WUSs), such as farms, cities, industries and watersheds. Sefficiency advances an analysis based on a universal law, promoting a complete framework in the examination of/for WUS policies, which can engage decision-makers and stakeholders in properly understanding alternatives and solutions in water management and design. Sefficiency applications were demonstrated in the agriculture sector, in the context of water-energy-food entangled systems, and at the urban level.
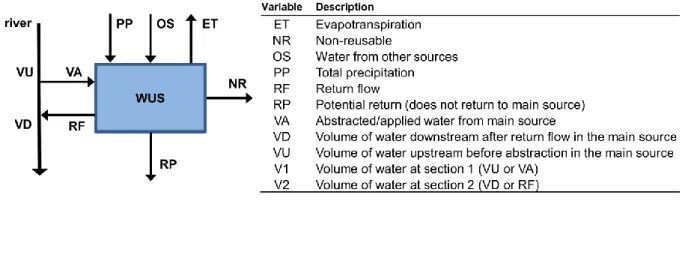
The sefficiency formulation is based on nine water flow path types (WFTs), as presented in Figure B1 (Haie 2016). Each WFT can have more than one instance, called a water flow path (WFP).2
Figure B1. Typical diagram for a water-use system (WUS) and water flow path type (WFT) definitions.
2
Readers should be careful not to confuse the “WF” letters in WFP and WFT with the standalone WF, which is the abbreviation for water footprint.
Designating X an instance of any of the types mentioned in Figure B1, the useful dimension of a WFP X (Xs) is derived using two weights (a beneficial weight and quality weight) as follows:
(B1)
where WbX is the beneficial weight of the WFP X; WqX is the quality weight of the WFP X; and WsX is the resulting usefulness weight of the WFP X. The minimum value for all weights is 0 (worst condition) and the maximum is 1 (representing the best condition).
In considering the three levels of analysis, the sefficiency indicators are calculated using equations (B2), where subscript 's' represents the usefulness weight applied to all variables within the brackets (e.g. ETs = WsET * ET). The two indices 'i' (inflow models) and 'c' (consumptive models) are related to two
water totals: useful inflow ('UI', as presented in Table B1) and effective consumption ('EC', as presented in Table B1). Each index is either 0 or 1, with their sum equal to 1, depicting IN and OUT efficiencies. A quantity-based sefficiency analysis is possible by setting all water quality weights to 1, i.e. not considering water pollution. Due to the vital importance and complexity that water quality brings to water management, a full sefficiency model (integrating both quality and beneficial pillars) is always preferable and highly recommended.
(B2)
Combining the WFTs of Figure B1 with the usefulness weight, it is possible to obtain the terminology presented in Table B1, and with it a condensed form of sefficiency equation (B3) (Haie, 2016). As such, the definition of sefficiency is the ratio of useful outflow to useful inflow (for IN or 'i' sefficiency), or the ratio of useful consumption to effective consumption (for OUT or 'c' sefficiency). It is, again, of great importance to realise the necessity of integrating pollution (Wq) and water value (Wb) in the definition and, consequently, the same expression of calculating IN/OUT water efficiencies.
Table B1. Combining basic water flow path types and applying a usefulness criterion. Source: Haie, 2016.
Symbol Expression Description
I V1 + OS + PP Inflow R V2 + RP Return C ET + NR Consumption O C + R Outflow UI Is Useful inflow UR Rs Useful return UC Cs Useful consumption UO Os Useful outflow EC (I – R)s Effective consumption
(B3)
For instance, iEs (i=1; c=0) is the percentage of total useful inflow that is useful outflow (an inflow sefficiency indicator) and cEs (i=0; c=1) is the percentage of effective consumption that is useful consumption. Therefore, iEs is always higher than cEs.
Water quantities (WFPs) are mostly based on measured data and must obey water balance for any selected WUS. Water quality weights (WqX values) are also mostly based on measured data and integrate into sefficiency the impact of the difference between the pollutions of the inflow and outflow paths. Sefficiency beneficial weight (WbX) is an innovative, explicit and transparent way of integrating water value into decision-making processes. According to the UN High Level Panel on Water, valuing water is an essential step in water decision-making processes, contributing to "better trade-offs that optimize the combined social and cultural, environmental and economic values of water to societies" (HLPW, 2017: 2). It should be noted that, currently, decision makers use mostly implicit water values in choosing a specific alternative linked to a particular WFP. However, sefficiency makes WbX values and their integrated influence transparent for the various stakeholders linked to the WFTs. For example, there are stakeholders with a focus and interest in the sources of water (e.g. rivers) and, consequently, to VA, RF, VU and VD. Farmers’ interests are commonly in VA and ET, which is proportional to the amount of production in a mostly linear fashion. For the crucial reason of transparency and complete stakeholder involvement, the sefficiency framework requires that all WFTs are presented and defined in all pillars (quantity, quality and beneficial), regardless of the WUS under analysis. Finally, it is beyond the scope of this paper to explain the procedures and methods for setting these weights. However, both quantitative (e.g. using basic laws with measurements) and qualitative (e.g. using questionnaires) processes are needed in a learning environment with effective stakeholder involvement.
The use of sefficiency as a standalone assessment for water management and design or as an alternative to the Water Footprint Network (WFN) sustainability assessment should follow a certain step sequence (see Figure B2).
Figure B2. Sefficiency framework steps (WUS: water-use system; WFTs: water flow path types; WFPAs: beneficial and quality water flow path attributes). Source: adapted from Haie, 2016.
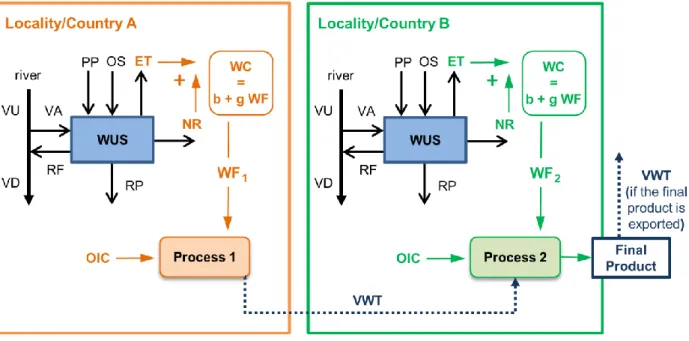
In linking sefficiency with the water footprint (WF), it is worth noting that a blue + green WF corresponds to the sum of the water quantities ET and NR. This is referred to as 'consumption' (C in Table B1; for an in-depth discussion, refer to Haie and Keller, 2014), which is defined as the portion of the total outflow from a WUS (such as an agricultural area, an urban zone, an industry or a region) that does not return to the water basin for further reuse. It should also be noted that, by analysing examples of blue + green WF calculations of a crop (Jin et al., 2016; Hoekstra, 2017: 141), it is clear that only the crop ET (ETc) is accounted for and not the total ET from the field in which the crop is planted. Regarding water pollution, sefficiency uses a quality weight (Wq) rather than a grey WF. However, volumes of grey water could be normalised to be used in the Wq variable. Lastly, Figure B3 presents a typical integrated schematic of sefficiency framework (Figure B1), WF, virtual water trade (VWT) and water consumption (or C in Table B1).
Figure B3. Schematic of sefficiency, water footprint and trade (b+g WF: blue + green water footprint; VWT: virtual water trade; WC: water consumption; OIC: other input consumption; all other variables in Figure B1).
R
EFERENCESAhmad, M.T.; Haie, N.; Yen, H. and Tuqan, N. 2018. Sefficiency of a water use system: The case of Kano River irrigation project, Nigeria. International Journal of Civil Engineering 16(8): 929-939.
Allan, T. 1997. Virtual water: A long term solution for water short Middle Eastern economies? In Proceedings of the 1997 British Association Festival of Science. Leeds, England, 9 September 1997.
Berkhout, F. 2015. Anthropocene futures and water scarcity. Proceedings of the International Association of
Hydrological Sciences, 366: 31-33.
Blomqvist, L.; Brook, B. W.; Ellis, E.C.; Kareiva, P.M.; Nordhaus, T. and Shellenberger, M. 2013. Does the shoe fit? Real versus imagined ecological footprints. Plos Biology 11(11): e1001700.
Bostrom, N. 2013. Existential risk prevention as global priority. Global Policy 4(1): 15-31.
Boulay, A.M.; Hoekstra, A.Y. and Vionnet, S. 2013. Complementarities of water-focused life cycle assessment and water footprint assessment. Environmental Science & Technology 47(21): 11926-11927.