Universidade de Lisboa Faculdade de Medicina de Lisboa
PLCE1 rs2274223 A>G Polymorphism and its Functional
Role in Colorectal Cancer
António Manuel Marujo Palma
Orientadores:
Doutora Marta Sofia Alves Martins
Prof. Doutor Luís António Marquês da Costa
Dissertação especialmente elaborada para obtenção do grau de Mestre em
Oncobiologia
Universidade de Lisboa Faculdade de Medicina de Lisboa
PLCE1 rs2274223 A>G Polymorphism and its Functional
Role in Colorectal Cancer
António Manuel Marujo Palma
Dissertação especialmente elaborada para obtenção do grau de Mestre
em Oncobiologia
2019
Orientadores:
Doutora Marta Sofia Alves Martins
Prof. Doutor Luís António Marquês da Costa
Todas as afirmações efetuadas no presente documento são da exclusiva responsabilidade do seu autor, não cabendo qualquer responsabilidade à Faculdade de Medicina de Lisboa pelos conteúdos nele apresentados.
A impressão desta dissertação foi aprovada pelo Conselho Científico da
Faculdade de Medicina de Lisboa em reunião de 16 de Abril de 2019.
i
Agradecimentos
Quero dedicar este trabalho ao meu tio António pela força e coragem que tem tido a lutar contra esta doença e por essa razão tornou-se num exemplo para eu nunca desistir de atingir os meus objetivos.
Quero ainda dedicar este trabalho à minha avó Dolores por todos os ensinamentos, pelo carinho e pelo amor que me deu. Infelizmente não conseguiu presenciar o seu neto a finalizar mais uma importante etapa na sua vida. Seja onde for, eu sei que estás comigo e nunca me vou esquecer de ti.
Não teria sido possível chegar até aqui e terminar este trabalho sem o apoio incondicional de pessoas a quem eu quero expressar o meu mais sincero agradecimento.
Quero agradecer em primeiro lugar à minha orientadora, Dra. Marta Martins por ter confiado em mim para realizar este trabalho, por todo o apoio, ensinamentos e amizade que me deu. Quero agradecer, ao professor Luís Costa por me ter acolhido no seu laboratório como estudante de mestrado e por todos os conselhos e conhecimentos transmitidos durante este ano.
Quero agradecer a todos os meus colegas do Luís Costa Lab pela ajuda, companhia e diversão que me proporcionaram e que fizeram com que fosse muito mais fácil percorrer este caminho. Quero agradecer à Sandra pelos conselhos e ensinamentos, à Daniela, por ter sido desde o início a minha colega de bancada e todas as conversas, discussões e trabalhos que fizemos juntos não podiam ser esquecidos. Raquel, obrigado por toda a paciência que tiveste comigo. Obrigado pela ajuda, pelos conselhos e pela amizade que quero manter para sempre.
Não posso esquecer também a Inês, a Patrícia Corredeira, a Patrícia Alves e a Catarina pela ajuda e pela amizade.
Quero agradecer à Dr. Catarina Abreu pela ajuda que me deu a conseguir toda a informação clínica necessária e ao Dr. Arlindo Ferreira por todos os conselhos e pela ajuda que me deu na análise estatística.
Um agradecimento especial a todo o pessoal do Sérgio Dias Lab, com eles partilhei o espaço, mas também muitos momentos de diversão, muita amizade e muitos conhecimentos.
O meu maior agradecimento à minha família, em particular aos meus pais.
Foram eles que me incentivaram a realizar este mestrado. Nada é suficiente para agradecer todos os sacrifícios que eles passaram para tornar este momento possível, obrigado pelo apoio e palavras de motivação que me deram a todo o momento, especialmente nas horas mais difíceis. Obrigado por me ajudarem a definir o caminho.
Abstract
Colorectal cancer (CRC) is one of the cancers with highest incidence and mortality in the world. In order to decrease these numbers earlier diagnosis, better treatments and better surveillance is required.
In this context, cancer biomarkers arise as important tools useful for diagnosis, monitoring disease progression, predicting disease recurrence and therapeutic treatment efficacy. Therefore, it is necessary to find new CRC biomarkers highly sensitive and specific to help clinical decisions.
In the last decade, Phospholipase C epsilon (PLCε) has been studied as a possible biomarker for CRC, particularly its single nucleotide polymorphism (SNP) rs2274223 has been associated with the risk of CRC development.
In our study, we aimed, not only, to assess the risk of PLCE1 SNP rs2274223 in CRC development in a Portuguese population, but also, analyse how this polymorphism affected patient’s survival. Furthermore, we also investigated how this polymorphism influenced cellular processes such as proliferation, epithelial-to-mesenchymal transition (EMT), angiogenesis and inflammation.
Overall, our results show that PLCE1 SNP rs2274223 A>G is not associated with the risk of developing CRC. Furthermore, this polymorphism was not shown to be involved in CRC survival of stages I-III and IV patients.
Moreover, we could not associate this phenotype with any abnormal cellular process. In sum, we found by several means that PLCE1 SNP rs2274223 A>G appears to have no role on CRC development and progression. Our findings are contrary to most of the published reports about this SNP.
iii
Resumo
O cancro colorretal é o quarto cancro mais diagnosticado e o terceiro com maior mortalidade no mundo, sendo que em Portugal é o terceiro mais diagnosticado e o segundo com maior mortalidade.
De forma a diminuir a mortalidade associada a esta doença é necessário diagnosticar a mesma em estadios iniciais, desenvolver melhores terapêuticas e ainda melhorar o acompanhamento da doença. É neste sentido, que os biomarcadores podem desempenhar um papel importante.
Por essa razão, é necessário descobrir novos biomarcadores para cancro colorretal com maior sensibilidade e especificidade de forma a complementar e melhorar as decisões clínicas e terapêuticas para o doente.
As fosfolipases C (PLCs) são potenciais biomarcadores que se encontram expressos em todas as células do organismo e que participam em variadas funções celulares como proliferação, motilidade, invasão e diferenciação.
A principal função das PLCs é hidrolisar fosfatidilinositol 4,5-bisfosfato (PIP2) existente na
membrana celular dando origem a diacilglicerol (DAG) e inositol 1,4,5-trisfosfato (IP3). O IP3 é
importante na regulação dos níveis de cálcio intracelular, enquanto que o DAG é capaz de ativar a proteína quinase C (PKC) e as suas vias a jusante.
Existem 6 famílias de PLCs (PLCβ, PLCγ, PLCδ, PLCη, PLCζ e PLCε), todas elas partilham domínios catalíticos comuns, no entanto, também apresentam domínios, estruturas e mecanismos de regulação específicos.
A PLCε tem expressão ubíqua em todos os tecidos, apesar da sua maior expressão se verificar no coração, pulmão e colon. Esta enzima apresenta domínios específicos como o domínio CDC25 na porção N-terminal e dois domínios de associação a RAS (RA1 e RA2) na porção C-terminal.
O domínio CDC25 foi demonstrado como tendo função de troca de guaninas, portanto ativador da proteína RAP1, enquanto os domínios de associação ao RAS, em particular o domínio RA2, são importantes para a translocação da enzima do citoplasma para a membrana plasmática, onde exerce a sua função.
Modelos animais transgénicos provaram que a depleção de PLCε pode levar ao desenvolvimento de hipertrofia cardíaca e ainda síndrome nefrótico.
Esta enzima também já foi associada à inflamação da pele, à neuro-inflamação e ao cancro.
No entanto, o papel desta PLC no cancro é controverso. Se por um lado foi documentado que em alguns cancros, como por exemplo do esófago, a PLCε exerce um papel oncogénico, noutros, como é o caso do cancro colorretal, a PLCε parece apresentar uma função supressora de tumor.
Nos últimos anos, têm sido vários os estudos que associam a PLCε a cancro colorretal, em particular o seu polimorfismo rs2274223 tem sido associado com um risco aumentado de desenvolver esta doença.
Este polimorfismo consiste na substituição de um nucleótido de adenina por uma guanina no gene PLCE1, que posteriormente se traduz na substituição de um aminoácido de histidina por um de arginina na posição 1927 da enzima, no seu domínio de ligação ao cálcio (C2).
Este polimorfismo foi sobretudo associado a um aumento do risco de desenvolver cancro esofágico e gástrico.
No entanto, em cancro colorretal, a sua função é controversa. Enquanto que foi possível associar este polimorfismo ao desenvolvimento de cancro colorretal na população chinesa e na população turca, o mesmo já não foi possível observar numa população lituana e letã.
No nosso estudo propusemo-nos a verificar se existe alguma associação entre o polimorfismo rs2274223 do gene PLCE1 e o desenvolvimento de cancro colorretal, na população portuguesa. Para além disso, fomos ainda verificar, pela primeira vez, se este polimorfismo poderia ter algum impacto na sobrevida dos doentes com cancro colorretal em estadios I-III e em estadio IV.
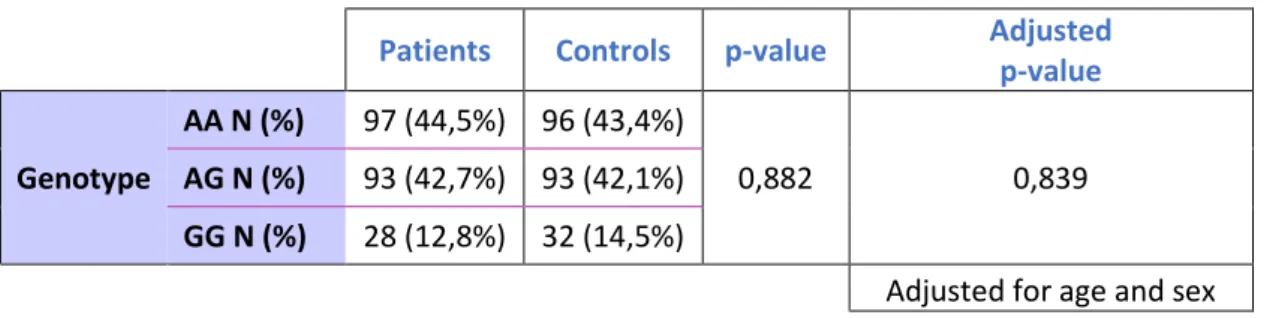
Após a genotipagem de 218 pacientes com cancro colorretal e 221 respetivos controlos (equiparados para idade e sexo), os nossos resultados mostram que este polimorfismo não se associa com um maior risco de desenvolver cancro colorretal em nenhuma das diferentes associações que testámos (AA vs. AG p=1, AA vs. GG p=0,66, AA vs. AG+GG p=0,85, GG vs. AG p=0,66 e GG vs. AA+AG p=0,68). Apesar de negativo, este resultado vem corroborar os resultados dos trabalhos desenvolvidos em populações do norte da europa (lituana e letã), os quais também não encontravam correlação deste polimorfismo com o desenvolvimento desta doença.
Estes resultados podem ser explicados pelo facto de inicialmente este polimorfismo ser associado ao risco de desenvolver cancro gástrico e esofágico, podendo a PLCε apresentar um papel diferente em CRC. Além disso, a maioria dos estudos foi realizado na população chinesa, sendo que, existem estudos na população europeia que indicam que este polimorfismo não está associado com o risco de desenvolver CRC.
v
Uma das explicações para esta disparidade de resultados em populações diferentes pode ser a existência de um menor Linkage Disequilibrium (LD) na população europeia. Desta forma, este polimorfismo não seria o responsável pela carcinogénese na população chinesa, mas sim a existência de outros polimorfismos com um alto LD.
Resumindo, diferenças populacionais e de tipo de tumor podem, em parte, justificar a diferença dos nossos resultados com os anteriormente publicados.
Posteriormente, verificámos que, este polimorfismo não influencia a sobrevida dos doentes com cancro colorretal nos estadios I-III (p=0,805) em analises uni- e multivariadas controlando para as características dos pacientes e do tumor que podem afetar o prognóstico da doença como a idade, estadio, grau de diferenciação, localização do tumor, obstrução e ou perfuração, invasão vascular, linfática e ou neural e a presença de margens cirúrgicas com tumor à altura do diagnóstico.
Apesar de não existir uma correlação significativa com a sobrevida dos doentes diagnosticados em estadio IV após a análise multivariada controlando para a idade, a localização do tumor e o órgão onde se detetaram as metástases (p=0,089), os pacientes homozigóticos para o alelo G apresentam uma tendência negativa no seu tempo de vida. Uma vez que esta análise foi feita com apenas 6 pacientes homozigóticos para este alelo, seria importante aumentar este coorte de forma a obter um maior poder estatístico capaz de validar a tendência observada.
É importante referir que na análise multivariada no estadio I-III e no estadio IV o braço GG apresenta poucos doentes, pelo que um maior número de doentes neste braço poderiam conferir um maior poder estatístico à análise multivariada.
No entanto, fomos investigar in vitro os processos celulares relevantes para o desenvolvimento e progressão de cancro, com o objetivo de compreender melhor o papel deste polimorfismo.
Existem estudos que associam a abolição da PLCε com um aumento da proliferação, com um aumento da libertação de fatores angiogénicos como VEGF-A e com um aumento de fatores pró-inflamatórios como COX-2, CXCL-1, CXCL-2, TNF-α, IL-1β, IL-6 e STAT3.
No nosso estudo, para além de abordar a influência da sobre expressão das variantes de PLCε wild-type e PLCε mutante (H1927A) nestes processos, analisámos ainda de que forma este polimorfismo poderia afetar a atividade fosfolipídica da enzima e a transição epitélio-mesênquima (EMT) nas linhas de cancro colorretal HCT116 e DLD1.
Da análise in vitro verificamos que em termos funcionais, a sobre expressão de PLCε
na atividade fosfolipídica da enzima. Contudo, a PLCε apresenta outros domínios funcionais específicos como o CDC25 e RA2, que poderão ser afetados por este SNP e que não foram testados neste trabalho.
Relativamente à expressão dos fatores angiogénicos e pró-inflamatórios anteriormente mencionados, verificámos que não existem diferenças significativas quando comparamos o efeito da sobre expressão da PLCε wild-type e mutante (H1927A). Contudo, a sobre expressão da PLCε wild-type não se traduz numa diminuição generalizada dos fatores pró-inflamatórios como já foi publicado, com exceção para TNF-α, cuja expressão diminui nas linhas DLD1, e IL-6, que diminui nas linhas HCT116 após sobre expressão de ambas as variantes de PLCε.
Fomos posteriormente verificar o efeito deste polimorfismo na proliferação celular. Assim, verificamos que a sobre expressão da PLCε (quer wild-type quer mutante H1927A) provoca uma diminuição na proliferação, sendo este resultado concordante com o papel supressor de tumor que é atribuído à PLCε neste tipo de tumor. No entanto, não existem diferenças na taxa de proliferação entre a sobre expressão da PLCε wild-type e da PLCε mutante (H1927A).
Finalmente, não conseguimos observar diferenças significativas entre o papel da PLCε
wild-type e da sua forma mutada (H1927A) na expressão de marcadores como a E-caderina,
N-caderina, Vimentina e Twist importantes no processo de EMT.
Em suma, o polimorfismo rs2274223 A>G do gene PLCE1 não parece apresentar qualquer influência em CRC, uma vez que não verificámos qualquer associação entre o mesmo e o risco de desenvolver a doença, a sobrevivência dos pacientes e nenhuma das funções celulares por nós testadas (atividade fosfolipídica, proliferação, EMT, inflamação e angiogénese).
vii
Abbreviations
3H Tritium
A Arginine
APC Adenomatous polyposis coli
ATCC American Type Culture Collection
BCL2/BCL-2 B-cell lymphoma 2
BMPR1A Bone morphogenetic protein receptor, type IA
BRAF B-RAF proto-oncogene
BSA Bovine serum albumin
C Cytosine
CA2+ Ionized calcium
CDC25 domain Cell division cycle 25 domain
CDH1 E-cadherin gene
CDH2 N-cadherin gene
cDNA Complementary deoxyribonucleic acid
CEA Carcinoembryonic antigen
CI Confidence interval
CIMP CpG Island methylation pathway
CIN Chromosomal instability
CLL Chronic lymphocytic leukaemia
CMV Cytomegalovirus
CO2 Carbon dioxide
COX-2 Cyclooxygenase 2
CRC Colorectal cancer
CT Cycle Threshold
CTC Circulating tumour cells
CTCL Cutaneous T cell lymphoma
ctDNA Circulating tumour DNA
CXCL1/Cxcl-1 (C-X-C motif) ligand 1 CXCL2/Cxcl-2 (C-X-C motif) ligand 2
DAG Diacylglycerol
Dil. Dilution
DMEM Dubelcco’s modified eagle’s medium
DNase Deoxyribonuclease
EC European Commission
EDTA Ethylenediaminetetra-acetic acid
EGF Epithelial growth factor
EGFR Epithelial growth factor receptor EMT Epithelial-to-mesenchymal transition ERBB2 Receptor tyrosine-protein kinase erbB-2
ESMO European Society for Medical Oncology
FBS Fetal bovine serum
FOBT Faecal occult blood test
FOLFIRI Fluoropyrimidine plus Irinotecan
FOLFOX Fluoropyrimidine plus oxaliplatin
G Guanine
g Gravitational force
G1/G2/G3 Grade 1/2/3
GC Gastric cancer
GCO Global Cancer Observatory
GAPDH Human glyceraldehyde 3-phosphate dehydrogenase
gDNA Genomic deoxyribonucleic acid
GEF Guanine exchange factor
GFP Green fluorescent protein
GTPase Guanosine triphosphate hydrolase
GWAS Genome-wide association study
H Histidine
H1927A Mutant PLCε
HCl Hydrochloric acid
HR Hazard ratio
HRP Horseradish peroxidase
IBM International Business Machines IL1B/Il-1β Interleukin 1 beta
IL6/Il-6 Interleukin 6
IMM Instituto de Medicina Molecular IP3 Inositol 1,4,5-trisphosphate
ix
KRAS Kirsten rat sarcoma viral oncogene homolog
LD Linkage disequilibrium
LiCl Lithium chloride
LOH Lost-of-heterozygosity
LPA Lysophosphatidic acid
LVNI Lymphatic, Neural or Vascular Invasion
M Molar
mA Milliamperes
MAPK Mitogen-activated protein kinase
microRNA Micro ribonucleic acid
min Minute
mL Millilitre
MLH1 Human MutL homolog 1
mM Millimolar
MMR Mismatch repair
MRI Magnetic resonance imaging
MSH2 Human MutS protein homolog 2 MSH6 Human MutS protein homolog 6
mRNA Messenger ribonucleic acid
MSI Microsatellite Instability
MUTYH MutY homolog
N Number of samples
NA Not applicable
ng Nanogram
NRAS Neuroblastoma RAS viral oncogene homolog
°C Celsius degrees
OR Odds Ratio
OS Overall Survival
P25 25th percentile
P75 75th percentile
pEGFP Plasmid EGFP
Pen/Strep Penicillin-Streptomycin
PH domain Pleckstrin homology domain
PIP2 Phosphatidylinositol 4,5-bisphosphate
PKC Protein kinase C
PLC Phosphoinositide-specific phospholipase C
PLCE1/PLCε Phosphoinositide-specific phospholipase C epsilon PLCG/PLCγ Phosphoinositide-specific phospholipase C gama
PLCβ Phosphoinositide-specific phospholipase C beta
PLCδ Phosphoinositide-specific phospholipase C delta
PLCζ Phosphoinositide-specific phospholipase C zeta
PLCη Phosphoinositide-specific phospholipase C eta
PMAS Positive margins after surgery
PMS2 Mismatch Repair Endonuclease PMS2
p-STAT3 Phosphorylated signal transducer and activator of transcription 3 PTEN Phosphatase and tensin homolog
PTGS2 Prostaglandin-endoperoxide synthase 2
RA1/RA2 RAS association domain 1/2
RAL RAS related protein RAL
RHO RAS homolog gene family
Rn Normalized reporter value
RNA Ribonucleic acid
Rnase Ribonuclease
Rpm Revolutions per minute
RTK Tyrosine kinase receptor
RT-qPCR Real-time reverse transcriptase polymerase chain reaction
s Second
SD Standard deviation
SH2/SH3 Src homology 2/3
SMAD4 SMAD family protein 4
SNP Single nucleotide polymorphism
SPSS Statistical Package for the Social Sciences
STAT3 Signal transducer and activator of transcription 3 STK11 Serine/threonine kinase 11
TAC Computed tomography scan
TBS Tris-buffered saline
xi
TGFA/TGF α Transforming growth factor α TNF/TNF-α Tumour necrosis factor alfa
TNM Tumour extension/Lymph Nodes/Metastasis TP53/P53 Tumour protein 53
V Volts
VEGFA/ VEGF-A Vascular endothelial growth factor A
VIM Vimentin
WHO World Health Organization
μCi/mL Micro Curie per millilitre
μg Microgram
Index
Agradecimentos ... i Abstract ... ii Resumo ... iii Abbreviations... vii 1. Introduction ... 1 1.1. Colorectal cancer ... 11.1.1. Colorectal cancer development ... 1
1.1.2. Risk factors and drivers of colorectal cancer developing ... 2
1.1.2.1 Sporadic colorectal cancer... 3
1.1.2.2 Hereditary colorectal cancer ... 3
1.1.3. Colorectal cancer screening and diagnosis guidelines ... 3
1.1.4 Colorectal cancer treatment ... 4
1.1.5 Colorectal cancer biomarkers ... 5
1.2. Phosphoinositide-specific phospholipase C ... 6
1.2.1. Phospholipase C epsilon (PLCε) ... 8
1.2.1.1. Phospholipase C epsilon and cancer ... 8
1.2.1.2. Single nucleotide polymorphism rs2274223 in cancer ... 10
2. Objectives ... 12
3. Materials and Methods ... 13
3.1 Study Population ... 13
3.2. Genomic DNA Extraction and Genotyping ... 13
3.3. Mutagenesis ... 14
3.4. Cell Culture ... 14
3.4.1 Cell Viability Assay ... 15
3.4.2. Activity Assay ... 15
xiii
3.5. Real-time Reverse Transcriptase Polymerase Chain Reaction (RT-qPCR) ... 17
3.6. Statistical Analysis ... 18
4. Results and Discussion ... 19
4.1. Role of PLCE1 rs2274223 polymorphism in the risk of developing colorectal cancer . 19 4.2. Prognostic value of PLCE1 rs2274223 polymorphism ... 21
4.2.1. PLCE1 rs2274223 polymorphism prognostic value in stage I-III colorectal cancer patients ... 21
4.2.2. PLCE1 rs2274223 polymorphism prognostic value in stage IV colorectal cancer patients ... 24
4.3. PLCε activity after wild-type and mutant (H1927A) PLCE1 overexpression ... 27
4.4. PLCE1 rs2274223 polymorphism role in EMT biomarkers ... 28
4.5. PLCE1 rs2274223 polymorphism role in inflammation and angiogenesis ... 29
4.6. PLCE1 rs2274223 polymorphism role in cell proliferation ... 30
5. Conclusions and Future Perspectives ... 31
Index of Figures
Figure 1 – Gastrointestinal System Anatomy ... 2
Figure 2 – Different types of polyps and how they turn into cancer ... 2
Figure 3 – Phosphoinositide-specific phospholipase C family domain organization ... 7
Figure 4 – PLCε controversial role in cancer ... 10
Figure 5 – Allelic discrimination of PLCE1 rs2274223 A>G polymorphism ... 19
Figure 6 – Survival curve and univariate and multivariate analysis of OS from patients with CRC from stage I to III ... 23
Figure 7 – Survival curve, univariate and multivariate analysis of OS from patients with CRC from stage IV ... 25
Figure 8 – PLCε Activity Assay. ... 27
Figure 9 – Relative expression analysis of EMT Biomarkers ... 28
Figure 10 – Analysis of inflammatory and angiogenic biomarkers ... 29
xv
Index of Tables
Table 1 – Current biomarkers recommended by ESMO and American Society for Clinical Pathology. ... 5 Table 2 – List of antibodies used in Western Blot ... 16 Table 3 – List of primers used in qPCR (all primers in this list are for human cDNA) ... 17 Table 4 – Demographical characteristics of patients with CRC and healthy controls enrolled in this study. ... 19 Table 5 -Genotype distribution of PLCE1 gene rs2274223 polymorphism in patient with CRC and healthy control ... 20 Table 6 – Association between PLCE1 genotypes and risk of CRC in patients with CRC and healthy controls ... 21 Table 7 - Clinical and demographic characteristics of stage I to III CRC patients ... 22 Table 8 – Models used for multivariate analysis of OS from patients with CRC from stage I to III... 24 Table 9 – Clinical and demographic characteristics of CRC patients between stage IV associated with PLCE1 rs2274223 polymorphism... 24 Table 10 – Models used for multivariate analysis of OS from patients with CRC from stage IV ... 26
1. Introduction
Cancer is a worldwide problem whose incidence and mortality is extremely high in the world, affecting every aspect of our society1.
The efforts made in prevention, earlier diagnoses and development of better treatments has contributed to decreased cancer mortality, however the numbers of new cases and deaths related to cancer are still alarming.
In 2004, the Global Burden Disease Report showed that cancer was the 3rd disease with highest
mortality, only bellow cardiovascular diseases and infectious/parasitic diseases. This report estimated that 7.4 million deaths were related to cancer internationally2.
In 2012, cancer incidence increased to 14.1 million globally3 and it is estimated that 8.2 million
deaths occurred due this disease3, while in 2015 cancer caused death to 8.8 million people.
The Global Cancer Observatory (GCO) estimates that in 2018, cancer incidence will rise to 18.1 million new cases and cause the death of 9.6 million4.
Unfortunately, in 2040 cancer incidence is expected to reach 29.5 million new cases and the global number of deaths is predicted to increase up to 16.4 million4. These numbers can be explain by
an increase in lifetime expectancy, risk factors exposure, bad lifestyle habits (e.g. smoking), among others5.
Overall, cancer is generically defined by the uncontrolled growth and spread of malignant cells to the surrounding tissues which can, ultimately, affect almost any part of the body6.
There are different types of cancer depending on the organ or tissue where it is formed, the type of cells and their driver mechanisms, therefore, different approaches to treat this disease are desired.
1.1. Colorectal cancer
Colorectal cancer (CRC) is the 4th most diagnosed and the 3rd with highest mortality in the world.
In Portugal, CRC is the 3rd most diagnosed and the 2nd with highest mortality for both sexes and
all ages.
GCO estimates that in 2018, 1.85 million new cases will be diagnosed, and 880 792 deaths will occur. From those, 10 270 new cases and 3 050 deaths will be registered in Portugal.
It is expected that the global burden of colorectal cancer will increase to more than 3.2 million new cases and 1.6 million deaths in 20404.
1.1.1. Colorectal cancer development
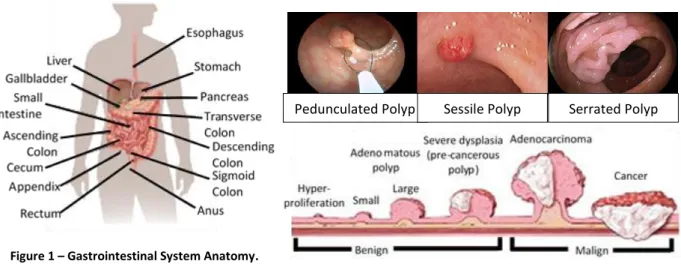
CRC develops on the large intestine, which is part of the gastrointestinal system7 (Figure 1).
2
and the left part of the colon), descending colon and sigmoid colon (connects the descending colon with rectum and finally with the anus)7.
The right side of colon (proximal colon) is composed by the ascending and two thirds of the transverse colon which developed embryologically from the midgut. While left colon (distal colon) develops from the hindgut and is composed by one third of transverse colon, descending colon and sigmoid colon7.
In 1978, Hill et al. proposed the adenoma-carcinoma sequence to describe the transformation of normal colorectal epithelium to an adenoma (polyp), proceeding to in situ carcinoma, and ultimately to an invasive and metastatic tumour (Figure 2)8.
There are different types of polyps (Figure 2) and despite they are pre-cancerous not all turn into cancer. Nevertheless, due to the risk they represent of becoming malignant (Figure 2) they must be removed9.
The wall of colon and rectum is made of many layers, CRC start spreading from the mucosa layer outwards potentially invading blood and/or lymphatic vessels. From this point, cancer cells can spread to other parts of the body (metastasize)9.
1.1.2. Risk factors and drivers of colorectal cancer developing
Risk factors are characteristics, or substance exposure that increase the chances of a person develop a disease or injury. It is important to know which risk factors are associated to CRC development because although some are intrinsic, many can be avoided.
There are many factors pointed to increase the risk of developing this disease including overweight or obesity, excessive alcohol consumption, smoking tobacco, consumption of processed and red meat, inflammatory bowel diseases, and family history10. However, it is estimated that 90% of
CRCs diagnosed develop sporadically and only 10% are caused by an inherited predisposition.
Pedunculated Polyp Sessile Polyp Serrated Polyp
Figure 2 –Different types of polyps and how they turn into cancer. Figure 1 – Gastrointestinal System Anatomy.
1.1.2.1 Sporadic colorectal cancer
Studying colorectal cancer, Fearon Vogelstein described in 1990 that accumulation of multiple mutations in epithelial cells were necessary for the acquisition of selective growth advantage11.
Chromosomal Instability (CIN), microsatellite instability (MSI) and CpG island methylation pathway (CIMP) are now considered the three major genetic and epigenetic mechanisms responsible for sporadic CRC12,13.
Chromosomal Instability is the most common sporadic CRC driver and it is defined as the accumulation of numerical or structural abnormalities in chromosomes which leads to lost-of-heterozygosity (LOH) in tumour suppressor loci and or chromosomal rearrangements. This allows the accumulation of mutations in critical genes like APC, KRAS, PIK3CA, BRAF, SMAD4, TP53, and others that activate pathways important to tumorigenesis13.
Microsatellite Instability is caused by the abnormal number of microsatellites (short repeat sequences of DNA) in cells. The incapacity of cells to correct DNA damage caused by the silencing of DNA mismatch repair (MMR) genes leads to the accumulation of microsatellites. When these uncorrected microsatellites are in DNA coding regions, they can give rise to frameshift termination and consequently protein truncations13.
CpG Island Methylation Pathway consist in the methylation of the genome in regions rich in cytosine (C) and guanine (G) bases that modulate DNA transcription. This modulation may silence important tumour suppressor genes and/or activate constitutively oncogenes13.
1.1.2.2 Hereditary colorectal cancer
It is important to characterize CRC with hereditary predisposition to identify persons at risk, to provide earlier diagnosis and better therapeutic approaches14.
Germline mutations are responsible for driving hereditary CRC with a manifestation and evolution of the disease well characterized in most of the cases. Germline mutation in APC gene leads to Familial Adenomatous Polyposis. Mutations in MSH2, MSH6, MLH1 and PMS2 genes lead to Lynch Syndrome. Biallelic mutations of MUTYH lead to MUTYH Associated Polyposis. STK11 gene germline mutations lead to Peutz-Jeghers Syndrome, while SMAD4 or BMPR1A lead to Juvenile Polyposis Syndrome13,14.
1.1.3. Colorectal cancer screening and diagnosis guidelines
An earlier diagnosis of CRC is essential to achieve better outcomes for patients with this disease. In this context, European Commission (EC) develop a set of guidelines to assure quality in CRC screening and diagnosis15.
4
Despite the increasing list of methods to screen for CRC, to date only faecal occult blood test (FOBT) is recommended as screening test15.
Some imaging techniques are being applied instead or to complement the screening of FOBT for example sigmoidoscopies and colonoscopies, due to their potential impact to prevent CRC development on-site15.
A positive colorectal cancer must be confirmed pathologically. After a biopsy or surgery, pathologists must report every available tissue characteristic.
In order to do that, the European Society for Medical Oncology (ESMO) developed guidelines underlining the information that have a great impact on patient’s prognosis.
Therefore, pathologists must report16–18:
a) Morphological description of the specimen; b) Surgical procedure carried out;
c) Definition of tumour site and size;
d) Presence or absence of macroscopic tumour perforation; e) Histological type and grade;
f) Distance of cancer from resected margins (proximal, distal and radial); g) Presence or absence of tumour deposits;
h) Lymphovascular and/or perineural invasion; i) Presence of tumour budding;
j) Stage TNM by reporting the extension of tumour in the bowel wall (T), the number of lymph nodes removed and how many are invaded by cancer cell (N), and finally the involvement of other organs (M).
1.1.4 Colorectal cancer treatment
To develop the best treatment, it is important to consider the extension of the disease and patient’s risk to relapse.
While stage report is crucial to determine the extension of the disease, other status like involvement of resected margins, histological grade, perforation, lymphovacular and/or perineural invasion inform the probability of disease relapse16–18.
Other parameters may also represent a high-risk condition such as mutations and altered expression of genes such as TP53, KRAS, BCL2, TGFA, EGFR, proliferation index and aneuploidy18.
When developing a strategy of treatment, it is also important to consider individual patient’s characteristics like physical condition and age. It is important to assess whether patients have capability to get through treatment and consider if the treatment will benefit the patient in the lifetime left.
Normally, in earlier stages of locoregional disease (Stage I) surgery is the only treatment applied16,18. In intermediate stages of the disease (Stage II and III) combined chemotherapy (e.g.
FOLFOX – Fluoropyrimidine plus oxaliplatin) is the first line treatment after surgery (in rectal cancer chemotherapy can be combined with radiotherapy). Rectal cancers in stage III have the option to be treated with neoadjuvant therapy to diminished the size of tumour before surgery16.
Finally, in stage IV the treatment will depend on tumour related characteristics (e.g. local of metastasis, symptoms, prognostic molecular or biochemical biomarkers), patient related factors (e.g. patient fitness condition) and treatment related factors (e.g. toxicity)17. Commonly, a first line
treatment (e.g. FOLFIRI, FOLFOX normally in combination with cetuximab or bevacizumab) is used to shrink the tumour and metastasis and allow resection or ablation. After surgery, patients continue treatment with the first line therapy.
However, not all patients are fit to go under tumour resection, and some of them relapse after finishing the adjuvant therapy cycle. In these cases, patients may initiate a second line therapy that must be different from the first line treatment. Every time a patient relapses it is necessary to change the therapeutic strategy. There is also the possibility to include these patients in clinical trials to test new therapeutic approaches17.
1.1.5 Colorectal cancer biomarkers
A cancer biomarker is any molecule (e.g. protein, DNA, RNA, etc.) or tumour cell that can be found in body fluids or tissue and signalize an abnormal process. Therefore, cancer biomarkers are useful to predict cancer development, prognosis or therapeutic response19.
Table 1 shows the biomarkers recommended by ESMO and/or by American Society for Clinical Pathology and their application on the clinic16–18,20.
Table 1 – Current biomarkers recommended by ESMO and American Society for Clinical Pathology.
Biomarker
Application
Location
FOBT Diagnostic All locations
CEA Prognosis All locations
BRAF mutation V600E Prognosis Right colon
MSH2, MSH6, PMS2 and MLH1 Prognosis Right colon
NRAS and KRAS mutations Prognosis and therapeutic response All locations
As previously mentioned, FOBT is the only biomarker used in CRC diagnostic15.
Carcinoembryonic antigen (CEA) is used to monitor patient’s outcome and predict CRC relapses, high levels of CEA are correlated with poor prognosis16–18,20. BRAF mutation V600E alongside with mutations
on MSH2, MSH6, PMS2 and MLH1 are correlated with poor prognosis in right colon cancer17,20. Finally, NRAS and KRAS mutations were found to be correlated with poor prognosis and with resistance to
6
Furthermore, mutations in PIK3CA, loss of PTEN, the levels of EGFR ligands such as amphiregulin, epiregulin and TGF-α, the levels of EGFR protein expression, amplification of EGFR and HER2 are seen by ESMO as emerging biomarkers for anti-EGFR therapeutic resistance. However, they do not have, so far, the recommendations necessary to be used by clinicians in a regular basis20.
In CRC is also established that right and left side colon cancers have different prognosis because of their different embryological origins, as well as anatomical, histological, genetic and immunological characteristics7,21.
Other promising biomarkers in CRC follow-up are circulating tumour cells (CTC) and circulating tumour DNA (ctDNA). In patients with CRC it is possible to find CTC and ctDNA in the blood stream. An elevated number of this cells and/or elevated levels of ctDNA is associated with the risk of developing metastasis and/or resistance to therapeutic22.
Although several putative biomarkers have been identified, very few are effectively used in clinical practice, therefore, there is still an urgent need for highly selective and specific biomarkers able to allow the earlier detection of tumour cells.
1.2. Phosphoinositide-specific phospholipase C
Phosphoinositide-specific phospholipase C (PLC) proteins are putative cancer biomarkers that are found in every human cell and are involved in a broad range of regulatory interactions such as cell motility, growth and differentiation23,24.
PLCs are stimulated by specific receptors for hormones, neurotransmitters, antigens, components of the extracellular matrix and growth factors25.
Once stimulated, PLC cleaves phosphatidylinositol 4,5-bisphosphate (PIP2) generating two
second messengers: diacylglycerol (DAG) and inositol 1,4,5-trisphosphate (IP3)25,26.
While IP3 is important in cellular Ca2+ regulation, DAG activates protein kinase C (PKC) and its
downstream pathway. Together, these second messengers are important regulatory factors of a variety of biological functions as cell motility, growth, survival, fertilisation and sensory transduction25,26.
13 PLC isozymes were identified and grouped in 6 families (PLCβ, PLCγ, PLCε, PLCδ, PLCη and PLCζ) (Figure 3). All these enzymes share common core of domains but have specific structures and regulation mechanisms26.
Figure 3 – Phosphoinositide-specific phospholipase C family domain organization: Domain organization of PLCε, PLCβ,
PLCγ, PLCδ, PLCη and PLCζ. PLC common domains C2 (green), catalytic TIM barrel domain X-Y (red), EF-hands domain (yellow) and pleckstrin homology domain (light blue, except for PLC ζ). PLCε specific domains: CDC25 (dark blue), RAS association domain (purple). PLCβ specific domain CTD (brown). PLCγ specific domains: nSH2 and cSH2 (pink) and SH3
(gray).
PLCβ has 4 isoforms (PLCβ1, PLCβ2, PLCβ3 and PLCβ4) with different patterns of tissue distribution. While PLCβ1 and PLCβ3 are expressed in many tissues, PLCβ2 and PLCβ4 are mainly expressed in hematopoietic and neuronal cells, respectively25–27. Moreover, PLCβ have a GTPase
activating protein function and its specific C terminal domain (CTD) play an important role in membrane binding and activation26.
Defects in PLCβ3 has been associated with atopic dermatitis like skin inflammation and with myeloproliferative neoplasms, while PLCβ1 deficiency has been associated with myelodysplastic syndromes26.
PLCγ has 2 isoforms (PLCγ1 and PLCγ2), while PLCγ1 is ubiquitously expressed, PLCγ2 is predominantly expressed in hematopoietic cells25,27,28.
PLCγ has an insert between the catalytic domains X and Y constituted by two PH domains, two SH2 domains and a SH3 domain. These domains play a crucial role in PLCγ auto-inhibition and activation downstream receptors tyrosine kinases (RTK) such as epithelial growth factor receptor (EGFR)25,27,28. Furthermore, PLCγ is important for hematopoietic cell development, especially in
immune system cells and disfunctions of PLCγ may contribute to development of auto-immune disease27,28.
8
development. Driver mutations in PLCG genes were identified in angiosarcoma, cutaneous T cell lymphoma (CTCL) and chronic lymphocytic leukaemia (CLL)28.
PLCδ has 4 isoforms (PLCδ1, PLCδ2, PLCδ3 and PLCδ4) and it has a broad distribution in all tissues. It is speculated that this enzyme may be the prototype of the others PLC. PLCδ only present the PLC conserved domains and do not have any unique domain. Deficiency in these enzymes may be involved in male infertility and the development of inflammatory skin diseases such as psoriasis and contact hypersensitivity27.
PLCζ is sperm specific, its structure lacks the PH domain and disfunctions on this enzyme leads to infertility27.
PLCη has 2 isoforms (PLCη1 and PLCη2), these isoenzymes are mainly expressed in brain and its physiological functions still unknown27.
1.2.1. Phospholipase C epsilon (PLCε)
PLCε is broadly expressed in all tissues but has its higher expression in heart, colon and lung29.
This enzyme has unique domains such a CDC25 domain in the N-terminal region and two RAS-Association domains (RA1 and RA2) in the C-terminal region25–27,30–33.
While the CDC25 domain works as a guanine exchange factor (GEF) for RAP1, the association of RAS proteins with the RA2 domain is important for the translocation of this enzyme from cytoplasm to the plasma membrane where it exerts its function. Other families of small GTPases able to activate PLCε are RAL and RHO families through binding to the catalytic domain of PLCε29.
Furthermore, PLCε activity can also be stimulated by lysophosphatidic acid (LPA) and thrombin receptors through the G-protein subunit Gα12/1325–27,30–33.
PLCε has been shown to be crucial in the regulation of normal physiology in animal models. For example, mouse models depleted of PLCε developed heart hypertrophy in response to chronic cardiac stress. Interestingly, this enzyme has been associated with idiopathic dilated cardiomyopathy and may be associated with the development of other human cardiac diseases34,35.
In another study, zebrafishes knockdown for PLCε developed nephrotic syndrome, since this enzyme is important to maintain the podocyte filtration barrier30,36.
This enzyme was also associated with skin inflammation, neuroinflammation and cancer26.
1.2.1.1. Phospholipase C epsilon and cancer
PLCε was shown to be involved in cancer development. This enzyme may participate with its phospholipase activity in many pathways associated with cancer (for example cell proliferation). On the other hand, its GEF and RAS association properties may also influence RAS/MAPK pathways30,34,37,38.
Many studies suggest that PLCε deregulation may contribute to tumorigenesis by inducing inflammation and angiogenesis which facilitates cancer development and maintenance in skin, prostate, bladder and in intestine39–44.
However, the role of PLCε in cancer development and progression is still controversial. For example, in skin cancer studies from Bai and co-workers and Martins et al. showed contradictory results for PLCε.
Bai and co-workersreport that transgenic mice with PLCε catalytic function deleted had a delay on time of tumour development. After a two-stage chemical skin carcinogenesis protocol these mice had less tumour burden than mice with full-length PLCε. These findings suggested that PLCε has an oncogene function45.
On the other side, Martins et al. show that PLCε behave as a tumour suppressor. Since mice knockout for PLCε had an increased tumour load, bigger tumours and an increased number of Ki67 positive cells before and after treatment in the two-stage chemical skin carcinogenesis model46. Thus,
the controversial role of PLCε in this skin mouse model can be, at least, explained by the different nature of the transgenic animal, nevertheless more studies are needed in order to clear PLCε role in skin cancer.
However, in esophageal and gastric cancer results seem to be consensual in showing that high levels of PLCε expression were associated with tumour progression, which implicates an oncogene role of this enzyme47–49.
In colorectal cancer, PLCε is considered a tumour suppressor protein. Danielsen et al. showed that mRNA levels of PLCE1 are downregulated in tumour tissue when compared with normal tissue, they also found that PLCE1 levels were associated with KRAS mutation49,50. In a separate study, Wang
X. et al. also found that PLCε expression levels were downregulated when compared with colon normal tissue samples. Furthermore, they found that PLCε overexpression lead to higher apoptosis rates, slower growth and decreased migration ability in cells. PLCε overexpression also formed smaller tumours in xenograft mice49,51.
Therefore, it is overall agreed that depending on the type of tumour, PLCε may have a tumour suppressor role or act as an oncogene49 (Figure 4).
Finally, there are also many studies developed in digestive tract cancers that reports the presence of PLCE1 rs2274223 single nucleotide polymorphism (SNP) as a potential risk factor for cancer development.
10
Figure 4 – PLCε controversial role in cancer. Figure from Tyutyunnykova A et al. The controversial role of phospholipase C
epsilon (PLCε) in cancer development and progression, 201749.
1.2.1.2. Single nucleotide polymorphism rs2274223 in cancer
Single nucleotide polymorphism rs2274223 consists in the substitution of an adenine by a guanine in the position 5781 of human cDNA from PLCE1 gene, which leads to the substitution of an histidine by an arginine in the 1927th amino-acid from PLCε, localized on the C2 domain of the
enzyme52.
This polymorphism was discovered by Abnet et al.53 in 2010 in a genome-wide association study
(GWAS), when studying esophageal cancer.
This SNP was also studied for gastric cancer (GC) by two different groups but with contrary results. While Li-Dong Wang et al.54 report in 2010 that rs2274223 is associated with GC development
in a Chinese Han population, Palmer et al.55 could not find any association between this SNP and GC in
a Polish population.
Furthermore, this polymorphism was also associated with gallbladder cancer in a North Indian population56.
There were some retrospective studies that identified an association between rs2274223 and CRC development. In 2012, Fen-Xia Li et al.57 reported that while the AG genotype had a malignant
effect in CRC, the genotype GG seemed to have a protector role. Furthermore, in 2014, Qi Wang et al.52 showed that in a Chinese population the phenotypes AG an GG were associate with increased risk
downregulated when compared to the wild-type mRNA. This could potentially lead to a reduction of PLCε enzyme and consequently reduction of its tumour suppressor role, exposing patients to increased risk of development of this disease.
In 2015, Juozas Kupcinskas et al.58 develop the first study in a European population that
evaluated the association of this SNP with CRC, the results obtained by them show no significant association between PLCE1 SNP rs2274223 and CRC.
However, contrary to those results, in a case-control study developed by Oztas Ezgi et al.59 in
a Turkish and Caucasian population it was found an association between PLCE1 SNP rs2274223 and CRC.
Overall, the association between SNP rs2274223 and CRC is not consensual and highly inconclusive.
12
2. Objectives
Many studies have explored the association between SNP rs2274223 and CRC. However, it is still unclear whether this polymorphism is related with CRC.
Interesting, most studies were developed in Chinese populations. The only two studies that focused on European population had contradictory results. Furthermore, all these studies had focused only in the risk of developing CRC leaving unanswered the question of whether the outcome of patients with CRC is affected by the presence of this polymorphism. Finally, the functional role of this polymorphism in cancer cells was never explored before.
Therefore, with this project we aimed at studying this polymorphism, not only, in a clinical setting, but also, in an in vitro approach.
Our specific objectives are: i. In a clinical setting:
a) Access the risk of PLCE1 SNP rs2274223 in developing CRC in a Portuguese population; b) Determination of polymorphism rs2274223 prognostic value.
ii. In an in vitro approach:
a) Determine the influence of this polymorphism in the phospholipase activity; b) Determine how this polymorphism affects cells properties.
3. Materials and Methods
3.1 Study Population
This was a single center case-control study which enrolled 219 patients newly diagnosed with CRC and confirmed by histopathology analysis from Hospital de Santa Maria, Centro Hospitalar Lisboa Norte, in Lisbon, Portugal. Patient’s blood samples were stored at -80°C, at L. Costa Laboratory Biobank.
We retrospectively collected patient’s information, namely, age at diagnosis, sex, follow-up time, tumour location, pathological tumour stage and tumour differentiation status accordingly to WHO classification of tumours of the digestive system60, positive margins after surgery (PMAS),
obstruction or perforation at diagnosis, lymphatic, neural or vascular invasion (LNVI) and KRAS mutations (only for Stage IV Patients). Data collection occurred between April 2006 to December 2017 and was in agreement with data protection principle.
As healthy controls, 221 samples were requested from Biobanco-IMM, Lisbon Academic Medical Centre, Lisbon, Portugal, which were matched for sex and age.
All control participants and patients agreed to make available their biological material for research purposes by filling and signing an Informed Consent.
3.2. Genomic DNA Extraction and Genotyping
Patient’s blood samples were collected in ethylenediaminetetra-acetic acid (EDTA) anticoagulant tubes and stored at -80°C until genomic DNA (gDNA) extraction. 200μL of blood was used to extract gDNA following NZY Blood gDNA Isolation Kit (NZYTech) recommended protocol and stored at -20°C until analysis.
The rs2274223 SNP was genotyped using the TaqMan® SNP Genotyping Assay (Reference: C___1947254_1; Applied Biosystems). For allele A probes were marked with VIC, while for allele G probes were marked with FAM fluorescence dyes.
Patient’s and control’s gDNA samples were placed in MicroAmpTM Fast Optical 96-Well Reaction
Plates following the Wet DNA Delivery Method of Taqman® Genotyping Master Mix Protocol in a 10μL reaction: 5μL TaqMan Genotyping Master Mix (2X), 0,5μL TaqMan genotyping assay mix (20X) and 4,5μL of sample (containing a gDNA concentration between 1 to 20ng/μL).
The PCR amplification was carried out with an initial pre-denaturation step at 60°C for 1 min and a 10 min denaturation at 95°C followed by 40 cycles of denaturation at 95°C for 15 s and annealing/extension at 60°C for 1 min, using an Applied Biosystems® 7500 Fast Real-Time PCR System
according to the manufacturer’s instructions. The 7500 Fast Software v2.0.6 (Applied Biosystems) was used for data analysis.
14
Allelic discrimination was measured by ΔRn using ROX as passive reference.
3.3. Mutagenesis
In order to test the role of this polymorphism in vitro, rat PLCE1 cloned into pEGFP-C1 vector (Clontech) were obtained from Matilda Katan´s Lab at University College London. Site-directed mutagenesis was then performed in order to alter the coding of PLCε from arginine to histidine in position 1927. Mutagenesis was performed following the NZYMutagenesis kit (NZYTECH) recommended protocol using the complementary primers (forward and reverse) designed and provided by Invitrogen (Thermofisher) bellow:
Primer Forward (5’to3’):
GGAATGAGCAGTTTCTCTTCC
AC
GTTCACTTTGAAGATCTTG Primer Reverse(5’to3’):CAAGATCTTCAAAGTGAAC
GT
GGAAGAGAAACTGCTCATTCCPCR was performed accordingly to manufacturer indications, in the reaction mix for mutagenesis 1μL of PLCE1 plasmid was used and 2μL of each primer (10μM each). After PCR, template DNA was digested with DpnI restriction enzyme PCR product was transformed into NZYStar competent cells. Finally, DNA was isolated from different kanamycin resistant colonies using NZYMiniprep (NZYTech) and confirmed by sequencing.
3.4. Cell Culture
Cos-7 (Cercopithecus aethiops immortalized kidney fibroblast cell line), DLD1 and HCT116 human colon cancer cell lines were purchased from American Type Culture Collection (ATCC, Virginia, USA) and cultured in fresh complete growth medium constitute by Dubelcco’s Modified Eagle’s Medium (DMEM; Gibco) supplemented with 10% of Fetal Bovine Serum (FBS; Gibco) and 1% of Penicillin-Streptomycin (Pen/Strep; Gibco). Cells were grown at 37°C with 5% of CO2.
Cos-7, DLD1 and HCT116 cell lines were transfected when were at 60-70% confluence with Lipofectamine® 3000 (Thermofisher), using pEGFP-C1-PLCE1 wild-type and mutant (H1927A) vectors,
following manufacture instructions. Briefly, Lipofectamine® 3000 reagent (1μL), plasmid DNA (1μg) and P3000 reagent (2μL) were diluted in Opti-MEM® Medium (Gibco) and incubated for 20min at room temperature to create DNA-lipid complexes that were then added to 24-well plate cells in medium without serum or antibiotics. Volumes were adjusted for other format plates. For parental control, cells were incubated with Lipofectamine®3000 reagents for the same time. Roughly, 3 hours after initial transfection, the medium was replaced by fresh complete growth medium.
3.5. Cell Viability Assay
To perform the viability test 3 x 10⁴ DLD1 and HCT116 cells were culture in 24-well plates with
DMEM supplemented with 10% FBS and 1% Pen/Strep for 24 hours at 37°C until they were at 60-70% confluence. At that point, cells were transfected using Lipofectamine® 3000, as previously described.
24 hours after transfection, medium was changed by 1mL of fresh complete growth medium supplemented with 10% alamarBlue® from Invitrogen (Thermofisher). After 3 hours of incubation fluorescence was read with an excitation wavelength of 570nm and an emission length of 585nm in the Infinite 200 Microplate Reader (Tecan).
This last step of the procedure was repeated for 3 days. 3.6. Activity Assay
To perform the activity assay 2,5 x 10⁵ Cos7 cells were seeded into a 6 well-plate with DMEM
supplemented with 10% FBS and 1% Pen/Strep for 24 hours at 37°C. At that point, cells were transfected using Lipofectamine® 3000 and plasmids coding for PLCε wild-type and mutant (H1927A)
as previously described.
48 hours after seeding, cells were washed twice with inositol-free DMEM (USBiological) without serum and incubated for 24h in 1,5ml of the same medium supplemented with 0,25% fatty acid free bovine serum albumin (BSA, Sigma) and 1,5μCi/ml myo-[2-3H]inositol (PerkinElmer Life Sciences). At that time, cells were incubated in 1,2ml of inositol-free DMEM without serum containing 20mM LiCl (Sigma) with or without stimulation with 100 ng/ml EGF (Calbiochem®) for 1 hour.
To lyse cells was added 1,2ml 4,5% perchloric acid (Fluka) and incubated on ice for 30min. Samples were centrifuged for 20min at 4000rpm, supernatants were separated from pellets, neutralized by addition of 3ml of 0,5M potassium hydroxide/9mM sodium tetraborate (both from Sigma) and centrifuged for 20min at 4000rpm. After that, Anion exchange AG1-X8 200–400 columns (Bio-Rad) was converted to the formate form by addition of 2M ammonium formate/0,1M formic acid (both from Sigma). These columns were equilibrated with water and supernatants were loaded. The columns were washed three times with 5ml of 60mM ammonium formate/5mM sodium tetraborate, and inositol phosphates were eluted with 5ml of 1,2M ammonium formate/0,1M formic acid. 5ml Ultima-Flo scintillation fluid (PerkinElmer Life Sciences) was added to the eluates and the radioactivity quantified by liquid scintillation counting. The values represent total inositol phosphates. The pellets from the first centrifugation were resuspended in 100μl of water and 375μl of chloroform/methanol/HCL (200:100:15) (chloroform and HCL from Sigma and Methanol from Merck), plus an additional 125μl of chloroform and 125μl of 0,1M HCL. After vortexing, the samples were centrifuged at 2500rpm for 10min. 20μl of the lower phase were placed in a scintillation vial with 2ml of Ultima-Flo scintillation fluid and the radioactivity quantified by liquid scintillation counting. The
16
obtained values correspond to radioactivity in total inositol lipids. PLC activity is expressed as the total inositol phosphates formed relative to the amount of [3H]myo-inositol in the phospholipid pool.
3.7. Western Blot
To perform Western blotting 3 x 10⁶ DLD1 and HCT116 cells were cultured in Petri dishes with
DMEM supplemented with 10% FBS and 1% Pen/Strep for 24 hours at 37°C until they were at 60-70% confluence. At that point, cells were transfected using Lipofectamine® 3000.
48 hours after transfection, HCT116 and DLD1 cell lines were lysed in lysis buffer (25mM Tris 1M pH 7,5 (Sigma), 2mM EDTA 0,5M (Sigma), 10mM 10% Triton (VWR), 1mM TCEP 1M (Sigma), protease inhibitor cocktail (Roche) and phosphatase inhibitor cocktail 2 (Sigma)) for 10min on ice.
Cells with lysis buffer were incubated for 10min on ice, centrifuged by 10min at 12000rpm at 4°C, and the supernatant transferred to a new tube to quantify proteins concentration. Lysates were centrifuged for 10min at 12000rpm at 4°C, and pellets removed. Protein quantification was performed using Bradford Reagent (Bio-rad) following manufacturer’s instructions. Briefly, a BSA standard curve was initially performed with 0; 0,125; 0,25; 0,5; 0,75; 1; 1,5 and 2 mg/mL concentrations. Absorbance was measured in a microplate reader at 595nm. Absorbance of samples was read at the same wavelength and concentration extrapolated by BSA standard curve.
For protein dry transfer, proteins were transferred for nitrocellulose membranes using iBlot™ 2 Gel Transfer Device from Invitrogen (Thermofisher) for 10min (1min at 20V, 4min ate 23V and 5min at 25V).
For wet transfer, proteins were transferred to a nitrocellulose membrane overnight at 40mA and at 4°C.
After the transference, the nitrocellulose membrane was blocked with 5% non-fat milk in TBS 0,1% Tween20, or in 5% BSA in TBS 0,1% Tween20 (depending on antibody dilution buffer) for 1 hour, and then incubated overnight at 4°C with specific primary antibodies (Table 2).
Antibody Dilution Dilution Buffer Source
Anti-GFP Mouse Monoclonal
Antibody 1:1000
5% w/v Milk, 1X
TBS, 0.1% Tween Sigma-Aldrich Anti-GFP
Anti-β-actin Mouse Monoclonal
Antibody 1:5000
5% w/v Milk, 1X TBS, 0.1% Tween
Abcam Anti-beta Actin antibody [mAbcam 8226] (ab8226)
Anti-STAT3 (124H6) Rabbit
Monoclonal Antibody 1:1000
5% w/v Milk, 1X TBS, 0.1% Tween
Cell signaling® STAT3 (124H6) Mouse mAb 9139
Anti-phospho-STAT3 (Ser727)
Rabbit Monoclonal Antibody 1:1000
5% w/v BSA, 1X TBS, 0.1% Tween
Abcam Anti-STAT3 (phospho S727) antibody [E121-31]
(ab32143)
Next day, after wash with TBS 0,1% Tween20, the nitrocellulose membrane was incubated for 1 hour at room temperature with horseradish peroxidase-conjugated (HRP) specific secondary antibodies.
Proteins were detected using Amersham ECL Western Blotting Detection Reagent (GE Healthcare Life Sciences), according to manufacturer’s instructions. Signal was detected on radiographic film (Fujifilm), using Curix60 (AGFA).
3.8. Real-time Reverse Transcriptase Polymerase Chain Reaction (RT-qPCR)
To perform RT-qPCR, 5 x 10⁵ DLD1 and HCT116 cells were cultured in 6-well plates with DMEM
supplemented with 10% FBS and 1% Pen/Strep for 24 hours at 37°C until they were at 60-70% confluence. At that point, cells were transfected using Lipofectamine®3000, as previously described.
For total RNA extraction, cells were lysed 48 hours after transfection following NZY Total RNA Isolation Kit protocol (NZYTech) and RNA was quantified using NanoDrop 2000™ (Thermo Fisher Scientific).
After total RNA extraction, cDNA synthesis was performed following the protocol of NZY M-MuLV First-Strand cDNA Synthesis Kit, separate oligos from NZYTech using Oligo(dT)18.
Finally, NZY RNase H (E. coli) was added to the samples to degrade the RNA that was not converted in cDNA.
After cDNA synthesis, it was performed the qPCR. Samples were analysed in triplicates in Corbett Rotor-Gene 6000 (QIAGEN Rotor-Gene Q). To each reaction, Sybr Green (NZY qPCR Green Master Mix (2x); NZYTECH), nuclease-free water, and primers were mixed with cDNA from samples into qPCR tubes from Qiagen.
Primers were purchased from Invitrogen (Thermo Fisher), except the specific Mouse PLCE1 primer (PPM28139A-200) which is from QIAGEN. The Table 3 is a list of the primers used in qPCR, this list also shows the primers forward and reverse sequences used. Relative mRNA expression levels were normalized to endogenous GAPDH and calculated using the 2-ΔΔCT method.
Primer Name Forward Sequence (5’→3’) Reverse Sequence (5’→3’)
GAPDH AAC ATC ATC CCT GCC TCT ACT G TTG ACA AAG TGG TCG TTG AGG CDH1 (E-cadherin) GGA AAC TCT CTC GGT CCA GCC CCT CAA GTG TTA CCT CAA CDH2 (N-cadherin) GCC CCT CAA GTG TTA CCT CAA AGC CGA GTG ATG GTC CAA TTT VIM (Vimentin) GAA AAC ACC CTG CAA TCT T CCT GGA TTT CCT CTT CGT G TWIST1 (TWIST) CCG GAG ACC TAG ATG TCA TTG CCA CGC CCT GTT TCT TTG
VEGFA GGA GGA GGG CAG AAT CAT CAC GGT CTC GAT TGG ATG GCA GT IL1B (IL-1β) GCC CTA AAC AGA TGA AGT GCT C GAA CCA GCA TCT TCC TCA G
IL6 (IL-6) TAC CCC CAG GAG AAG ATT CC TTT TCT GCC AGT GCC TCT TT TNF (TNF-α) TCA GCC TCT TCT CCT TCC TG GCC AGA GGG CTG ATT AGA GA
18
3.9. Statistical Analysis
Statistical analysis was performed in IBM® SPSS® software package, version 24.0 (IBM Corporation, New York, United States). Descriptive statistics were tabulated according to PLCE1 genotype. For continuous variables (e.g. follow-up months), median and interquartile range were calculated. On the other hand, for categorical variables, proportions were calculated and differences were tested using Chi-Square test.
To calculate the odds of developing colorectal cancer according to PLCE1 genotype (categorical nominal variable), the odds ratio was calculated with respective confidence interval (95%), and its significance was accessed by Chi-Square test. A logistic regression was further performed to adjust the effect estimate (odds ratio) to known risk factors for CRC, as age (categorical ordinal variable) and sex (categorical nominal variable).
Given the unfavourable prognostic implications and biological differences of metastatic cancer, survival outcomes were reported in two independent groups defined as a function of the stage at time of diagnosis (I-III and IV) and patients were analysed in two arms (AA/AG vs. GG) in univariate and multivariate analysis.
Overall survival (OS) was calculated using the Kaplan-Meier method and graphical representations of survival outcomes were reported using Kaplan-Meier graphs. Survival curves of both arms were analysed by log rank test. To explore the prognostic implications of PLCE1 genotype (categorical nominal variable), a univariate and multivariate Cox proportional hazards model was built controlling for known prognostic patients and tumour characteristics, as age (categorical ordinal variable), stage, grade, tumour location, obstruction and perforation, vascular, lymphatic and or neural invasion and the presence of unclear margins at time of diagnosis (categorical nominal variables). In stage IV patients, the multivariate analysis included tumour location, the location of organ metastasis (categorical nominal variables) and age. Median follow-up was balanced throughout the PLCE1 genotypes.
To analyse significant differences in the PLCε Activity Assay and in the relative expression of genes mPLCE1, hCDH1, hCDH2, hVIM, hTWIST, hVEGFA, hIL1B, hIL6, hTNF, hPTGS2, hCXCL1 and hCXCL2 between controls and the polymorphisms AA and GG we performed one-way ANOVA. To determine significant differences in the Cell Viability Assay we performed two-way ANOVA. Tukey Test were performed to determine which conditions had significative differences.
CXCL1 (CXCL-1) GTC CGT GGC CAC TGA ACT GGG GAT GCA GGA TTG AGG C CXCL2 (CXCL-2) GCA GGG AAT TCA CCT CAA GA GGA TTT GCC ATT TTT CAG CA
4. Results and Discussion
4.1. Role of PLCE1 rs2274223 polymorphism in the risk of developing colorectal cancer
Most of the studies about PLCE1 rs2274223 polymorphism approach the importance of this SNP in the risk of developing colorectal cancer. However, there are contradictory results reported52,57–59.
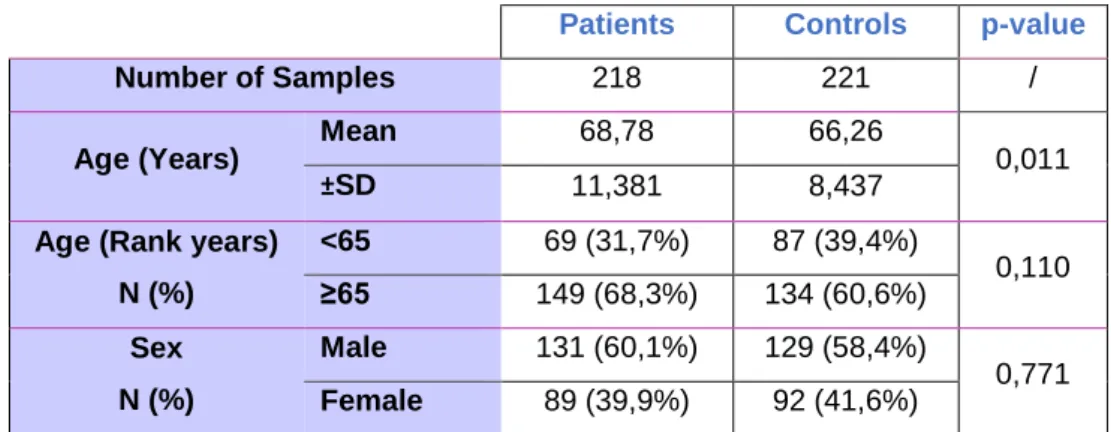
In order to unveil the importance of this polymorphism in the risk of developing colorectal cancer, we enrolled 218 patients with colorectal cancer and 221 healthy controls that were matched by sex and age (Table 4).
Table 4 – Demographical characteristics of patients with CRC and healthy controls enrolled in this study. Differences
between groups were accessed using independent T-test for Age (Years) and Chi-square test for Age (Rank years), Sex. N represents the number of samples, ±SD represents age standard deviation. p-value were calculated using 95% confidence
interval.
Genomic DNA was extracted from patient’s blood sample and genomic DNA from healthy controls was provided to us from Biobanco-IMM. Genotyping was assessed by real-time PCR and the allelic discrimination of patients vs. control samples were plotted considering ΔRn values for allele A and for allele G (Figure 5A and 5B).
Patients Controls p-value
Number of Samples 218 221 /
Age (Years) Mean 68,78 66,26 0,011
±SD 11,381 8,437
Age (Rank years) N (%) <65 69 (31,7%) 87 (39,4%) 0,110 ≥65 149 (68,3%) 134 (60,6%) Sex N (%) Male 131 (60,1%) 129 (58,4%) 0,771 Female 89 (39,9%) 92 (41,6%)
Figure 5 – Allelic discrimination of PLCE1 rs2274223 A>G polymorphism. Plots were drawn for CRC patients (A) and