MASTER OF SCIENCE IN
FINANCE
MASTERS FINAL WORK
DISSERTATION
TAX EFFECTS ON FDI IN PORTUGAL
By ANDRÉ FILIPE SIMÕES PEREIRA
MASTER OF SCIENCE IN
FINANCE
MASTERS FINAL WORK
DISSERTATION
TAX EFFECTS ON FDI IN PORTUGAL
By André Filipe Simões Pereira
Abstract: The objective of this study is to understand and evaluate the extent to which taxes impact foreign direct investment (FDI) flows in Portugal, from 1996 to 2013. Other variables that previous literature considered important, were also tested for economic and legal effects. This work has a cross section data and a panel data, the first uses the total amounts of FDI flows, disregarding the country of origin. The second, contains data that discriminates those flows by country of origin. Two regressions were tested to both data sets, one testing for fiscal effects and other for economic and legal effects. The regression for fiscal effects, show that nominal tax rates and social security as a percentage of gross domestic product (GDP) are negatively correlated with FDI. The regression looking for economic and legal effects, shows that Public investment as a percentage of GDP has a positive correlation with FDI. The results hold for both data sets.
Supervisor:
JOAQUIM MIRANDA SARMENTO
2
1. Introduction
This work aims to assess the importance of taxes in foreign direct investment in Portugal,
from 1996 until 2013. Foreign direct investment is a particular type of investment,
occurring when a company based in one country, the ”home country”, aims to establish
a long lasting interest in another country, the “host country” (Galeza & Chan, 2015). This
investment can be expressed through merging and acquisition (M&A) operations or
either by engaging in a creation of a new facilities in the host country. Although the
concept of long lasting interest may sound vague it is fundamental to differentiate
between FDI and other types of investment, like portfolio direct investment. That is why
international organizations such, OECD and IMF, clearly define that the concept of long
lasting interest, corresponds to the acquisition of, at least, ten per cent of equity. It is
proved that FDI contributes positively to economic development by promoting
employment, productivity increase and know how transference.
The OECD in a report from April 2014, demonstrates that the FDI accumulated stock for
2013 in Portugal, accounts for 58.4% of the Portuguese gross domestic product (GDP).
Although the value is preliminary, it clearly illustrates the relevance of FDI. The
determinants of FDI are very broad, they vary according to the specifications of the
studies, nevertheless, some determinants seem to be more relevant than others, as they
are considered in the majority of studies about FDI flows and location. Determinants
such as levels of taxation, GDP, levels of public investment, unemployment rate,
corruption or other variables of institutional development, exchange rates and others.
3
Portugal, without disregarding other variables that could give a more clear
understanding about the economic and legal effects on FDI. Although the wide range of
variables and methodologies that could be applied, previous literature is unanimous
about the detrimental effect of taxes on FDI. The negative correlation between FDI and
taxes, arises from the fact that taxes are costly and therefore have a detrimental effect
on the rate of return.
Regarding methodology this study uses a cross-section data and a panel data, and two
different OLS regressions. The cross section data, contains data about the total amount
of FDI flows in Portugal, from 1996 to 2013. The panel data regards the same period of
time, and the amount of FDI flows is now discriminated by country of origin. The first
regression aims to capture the effect of fiscal variables, the second capture the effects
of economic and legal variables. This work found that nominal tax rates and social
security are negatively correlated with FDI flows, meaning that, when those variables
increase the FDI tends to decrease. This is true to both data sets. When the economic
legal variables are tested, this study finds that the unit labor costs, the unemployment
rate, public investment and the cost of capital are positively correlated with FDI,
meaning that when those variables increase positive impacts on FDI flows are expected.
The results also show that exchange rates are negatively correlated with FDI. The results
hold to both data sets.
In this introduction, the main objective was to give a clear summary of the following
work. After, in chapter 2, the work proceeds with the literature review, where the
4
previous literature has concluded, will be explained in a more thorough way. In chapter
3 and 4, I will explain the methodology and the data applied, and the main results,
respectively. Finally, in chapter 5 I will present the main conclusions of this work.
2. Literature Review
2.1 FDI: Concept and relevance
Foreign direct investment, also known as by its acronym FDI, is a key component in
global economic integration. Under an adequate policy framework, FDI could be an
important factor of economic and technologic development, financial stability and
promote the transfer of know-how between the recipient (“host”) and the investing
(“home”) economy. FDI is a form of cross border investment with the objective of
establish a lasting interest that a resident enterprise based in one country might have in
an enterprise based in another country. Lasting interest implies a significant degree of
influence on the management of a company. According to the Organization for
Economic Cooperation and Development (OECD) and the International Monetary Fund
(IMF) the ownership of at least 10 % of the voting power by the foreign investor is an
evidence of such long lasting interest (Walker, 1983). The FDI equity ownership is in fact
a critical determinant to distinguish FDI of other types of investment such as portfolio
direct investment (PDI). Foreign portfolio investment (FPI) generally refers to
investment in foreign securities, often channeled through financial intermediaries such
as mutual funds or pension funds (De Mooij & Ederveen, 2003). This type of investment
5
without having control or any influence in the management of the underlying
assets(Walker, 1983). FDI comprises different forms and capital flows. If a company
establishes presence in a foreign market by means of constructing a new factory or
facility, it’s commonly referred as a greenfield direct investment. Instead, the company
may engage in a direct investment by investing or taking over an existing local company,
called brownfield direct investment (Galeza & Chan, 2015).
FDI flows are cross border transactions within a given period of time between companies
that are in a direct investment relationship, and they could be either: (i) by direct
transfers by the parent company, either in the form of equity or debt (ii) retained
earnings by the affiliate. With respect to the types of capital, or strategies by which FDI
could be materialized the most important are (i) real investment implants or equipment
or (ii) trough merging or acquiring existing companies. The last one being the most
significant, as it accounts for more 60 % of all the FDI in developing countries (De Mooij
& Ederveen, 2003)(Kothe et al., 2014). The inward direct investment effects in
economies are positive, being a mechanism of employment increase, productivity
improvement, technology and knowledge transference and is also a promoter of
economic competitiveness and more effective corporate governance (Murrel &
Djankov, 2002), Some studies even suggest that company performance tends to be
higher in foreign owned firms (Barrell & Pain, 1999). The 1990s were extremely
significant in the growth and recognition of the benefits of FDI, growing strongly at rates
above those of global economic growth or global trade (Carol S.Carson, 2003). Some
events occurring during that particular time, namely, the increasing deregulation and
6
to foreign direct investment and exports to become considerably attractive. (Miyake &
Sass, 2000) The relevance of this investment mechanism is undeniable, considering that
the World Economic Forum refers that the world gross domestic product is 20% larger
today than in 1990 because of world expansion of FDI (Forum, 2013). In fact, some
studies refer that the preference of FDI relative to exports it’s due to the absence of
both, trade and transport costs (Billington, 1999). Being FDI one of the most
predominant features of today’s global economy, many countries regard it as an
important factor for economic development, since it is usually linked to increasing
capital, but also technology, marketing, and management development. (Cheng et al.,
2000).
2.2 FDI variables
So FDI become a relevant field of study, especially in order to access what variables are
important to investment. According to specifications of the model used, the depth of
the study, nature of the business or the particularities of the countries, there’s a wide
range of variables that could be under analysis. Nevertheless, there are some variables
that seem to appear in almost every study about what FDI location. Taxes are a very
common variable across many studies on FDI location, and has stated by (Altshuler et
al., 2000) multinationals’ FDI has been an active area of research in international
taxation and innumerous studies indicate that taxes apply a strong influence in FDI
location decisions. It’s common for a country to impose different taxes simultaneously,
such as personal and corporate income taxes, sales taxes, value-added taxes, excise
7
the effects of taxation on investment and economic activity, in which FDI is included
(Hines Jr & Desai, 2001). The GDP and respective rate of growth are commonly used as
proxys to size and rate of growth of the market. Corruption and other specific country
risks are, as suggested by (Henisz, 2000), important factors of institutional development
and political risk. Exchange rates are considered an important factor shaping FDI
decisions, as stated by (Xing & Wan, 2004), a devaluation of the host country currency
against the home country currency could improve competitiveness and attractiveness
of the home country and boost FDI inflows. Labor costs are usually negatively related to
FDI, as higher costs are related with lower profitability. Still, companies try to minimize
this factor and not compromising labor productivity (Bevan & Estrin, 2004). Public
expenses in the host country as (Bénassy-Quéré et al., 2003) argue, aims to assess the
size of the public sector. It is expected that higher amounts of public investment to be
an attractive factor for FDI, as it is likely to be a proxy for the building of public goods/
infrastructures. R&D expenditures and the level of education are expected to reflect the
level of general technological development of a certain economy. Both have an positive
impact in FDI flows(Sun et al., 2002). Cost of capital in (Bevan & Estrin, 2004) indicates
that relative high costs of capital seem to have no significant impact in FDI flows. One
explanation suggested is the fact that companies could rely on their financial resources
or in home financial markets.
2.3 Importance of taxes in FDI
Intuitively, it’s commonly accepted the fact that higher levels of taxation could
8
is to have profit or maximize the rate of return. If taxes have a negative contribute to
profits it is reasonable to think that companies address the impact of taxes carefully.
This general idea is supported by innumerous studies and has been a subject of long
discussion in investment location as (De Mooij & Ederveen, 2003) explain, the impact of
taxes could be either by (i) the effect of taxes in the amount of dividends repatriated to
parent companies (ii) differences in statutory tax rates may lead to profit shifting by debt
contracts or manipulation of transfer prices (iii) the allocation of investment is strongly
determined by taxes on the overall. In (Hines Jr & Desai, 2001), three ways in which
higher taxes discourage FDI are presented, such as (i) higher tax rates tend to increase
total costs (ii) profit taxes tend to encourage firms to substitute capital inputs to tax
deductible inputs such as labor (iii) multinational firms also dispose of means to allocate
taxable income to lower tax countries, so the attractiveness of a country with low levels
of taxation could be justified just by the fact that reallocates taxable income from higher
taxation countries. Adding to this, should be taken in to account the fact that FDI is an
activity that may be subject to double taxation. A subsidiary is subjected to corporate
tax in the destination country and the parent company may also be taxed in the home
country. This problem may result in strong discouragement for companies to invest
abroad, therefore is common to countries to have a system of tax credit or tax
exemption. In the credit tax credit system, the taxes paid in the subsidiary country are
subtracted to the taxable amount due in the parent country. In this case, the profits are
taxed only when the profits are repatriated/received to the home county. In the
exemption system, the income is only subjected to the foreign country corporate tax,
9
the home tax system is an decisive factor in FDI is not clear, as (Hines, 1996) argues,
investors from exemption countries seem to reduce their investment shares comparing
to tax credit investors by 7-9%, for 1% variation in the tax rate, just as (Bénassy-Quéré
et al., 2003) who finds that the impact of tax schemes on FDI flows are relevant. Others
such as (Slemrod, 1990) finds no evidence that differences in tax schemes could
influence FDI flows.
2.4 Studies about taxation effects on FDI
As mentioned previously, the studies about the impact of FDI are not homogeneous, in
the way that are numerous models and wide range of variables that can be used in order
to assess the most important variables in investment location decisions. Even though,
when the tax variable is tested it is almost always negatively correlated with FDI,
regardless of what tax rate used in the model. For instance, in (Bénassy-Quéré et al.,
2003) the measure for tax variable is computed as the difference between corporate tax
rates in the host country and in the investing country, and four tax variables are used,
namely, statutory tax rates, average effective tax rates, marginal tax rates and apparent
effective tax rates. The reason behind is that average and statutory rates are relevant
for discrete location decisions and the marginal effective rates influences the decision
of increasing existing capital. The main conclusions of their study is that small large tax
differentials tends to promote important FDI outflows, and that the impact of positive
tax differentials is depend of the tax scheme undergoing in the home country.
(Billington, 1999) uses the statutory tax rate concludes that it has a negative effect in
10
negative impact of the corporate tax rate on FDI inflows is also founded by (Cassou,
1997) (Altshuler et al., 2000), and (Boskin & Gale, 1987). Studies about the impact of
corporate income and indirect taxes, such as (Hines Jr & Desai, 2001) , refers that both
taxes imply costs and are associated with low levels of FDI and output of American firms.
The findings by (Slemrod, 1990), support the negative effect of effective tax rates on FDI
by transfer of new funds, but not in retained earnings.
3. Methodology and Data
This study aims to access the impact of taxes on FDI in Portugal, and the relative
importance of taxes when compared with other variables. In the model used, the inputs
are a set of variables considered important and in line with previous studies on FDI. The
period of time under analysis comprises the years from 1996 until 2013. Two types of
regressions were done, for two different databases. The first regression tests for the tax
effects and the second tests for political institutional effects.
The first data set accounts for the total amount of FDI in Portugal regardless of its origin
from 1996 to 2013, and the second discriminates the amounts of FDI flows according to
country of origin, also from 1996 to 2013. For this second data set, the values of FDI are
discriminated by country of origin, for that same time period. The depend variable for
the first data set is the annual amount, in millions of euros, of foreign direct investment
11
is the annual amount of foreign direct investment flows in Portugal between 1996 and
2013, but discriminated by country of origin. The data was obtained from the AICEP1.
The independent variables were divided in two categories: tax effect variables and
economic/legal effect variables.
With respect to the tax effect variables, the decision was to incorporate nominal
corporate tax rate (ctax nominal) and the effective corporate tax rate (ctax efective,
social security as a percentage of GDP (ssecurity perc GDP).
The ctax nominal stands for the nominal corporate tax rate, it is extracted from the
Taxation Trends report from The European Commission. Most of data is extracted from
the 2013 Taxation Trends report, except for the years of 1996 and 1997, which are from
the 1997 report. This nominal tax rate is the sum of the general tax rate plus excise taxes,
applied to the income received by companies in Portugal. The sign is expected to be
negative.
The ctax effective stands for the effective corporate tax rate, it is also obtained from the
Taxations Trends report of the European Commission. The sign is expected to be
negative.
The ssecurity perc GDP assesses the burden that companies working in Portugal, engage
with the Social Security expenses. The data concerning this variable, also was extracted
1 Aicep Portugal Global – Trade and Investment Agency is a government business entity, created in 2007,
focused in encouraging the best foreign companies to invest in Portugal and contribute to success of Portuguese companies abroad in their internationalization processes or export activities.
12
of the Taxation Trends reports from the European Commission. The signal is expected
to be negative.
The unemployment rate data is obtained from the INE database. The literature is not
unanimous about the sign and interpretation of this variable. As some, such as (Cassou,
1997), argue that a negative signal is expected, because countries with high
unemployment rates tend to have structural problems in their economies, and generally
this countries are less attractive to foreign investors. Others such as (Billington, 1999)
and (Devereux & Freeman, 1995) state that the unemployment rate could work as proxy
for labor availability, therefore, a positive sign could be expected and, consequently,
unemployment rates and FDI flows could be positively correlated.
The CTU stands for the unitary labor costs. It measures the average cost of labor per unit
of output and are calculated as the ratio of total labor costs to real output. The data
used is from the Banco de Portugal database. The unit of measure is a rate of change.
Labor costs are usually negatively correlated with FDI, but higher labor cost may be
offset by higher productivity. In order to avoid this problem, the unitary labor costs are
assumed to me a more appropriate measure because it already incorporates
productivity (Billington 1999). The sign is expected to be negative.
The values for the annual exchange rate for EUR/USD was obtained from the time series
of the Bank of England Official Statistics, with daily frequency, and then an annual
average was computed. The data is presented in euros. According to the literature
exchange rates do exert strong influence in the allocation of FDI (Froot & Stein, 1991;
13
The variable SPREAD German bunds 10y aims to access the cost of capital. It is the result
of the German bund yield minus the Portuguese OT’S yield. The data from 1999 to 2013
is obtained from the Bloomberg databases. For the years 1998 and 1999 the procedure
was the following: the spread was calculated on a daily basis and then was computed
the average for the year. Regarding the years of 1996 and 1997, the data from the
Portuguese OT’S was available on a daily frequency, but for the German bunds the data
available was only available in monthly frequency, so I decided to compute the monthly
averages for the Portuguese OT’s then calculate the monthly spread, then average that
to obtain the yearly spread. The data from the years 1996, 1998, 1997, 1999 the data on
the Portuguese OT’s is from the Banco de Portugal database and for the German bunds
was taken from Eurostat and from the Global Yields database. Although (Bevan & Estrin,
2004) considers that this variable does not affect FDI, this study will test it. A negative
signal is expected for this variable.
Corruption when trying to capture the effects of corruption the data on that variable
was extracted from the World Bank database. In order to capture important factors of
institutional development and political risk, corruption or other specific country risk
measure, is commonly used (Henisz, 2000). The unit value is in percentiles and this
variable is expected to have negative signal.
The public investment perc GDP variable was assumed to be the gross capital formation
obtained from the United Nations Financial Statistics. The public expenses in the host
country as (Bénassy-Quéré et al., 2003) argue, aims to assess the size of the public
14
to FDI, as it is likely to be a proxy for public goods/infrastructures. It is expected to have
positive signal.
Regarding the methodology, and in accordance to the literature an OLS model was used.
It was also tested a GLM model and a Tobin model, both of them without relevant
results. Two different regressions were applied to the two data sets, the first tries to
capture the fiscal effect (1), and the second the economic/legal effect (2).
(1)
𝑦𝑡 = 𝛽0+ 𝛽1 𝑐𝑡𝑎𝑥 𝑛𝑜𝑚𝑖𝑛𝑎𝑙 + 𝛽2 𝑐𝑡𝑎𝑥 𝑒𝑓𝑓𝑒𝑐𝑡𝑖𝑣𝑒 + 𝛽3 𝑠𝑠𝑒𝑐𝑢𝑟𝑖𝑡𝑦 𝑝𝑒𝑟𝑐 𝐺𝐷𝑃 + 𝜇𝑖
In this regression (1), we account for the fiscal effects. Being ctax nominal the nominal
corporate tax rate, ctax effective the effective corporate tax rate, ssecurity perc GDP the
social security as a percentage of GDP.
(2)
𝑦𝑡= 𝛽0+ 𝛽1 𝐶𝑇𝑈 + 𝛽2𝑒𝑥𝑐ℎ𝑎𝑛𝑔𝑒 𝑟𝑎𝑡𝑒 𝐸𝑈𝑅|𝑈𝑆𝐷 + 𝛽3 𝑈𝑛𝑒𝑚𝑝𝑙𝑜𝑦𝑚𝑒𝑛𝑡 𝑟𝑎𝑡𝑒
+ 𝛽4 𝑃𝑢𝑏𝑙𝑖𝑐 𝑖𝑛𝑣 % 𝐺𝐷𝑃 + 𝛽5 𝐶𝑜𝑟𝑟𝑢𝑝𝑡𝑖𝑜𝑛
+ 𝛽6 𝑆𝑃𝑅𝐸𝐴𝐷 𝐺𝑒𝑟𝑚𝑎𝑛 𝐵𝑢𝑛𝑑𝑠 10𝑦 + 𝛽7
In this regression (2), the objective is to capture the economic/legal effects. Being CTU
the unit labor costs, exchange rate EUR/USD the exchange rate between Euro and US
dollar, unemployment rate, public inv % GDP the public investment as a percentage of
GDP, Corruption being the variable that captures country legal institutional specific risks,
and the spread German Bunds 10y which is the difference between the German bunds
15
First, the regressions were applied to the first data, the one that accounts for the total
annual amount of foreign direct investment. For the fiscal effects regression the
descriptive statistics results were the following:
TABLE I - Table of descriptive statistics on dataset 1.
The procedure was replicated to the second set of data, testing with year and country
effects.
TABLE II - Table of descriptive statistics on the dataset 2.
Variable Obs Mean Std. Dev. Min Max
FDI 18 27427,66 11789,76 4629,529 47655,79 ctaxnominal 18 31,85556 4,639628 26,5 39,6 ctaxefective 18 26,26611 4,589524 17,1 33,4 ssecurity perc GDP 18 8,597962 1,553216 2,963313 10,1 Unemployment rate 18 8,022222 3,657475 3,9 16,2 CTU 18 1,927778 2,284682 -3,2 4,3
exchange rate EUR/USD 18 1,213275 0,170214 0,8960736 1,471182
SPREAD german bunds 10y 18 166,4799 270,5923 -4,308077 903,3621
Corruption 18 83,75556 3,73209 78,5 91,2
Public investment perc GDP 18 4,189992 0,9511732 2,152964 5,568281
Variable Obs Mean Std. Dev. Min Max
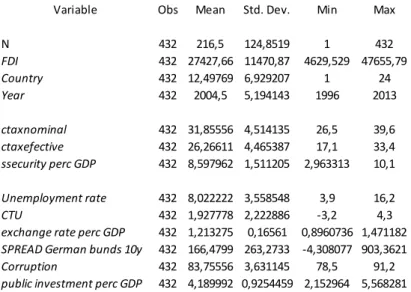
N 432 216,5 124,8519 1 432 FDI 432 27427,66 11470,87 4629,529 47655,79 Country 432 12,49769 6,929207 1 24 Year 432 2004,5 5,194143 1996 2013 ctaxnominal 432 31,85556 4,514135 26,5 39,6 ctaxefective 432 26,26611 4,465387 17,1 33,4 ssecurity perc GDP 432 8,597962 1,511205 2,963313 10,1 Unemployment rate 432 8,022222 3,558548 3,9 16,2 CTU 432 1,927778 2,222886 -3,2 4,3
exchange rate perc GDP 432 1,213275 0,16561 0,8960736 1,471182 SPREAD German bunds 10y 432 166,4799 263,2733 -4,308077 903,3621 Corruption 432 83,75556 3,631145 78,5 91,2 public investment perc GDP 432 4,189992 0,9254459 2,152964 5,568281
16
The potential problems that could arise, could be due to the specificity of the data itself.
The first data, the total annual amount of FDI in Portugal is a cross section data, on the
contrary the second data is an example of panel data. The problem that could arise with
this first type of data is multicollinearity.
TABLE III - Correlation matrix for the tax effect variables on dataset 1.
TABLE IV - Correlation matrix on the economic/legal effect variables on dataset 1.
In the second set of data, when looking for heteroscedasticity using the Breusch-Pagan
and the Wald test, no evidence of heteroscedasticity was found. It is important to notice
that, some variables were presenting multicollinearity problems. To address that
problem, they were used in different tests. A Ramsey regression equation specification
error test was applied, no evidence of omitted variables was found.
Bellow in Figure I, we can see that the probability density of the random variables in
data set 1. The line of the Kernel density estimate is not far from a normal density
distribution.
ctaxno~l ctaxef~e corpta~P ssecur~P
ctaxnominal 1
ctaxefective 0,1644 1
corptax perc GDP 0,1363 0,3161 1
ssecurity perc GDP 0,2423 -0,1132 0,2865 1
Corrup~n GDPgro~h Unempl~e CTU exchan~D SPRE~10y Public~P RDExpe~s oilpri~s
Corruption 1
GDPgrowth 0,1211 1
Unemployment rate -0,3509 -0,6563 1
CTU 0,0427 -0,7476 0,2801 1
exchange rate EUR/USD 0,3803 -0,0151 -0,3309 0,5161 1
SPREAD German bunds 10y -0,1342 -0,6941 0,8636 0,2465 -0,2318 1
Public inv perc GDP -0,2132 -0,5836 0,6525 0,3455 0,0662 0,8322 1
RD expenditures 0,3785 -0,4024 0,2805 0,5224 0,6025 0,2882 0,4877 1
17
FIGURE I - Kernel density graphic for the data set 1.
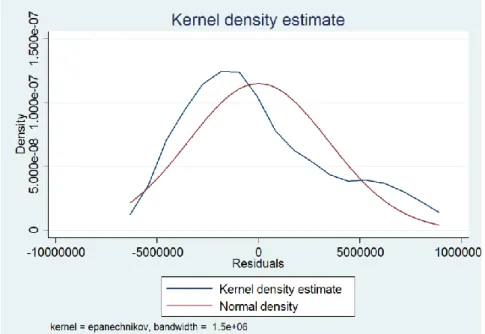
In Figure II, we present the Kernel density estimate for the data set 2. Although, the
Kernel density estimate line is far from the Normal density line in the left portion of
the graphic, after it almost mimics the overall tendency of the Normal density.
18
4. Results
4.1 Data 1
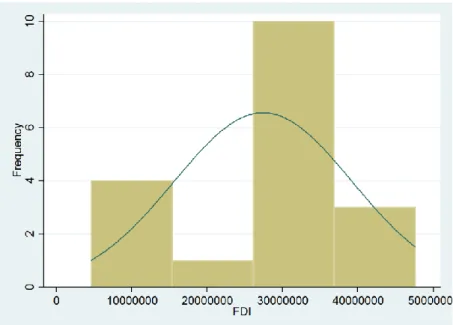
For the data set 1, the histogram presents a relatively bell shaped format, indicating the
FDI follows a normal distribution. Still, the Kernel estimation is more accurate to reflect
the distribution of the underlying variable, yielding a smoother density function. The
histogram is presented below, on Figure III.
FIGURE III - Histogram on data 1.
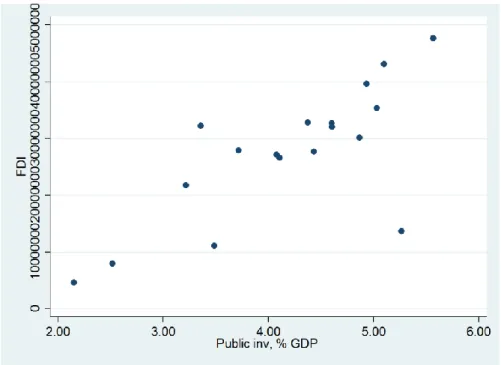
In Figure IV, a scatter plot relating FDI and the public investment variable is presented.
The pattern of dots from lower left side to upper right side, it’s an indicator of a positive
19
FIGURE IV - Scatter plot of the Public Investment and FDI for data set 1.
The results on the regression for the fiscal effects on the first dataset are the ones below,
on Table V.
TABLE V - Results on the fiscal effects regression on the dataset 1.
The results on this regression show that the variable ctax nominal and ssecurity perc
GDP have a negative signal, showing that they are negatively correlated with the FDI.
(1)
VARIABLES FDI
ctax nominal -1.9800e+06*** (280,257.8993) ctax efective 507,342.1454* (285,894.5360) ssecurity perc GDP -269488.8996 (647,662.8352) Constant 7.9492e+07*** (1.5159e+07) Observations 18 R-squared 0.6118
Robust standard errors in parentheses *** p<0.01, ** p<0.05, * p<0.1
20
These results are in accordance with the previous literature. Unexpectedly, the variable
ctax effective was expected to also have a negative signal, which is not the case.
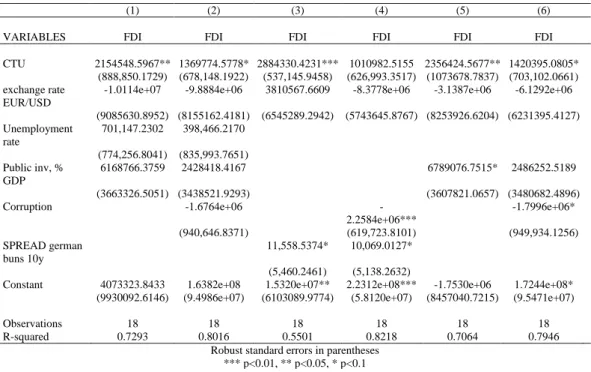
TABLE VI - Results on the economic/legal effects on the regression on the dataset 1.
On the second regression, where the economic/legal effects are accounted for, the
variables CTU, unemployment rate, public investment % GDP and SPREAD german bunds
10y have a positive signal. Regarding CTU, the positive signal goes against what was
anticipated. The SPREAD german bunds 10y is another variable that shows a sign that
was not expected. Indeed, a higher spread may imply may imply a higher cost of capital
in the “host country”. The other variables positively correlated with FDI are in
accordance with the literature. The variables with negative signal, Exchange rate
EUR/USD and Corruption, were expected to have that negative correlation with FDI.
(1) (2) (3) (4) (5) (6)
VARIABLES FDI FDI FDI FDI FDI FDI
CTU 2154548.5967** 1369774.5778* 2884330.4231*** 1010982.5155 2356424.5677** 1420395.0805*
(888,850.1729) (678,148.1922) (537,145.9458) (626,993.3517) (1073678.7837) (703,102.0661) exchange rate
EUR/USD
-1.0114e+07 -9.8884e+06 3810567.6609 -8.3778e+06 -3.1387e+06 -6.1292e+06
(9085630.8952) (8155162.4181) (6545289.2942) (5743645.8767) (8253926.6204) (6231395.4127) Unemployment rate 701,147.2302 398,466.2170 (774,256.8041) (835,993.7651) Public inv, % GDP 6168766.3759 2428418.4167 6789076.7515* 2486252.5189 (3663326.5051) (3438521.9293) (3607821.0657) (3480682.4896) Corruption -1.6764e+06 -2.2584e+06*** -1.7996e+06* (940,646.8371) (619,723.8101) (949,934.1256) SPREAD german buns 10y 11,558.5374* 10,069.0127* (5,460.2461) (5,138.2632)
Constant 4073323.8433 1.6382e+08 1.5320e+07** 2.2312e+08*** -1.7530e+06 1.7244e+08*
(9930092.6146) (9.4986e+07) (6103089.9774) (5.8120e+07) (8457040.7215) (9.5471e+07)
Observations 18 18 18 18 18 18
R-squared 0.7293 0.8016 0.5501 0.8218 0.7064 0.7946
Robust standard errors in parentheses *** p<0.01, ** p<0.05, * p<0.1
21
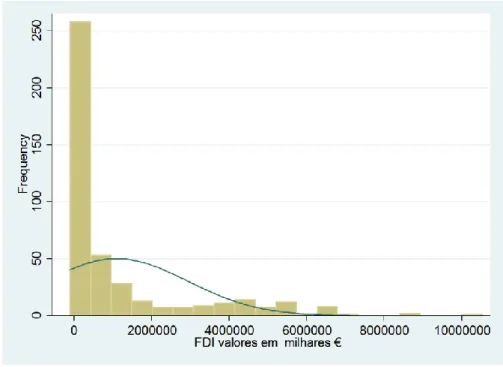
4.2 Data 2
The following histogram, represented on Figure V, is skewed right indicating that the
probability density function does not follow a normal distribution.
FIGURE V - Histogram for FDI on data set 2.
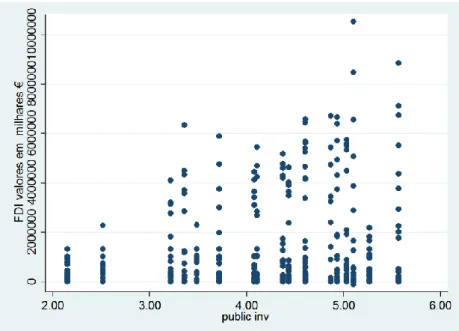
The scatter plot below, shows the correlation between the public investment variable
and FDI. As in the Figure IV, the same positive correlation is found, as the pattern of the
22
FIGURE VI - Graphic of the scatter plot of the Public investment and FDI for data set 2.
The Table VII shows the regression for the fiscal effects for the second dataset.
Table VII - Results of the regression of the fiscal effects on dataset 2.
As in the first regression for the dataset 1, the variables ctax nominal e ssecurity perc
GDP shown a negative sign, as expected. The ctax effective, as in the first regression,
shows an unexpected signal.
(1) (2) (3)
VARIABLES FDIvaloresemmilhares FDIvaloresemmilhares FDIvaloresemmilhares
ctax nominal -77,237.5509*** -77,226.3793*** -38,375.8457 (16,580.9479) (11,601.9717) (60,848.7859) ctax efective 12,448.8662 12,466.9447 145,404.9160** (10,092.6494) (11,453.6596) (66,001.7415) ssecurity perc GDP -10,465.3240 -10,480.9973 119,807.4471** (64,248.9170) (34,404.6292) (47,031.2290) Constant 3323949.9858*** 6269687.4414*** 1092522.1540 (731,175.2027) (547,715.5974) (3712683.8191) Observations 432 432 432 R-squared 0.0364 0.6987 0.7272
Robust standard errors in parentheses *** p<0.01, ** p<0.05, * p<0.1
23
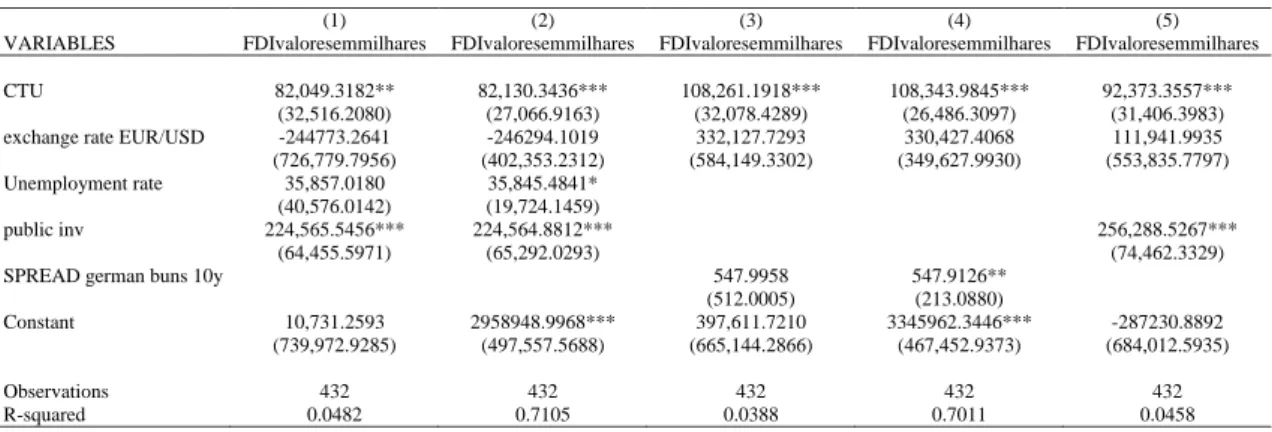
Table VIII - results of the regression of the economic/legal effects on the dataset 2.
The regression accounting for the economic/legal effects the second dataset, exhibit the
same result like when this effects were tested for the first dataset.
In addition, for the second set of data, it was applied a Hausman test. For a panel data,
this test can be used to differentiate fixed effects model and random effects model in
panel data. In this case the, the Hausman test suggested that the random effects model
was preferred. In this test, usually the value of 0,1 is used has the frontier between fixed
effects and random effects.
(1) (2) (3) (4) (5)
VARIABLES FDIvaloresemmilhares FDIvaloresemmilhares FDIvaloresemmilhares FDIvaloresemmilhares FDIvaloresemmilhares
CTU 82,049.3182** 82,130.3436*** 108,261.1918*** 108,343.9845*** 92,373.3557***
(32,516.2080) (27,066.9163) (32,078.4289) (26,486.3097) (31,406.3983)
exchange rate EUR/USD -244773.2641 -246294.1019 332,127.7293 330,427.4068 111,941.9935
(726,779.7956) (402,353.2312) (584,149.3302) (349,627.9930) (553,835.7797)
Unemployment rate 35,857.0180 35,845.4841*
(40,576.0142) (19,724.1459)
public inv 224,565.5456*** 224,564.8812*** 256,288.5267***
(64,455.5971) (65,292.0293) (74,462.3329)
SPREAD german buns 10y 547.9958 547.9126**
(512.0005) (213.0880)
Constant 10,731.2593 2958948.9968*** 397,611.7210 3345962.3446*** -287230.8892
(739,972.9285) (497,557.5688) (665,144.2866) (467,452.9373) (684,012.5935)
Observations 432 432 432 432 432
24
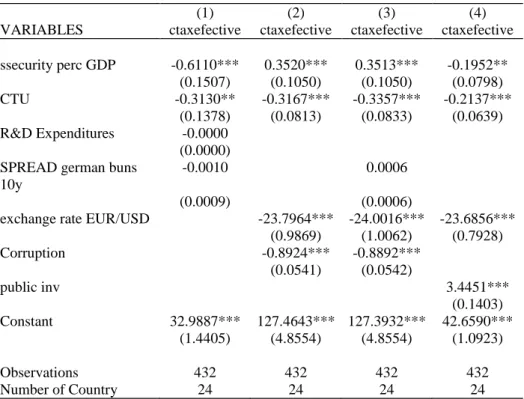
Table IX - Hausman test.
5. Conclusions
The objective of this work was to understand the extent to which taxes and other
variables have influenced FDI in Portugal from 1996 to 2013. The previous literature, has
unanimously consider that taxes do exert a negative impact on FDI. Furthermore, this
work also tries to capture the effects of economic legal variables. For two data sets, I
have applied two different OLS regressions, one accounting for fiscal effects, and other,
for both economic and legal effects. The results of the two regressions were similar for
the two data sets. For fiscal effects, I have found that effective tax rate are positively
correlated with FDI and nominal tax rates and social security as a percentage of GDP
have a negative impact in FDI. When testing for the economic/legal effects, the
exchange rate and corruption are negatively correlated with FDI. The unit labor costs,
(1) (2) (3) (4)
VARIABLES ctaxefective ctaxefective ctaxefective ctaxefective ssecurity perc GDP -0.6110*** 0.3520*** 0.3513*** -0.1952** (0.1507) (0.1050) (0.1050) (0.0798) CTU -0.3130** -0.3167*** -0.3357*** -0.2137*** (0.1378) (0.0813) (0.0833) (0.0639) R&D Expenditures -0.0000 (0.0000) SPREAD german buns
10y
-0.0010 0.0006
(0.0009) (0.0006)
exchange rate EUR/USD -23.7964*** -24.0016*** -23.6856*** (0.9869) (1.0062) (0.7928) Corruption -0.8924*** -0.8892*** (0.0541) (0.0542) public inv 3.4451*** (0.1403) Constant 32.9887*** 127.4643*** 127.3932*** 42.6590*** (1.4405) (4.8554) (4.8554) (1.0923) Observations 432 432 432 432 Number of Country 24 24 24 24
25
public investment, the spread and unemployment rate have been found to be positively
correlated with FDI. Nevertheless, except for unemployment rate and public
investment, the signal of this variables was unexpected and against some of the previous
literature. As mentioned before, the studies about FDI are flexible regarding the
variables tested, the objectives of the studies and economic sectors under analysis so,
my study, as others on this subject presents some limitations. The most noticeable could
be, the small time frame of this study, the non-differentiation of FDI flows by different
industry groups, because some industries might be more sensible to some variables
considered on this study than others, and the fact that this study concerns only one
26
References:
Altshuler, R., Grubert, H. & Newlon, T., 2000. Has US investment abroad become more
sensitive to tax rates?, Available at: http://www.nber.org/chapters/c10718.pdf.
Barrell, R. & Pain, N., 1999. Domestic institutions , agglomerations and foreign direct investment in Europe. European Economic Review, 43.
Bénassy-Quéré, A., Fontagné, L. & Lahrèche-Révil, A., 2003. Tax Competition, Foreign Direct Investments and Growth: Using the Tax System to Promote Developing Countries. SSRN Electronic Journal, 17.
Bevan, A. a. & Estrin, S., 2004. The determinants of foreign direct investment into European transition economies. Journal of Comparative Economics, 32(4), pp.775–787.
Billington, N., 1999. The location of foreign direct investment: an empirical analysis.
Applied Economics, 31(1), pp.65–76.
Blonigen, B.A., 2005. A Review of the Empirical Literature on FDI Determinants.
Atlantic Economic Journal, pp.383–403.
Boskin, M.J. & Gale, W.G., 1987. New Results on the Effects of Tax Policy on the International Location of Investment. National Bureau of Economic Research
Working Paper Series, No. 1862, pp.201–219. Available at:
http://www.nber.org/papers/w1862.
Carol S.Carson, 2003. Foreign Direct Investment Trends and Statistics. International
Monetray Fund Report.
Cassou, S.P., 1997. cassou the link between tax rates and fdi.pdf,
Cheng, L.K. et al., 2000. Host country reforms and FDI inflows: how much difference do they make? Most, 51(January), pp.115–135. Available at:
http://www.nber.org/chapters/c7742.pdf.
Devereux, M.P. & Freeman, H., 1995. The impact of tax on foreign direct investment: Empirical evidence and the implications for tax integration schemes. International
Tax and Public Finance, 2(1), pp.85–106.
Forum, W.E., 2013. Foreign Direct Investment as key driver for Trade, Growth and
Prosperity: The case for a multilateral agreement on investment, Available at:
http://www3.weforum.org/docs/GAC13/WEF_GAC_GlobalTradeFDI_FDIKeyDriver _Report_2013.pdf.
27
Froot, K.A. & Stein, J.C., 1991. Exchange rates and foreign direct investment: An Imperfect Capital Markets Approach. Quarterly Journal of Economics, CVI(4).
Galeza, T. & Chan, J., 2015. What Is Direct Investment? - BACK TO BASICS - Finance & Development September 2015. , pp.34–35.
Henisz, W.J., 2000. The Institutional Environment for Multinational Investment. Journal
of Law, Economics, and Organization, 16(2), pp.334–364.
Hines, J.R., 1996. altered taxes taxes and the location of foreign direct investment in america.pdf. The American Economic Review, 86(5).
Hines Jr, J.R. & Desai, M., 2001. Foreign Direct Investment in a World of Multiple Taxes by. Journal of Public Economics, (July).
Kothe, E. et al., 2014. International investment stumbles into 2014 after ending 2013 flat. FDI IN FIGURES, (April), pp.1–12.
Miyake, M. & Sass, M., 2000. Recent Trends in Foreign Direct Investment,
De Mooij, R. a. & Ederveen, S., 2003. Taxation and foreign direct investment: A synthesis of empirical research. International Tax and Public Finance, 10(6), pp.673–693.
Murrel & Djankov, 2002. Enterprise Restructuring in Transition : A Quantitative Survey.
Journal of Economic Literature, XL(September), pp.739–792.
Slemrod, J., 1990. Tax Effects on Foreign Direct Investment in the United States : Evidence from a Cross-Country Comparison. National Bureau of Economic
Research, Taxation i(January), pp.79–122.
Sun, Q., Tong, W. & Yu, Q., 2002. Determinants of foreign direct investment across
China,
Walker, J., 1983. OECD Benchmark Definition of Foreign Direct Investment’, Available at:
http://scholar.google.com/scholar?hl=en&btnG=Search&q=intitle:BENCHMARK+ DEFINITION+OF+FOREIGN+Direct+investment#0.