ASSESSMENT OF THE QUALITY OF MOBILE
TELECOMMUNICATIONS SERVICES
Catarina Cecílio Martins
Dissertation submitted as partial requirement for the conferral of
Master in Management
Supervisor:
Prof.Eurico Brilhante Dias, Assistant Professor, ISCTE Business School, Marketing, Operations and General Management Department
ABSTRACT
Over the past decades, the telecommunications sector has grown both in terms of revenues, both in terms of number of clients, which in turn has meant that the demand for the quality of services provided by mobile network operators increased.
Given the above, this thesis aims to assess how clients perceive the perceived quality of the mobile network operator service through a quality measurement tool adapted to the respective sector (SERVPERF).
With regard to methodology, an online questionnaire was applied based on SERVPERF instrument developed by Cronin Jr. and Taylor (1992), adding some items due to the peculiarity of mobile telecommunications services. In order to process the data obtained, the Statistical Package for Social Sciences ("SPSS") version 22 was used exclusively, which allowed for various statistical calculations.
With regard to the results, there is a general positive perception of the quality of mobile telecommunications services, highlighting the Communication dimension, but only with a very little significant difference regarding the Tariff dimension. In addition, and after having performed the Principal Component Analysis ("PCA") the initial eight dimensions became only three, namely: Service Provider, Accessibility and Comunication and Tangibility.
Lastly, some recommendations were proposed to improve the perceived quality of service being studied, regarding a proximity policy, the implementation of the service, the disclosure / provision of information and the facilities.
Keywords: Service Quality; Mobile Telecommunications; Customer Satisfaction;
SERVPERF
RESUMO
Ao longo das últimas décadas, o setor das telecomunicações tem crescido quer a nível de receitas, quer a nível do número de clientes, que por sua vez fez com que a exigência para com a qualidade dos serviços prestados pelos operadores de rede móvel aumentasse.
Face ao exposto, a presente dissertação tem como objetivo principal avaliar como os clientes percecionam a qualidade percebida do serviço dos operadores de rede móvel através de uma ferramenta de medição de qualidade adaptada ao respetivo setor (SERVPERF).
Relativamente à metodologia, foi aplicado um questionário via online baseado no instrumento SERVPERF desenvolvido por Cronin Jr. e Taylor (1992), acrescentando alguns itens devido à peculiaridade dos serviços de telecomunicações móveis. De forma a tratar os dados obtidos, recorreu-se exclusivamente ao programa Statistical Package for Social Sciences (“SPSS”) versão 22, o qual permitiu a realização de diversos cálculos estatísticos.
No que diz respeito aos resultados, verifica-se de uma forma geral que a perceção da qualidade dos serviços de telecomunicações móveis é positiva, destacando-se a dimensão Communication, contudo apenas com uma diferença pouco significativa face à dimensão Tariff. Por último, foram propostas algumas recomendações de melhoria da qualidade percebida do serviço em estudo, relativamente a uma política de proximidade, à execução do serviço, à divulgação/disponibilização de informações e às instalações.
Palavras-chave: Qualidade no Serviço; Telecomunicações Móveis; Satisfação do Cliente;
SERVPERF
ACKNOWLEDGEMENTS
To all who participated in my personal, school and academic training. This is the result of your dedication. Thank you.
INDEX
ABSTRACT ... i RESUMO ... ii ACKNOWLEDGEMENTS ... iii INDEX ... iv LIST OF ABBREVIATIONS ... x 1. INTRODUCTION ... 1 1.1. Theme framework ... 1 1.2. Research objectives ... 2 1.3. Research problem ... 3 1.4. Thesis structure ... 3 2. LITERATURE REVIEW ... 52.1. Concept of Service Quality ... 5
2.2. SERVQUAL Instrument ... 8
2.3. SERVPERF Instrument ... 12
2.4. Attributes of service quality ... 13
3. TELECOMMUNICATION SERVICES ... 20
3.1. Framework ... 20
3.2. Global telecommunication services ... 20
3.2.1. Market segmentation by category ... 22
3.2.2. Market segmentation by geographic area ... 23
3.2.3. Major telecommunications service companies ... 23
3.3. Mobile services in Portugal ... 24
3.3.1. Mobile service penetration rate ... 24
3.3.2. Level of use of mobile services ... 25
3.3.2.1. Mobile stations / Active user equipments ... 25
3.3.2.2. Typical service users of mobile broadband... 27
3.3.2.4. Short Message Service (“SMS”) ... 28
3.3.2.5. Multimedia Messaging Service (“MMS”), video calls e mobile TV, WAP ... 29
3.3.2.6. . International Roaming: Voice, SMS and Internet ... 30
3.3.3. STM providers ... 30
4. RESEARCH METHODOLOGY ... 32
4.1. Conceptual models ... 32
4.2. Dimensions of service quality ... 33
4.3. Independent variables ... 34
4.3.1. Independent variables that characterize the sample ... 34
4.3.2. Independent variables that characterize the use of mobile phones ... 35
4.4. Data collection methodology ... 35
5. ANALYSIS OF THE RESULTS ... 37
5.1. Sample characterization ... 37
5.1.1. Gender and age group ... 38
5.1.2. Level of education ... 38
5.1.3. Employment Status ... 39
5.1.4. Household income in 2015 ... 39
5.1.5. Mobile phone ownership ... 40
5.1.6. Network operator ... 40
5.1.7. Contract time... 40
5.1.8. Tariff Plan ... 41
5.1.9. Service with greater importance ... 41
5.1.10. Staying with the current network operator ... 41
5.2. Distribution analysis of the accordance of items ... 42
5.2.1. Tangibility ... 42
5.2.2. Assurance ... 42
5.2.3. Responsiveness ... 43
5.2.4. Reliability... 43
5.2.6. Communication, Availability Information and Tariff ... 44
5.3. Reliability of the SERVPERF instrument ... 44
5.4. Characterization of the profile of averages in dimensions compared to the overall sample ... 46
5.5. Characterization of the profile of dimensions’s averages given the independent variables ... 46
5.5.1. Profile of averages of dimensions against Gender ... 48
5.5.2. Profile of averages of dimensions against Age Group ... 48
5.5.3. Profile of averages of dimensions against the level of education ... 48
5.5.4. Profile of averages of dimensions against the Employment Status ... 49
5.5.5. Profile of averages of dimensions against the gross income of the household in 2015 ... 49
5.5.6. Profile of averages of dimensions against the network operator ... 50
5.5.7. Profile of averages of dimensions against contract time ... 50
5.5.8. Profile of averages of dimensions against the tariff plan ... 51
5.5.9. Profile of averages of dimensions against service with greater importance ... 51
5.5.10. Profile of averages of dimensions against staying with the current network operator ... 51
5.6. Principal Component Analysis (“PCA”) ... 52
6. FINAL CONCLUSIONS ... 56
6.1. Main conclusions ... 56
6.2. Recommendations for improvement of quality of service ... 58
6.3. Study limitations ... 60
7. LIST OF REFERENCES ... 61
8. ANNEXS ... 64
Annex 1: Questionnaire in english ... 64
Annex 2: Questionnaire in portuguese ... 72
Annex 3: Distribution of age groups in relation to each of the sexes ... 80
Annex 4: Highest level of education completed by the respondents ... 80
Annex 5: Employment status of the respondents ... 81
Annex 7: Mobile phone ownership of the respondents ... 82
Annex 8: Network operator of the respondents ... 82
Annex 9: Contract time regarding the services rendered by the respondent’s network providers ... 83
Annex 10: Tariff Plan of the respondents ... 83
Annex 11: Service with greater importance for the respondents ... 84
Annex 12: Respondent’s wish of remaining with the current network operator ... 84
Annex 13: Distribution of the frequency of items of the Tangibility dimension ... 85
Annex 14: Profile Averages of the items of the Tangibility dimension ... 85
Annex 15: Distribution of the frequency of items of the Assurance dimension ... 86
Annex 16: Profile Averages of the items of the Assurance dimension ... 86
Annex 17: Distribution of the frequency of items of the Responsiveness dimension ... 87
Annex 18: Profile Averages of the items of the Responsiveness dimension ... 87
Annex 19: Distribution of the frequency of items of the Reliability dimension ... 88
Annex 20: Profile Averages of the items of the Reliability dimension ... 88
Annex 21: Distribution of the frequency of items of the Empathy dimension ... 89
Annex 22: Profile Averages of the items of the Empathy dimension ... 89
Annex 23: Distribution of the frequency of items of the Communication, Availability Information and Tariff dimensions ... 90
Annex 24: Profile Averages of the items of the Communication, Availability Information and Tariff dimensions ... 90
Annex 25: Profile of averages in dimensions compared to the overall sample ... 91
Annex 26: Kolmogorov-Smirnov test to the Gender variable ... 91
Annex 27: Kolmogorov-Smirnov test to the Age group variable ... 92
Annex 28: Kolmogorov-Smirnov test to the Level of Education variable ... 93
Annex 29: Kolmogorov-Smirnov test to the Employment Status variable... 94
Annex 30: Kolmogorov-Smirnov test to the Gross household income in 2015 variable . 95 Annex 31: Kolmogorov-Smirnov test to the Network operator variable ... 97
Annex 32: Kolmogorov-Smirnov test to the Contract time variable ... 98
Annex 33: Kolmogorov-Smirnov test to the Tariff plan variable ... 99
Annex 34: Kolmogorov-Smirnov test to the Service with greater importance variable ... ... 100
Annex 35: Kolmogorov-Smirnov test to the Service with greater importance variable ... ... 101 Annex 36: Hypothesis test to the equality of two populational distributions of the Gender variable ... 102 Annex 37: Profile of averages of dimensions against Gender ... 102 Annex 38: Hypothesis test to the equality of several populational distributions of the Age group variable ... 103 Annex 39: Profile of averages of dimensions against Age Group ... 103 Annex 40: Hypothesis test to the equality of two populational distributions of the Level of Education variable ... 104 Annex 41: Profile of averages of dimensions against the Level of Education ... 104 Annex 42: Hypothesis test to the equality of two populational distributions of the
Employment Status variable ... 105 Annex 43: Profile of averages of dimensions against the Employment Status ... 105 Annex 44: Hypothesis test to the equality of several populational distributions of the Gross household income in 2015 variable ... 106 Annex 45: Profile of averages of dimensions against the gross income of the household in 2015 ... 106 Annex 46: Hypothesis test to the equality of several populational distributions of the Network operator variable ... 107 Annex 47: Profile of averages of dimensions against the network operator ... 107 Annex 48: Hypothesis test to the equality of several populational distributions of the Contract time variable ... 108 Annex 49: Profile of averages of dimensions against contract time ... 108 Annex 50: Hypothesis test to the equality of several populational distributions of the Tariff plan variable ... 109 Annex 51: Profile of averages of dimensions against the Tariff plan ... 109 Annex 52: Hypothesis test to the equality of several populational distributions of the Service with greater importance variable ... 110 Annex 53: Profile of averages of dimensions against service with greater importance . 110 Annex 54: Hypothesis test to the equality of two populational distributions of the Staying with the current network operator variable ... 111 Annex 55: Profile of averages of dimensions against staying with the current network operator ... 111 Annex 56: KMO and Bartlet’s Test ... 112 Annex 57: Total Variance Explained ... 112
LIST OF ABBREVIATIONS
ANACOM Autoridade Nacional de Comunicações
APN WAP Access Protocol Access Point Name
BLF Fixed/Landline Broadband
BLM Mobile Broadband
CAGR Compound Annual Growth Rate
E Client’s expectations
INE Statistics Portugal
KMO Kaiser-Meyer-Olkin
M2M Machine-to-Machine
MEO MEO – Serviços de Comunicações e Multimédia, S.A.
MMS Multimedia Messaging Service
MOT Moment of Truth
NOS NOS Comunicações, S.A.
P Perceived Performance
PCA Principal Component Analysis
PORDATA PORDATA – Contemporary Portugal Database
SAI Internet Access Service
SMS Short Message Service
SPSS Statistical Package for Social Scienses
STF Fixed/Landline Telephone Service
STM Mobile Telephone Service
STVS Pay-TV Service
1.
INTRODUCTION
The introductory chapter of this thesis has as main purpose the presentation of the study subject, i.e the assessment of the quality of mobile telecommunications services, exposing their goals and the respective questions to be asked and studied later, as well as the description of the report structure.
1.1.
Theme framework
Since 1990, the importance of the telecommunications sector has been increasing, as the industry has become a dynamic force capable of performing functions in technological, economic and productive development of developed economies (Jurisic & Azevedo, 2011).
The telecommunications sector is divided between the fixed telecommunications sector and the mobile telecommunications sector (MarketLine, 2016), where the latter has grown abundantly in the last two decades, due to technological development occurred (Jurisic & Azevedo, 2011).Reason for which, the dissertation will address this sector.
The rapid growth of the mobile telecommunications sector provided the appearance of several operators and now a day, in Portugal, a market that is in a mature stage, we have six operators who offer a wide range of products and services.
In such a competitive market such as mobile telecommunications, where operators are constantly trying to attract new clients and new markets, but also to maintain the current ones, it’s crucial that the service provided is of the utmost quality and perceived as such by them. Quoting William A. Foster: “Quality is never an accident; it is always the result of high intention, sincere effort, intelligent direction and skillful execution; it represents the wise choice of many alternatives”.
Several studies have shown that there is a direct relationship between the quality of service rendered and client satisfaction and loyalty(Kothari, Sharma, & Rathore, 2011). Through some studies it was found that the quality rendered is not only beneficial for the clients but it also helps companies to gain market share, to recover their investment(Anderson & Zeithaml , 1984), to reduce costs and improve productivity(Garvin, 1983).
The quality of the mobile telecommunications service is one aspect with great influence on the client when choosing a mobile operator. Clients, who have a good experience with a particular operator, will probably, choose and remain with that same operator, while the same is not true for those who have a bad experience, as so often happens with many people we are close to and to ourselves. For this reason, improving the mobile telecommunications service is important to maintain current clients and to be able to attract new users.
In the case of tangible goods, quality measurement is an easy task, because the uniformquality standards can be consistently found, but when we approach the quality of services, measurement thereof becomes complicated (Kothari, Sharma, & Rathore, 2011).
It is therefore essential the development of quality measuring instruments for mobile telecommunications services, which are increasingly accurate and reflect the actual client satisfaction.
1.2.
Research objectives
The dissertation will have as main objective the evaluation of the quality of service of mobile telecommunications perceived by the clients through a quality measurement tool adapted to the respective sector – SERVPERF.
There are several specific objectives that will help achieve the main goal, as aforementioned:
► Quantify the perceived quality by mobile telecommunication service users for each item present in this study to be carried out;
► Analyze the distribution of answers pertaining to each item;
► Assess the ability of items to measure the quality of the dimension in which they are included;
► Identify the dimensions of service quality where clients of operators of mobile telecommunications are more and less satisfied;
► Verify the presence of significant differences in perceived quality in each dimension regarding characterizing factors of the sample and of the use of the service;
► Regroup the analyzed items in new dimensions, by means of a correlation criterion; and, ► Suggest recommendations that allow the improvement of the quality of mobile
1.3.
Research problem
The purpose behind this dissertation is to evaluate the client satisfaction level of mobile telecommunications services, that is, to understand what clients value most in this kind of services and how satisfied are they with the services provided to them.
This problem arises in the sense that the current consumer is becoming better informed, the risk of changing mobile telecommunications operators is greater and the products and services available in the market are becoming increasingly similar, making the quality of service, the main differentiating factor.
The main issues at stake and that will be the focus of research and investigation are the following:
► What is the perception of the clients of mobile telecommunications services regarding the quality of the service rendered?
► The items corresponding to each dimension have internal consistency?
► Are there differences in perceived quality in each of the dimensions analyzed regarding client characteristics and the use of mobile telecommunications?
► In the event of items being grouped through a correlation criterion, what are the differences regarding the original model?
After a careful approach to the aforementioned questions, will it then be possible to obtain the desired answers, and finally know about the satisfaction degree of the clients of telecommunications services.
1.4.
Thesis structure
Regarding the structure, the present research work is organized in 5 different chapters in addition to the introduction, namely: (ii) literature review; (iii) theoretical contextualization; (iii) research methodology; (iv) analysis of the results; (v) final conclusions.
The second chapter, literature review, presents the essential theoretical information to support the theoretical basis of the research. So we approache the concept of service quality, the instruments that measure the quality of the service (SERVQUAL and SERVPERF). Lastly, some studies will be presented that address different attributes of service quality, specifically for mobile telecommunications services.
Next, comes the chapter of telecommunications services over which a small framework of the global industry will be made, as well as, and more specifically, an analysis of the mobile services nationwide.
The next chapter focuses on the research methodology, i.e the conceptual models that will be used as analytical tools are addressed, as well as the respective dimensions and independent variables. Moreover, a presentation of the collecting methodology and processing the data is made.
The analysis of the results can be read in the fourth chapter, which will present the results obtained through the questionnaire. This chapter will answer the research questions that were initially placed from the sample characterization, analysis of the distribution of concordance, the characterization of the profile averages relative to the overall sample and independent variables.
In the last chapter the final conclusions of this dissertation will be presented. Furthermore, and in addition to being presented the main limitations of the study, strategies will also be suggested towards improving the quality of mobile telecommunications services in Portugal.
2.
LITERATURE REVIEW
The literature review is a research process of literature, journal articles, newspaper articles, government reports, among others, of analysis and description of the issue to address, which in this case is the evaluation of client satisfaction regarding the services of mobile telecommunications.
Thus, in this chapter we will address the concept of service quality, the two instruments for evaluation (SERVQUAL and SERVPERF), as well as the attributes of service quality.
2.1.
Concept of Service Quality
With increasing competition and customer demand in the 80’s, the service sector has been forced to develop new ways of doing business against competitors, this trend eventually intensified after this sector became the most influential in all the world economies. As a result, scholars have focused on the issue of quality, this one originated in factories, where the concept was directly linked to the production of final goods without defects. Later, the concept was expanded to include all internal resources (Duggal & Verma, 2013).
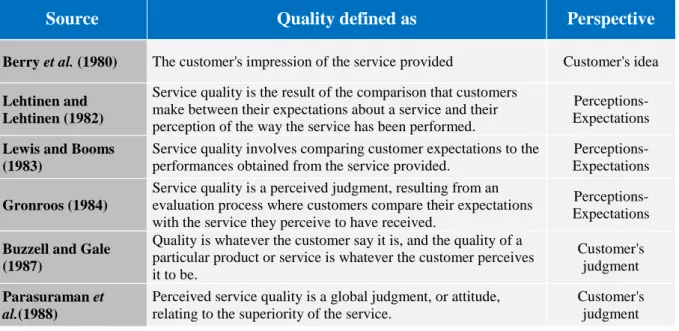
Thus, there is a wide divergence on the definition of quality by various scholars, triggering a huge debate on the subject (Brady & Cronin Jr., 2001), as evidenced by the table below, which shows some of the various existing perspectives.
Table 1 – Service quality perspectives
Source Quality defined as Perspective
Berry et al. (1980) The customer's impression of the service provided Customer's idea
Lehtinen and Lehtinen (1982)
Service quality is the result of the comparison that customers make between their expectations about a service and their perception of the way the service has been performed.
Perceptions- Expectations
Lewis and Booms (1983)
Service quality involves comparing customer expectations to the performances obtained from the service provided.
Perceptions- Expectations
Gronroos (1984)
Service quality is a perceived judgment, resulting from an evaluation process where customers compare their expectations with the service they perceive to have received.
Perceptions- Expectations
Buzzell and Gale (1987)
Quality is whatever the customer say it is, and the quality of a particular product or service is whatever the customer perceives it to be.
Customer's judgment
Parasuraman et
al.(1988)
Perceived service quality is a global judgment, or attitude, relating to the superiority of the service.
Customer's judgment
Source Quality defined as Perspective Teas (1993) Service quality is comparison of performance with ideal
standards. Epitome reference
Cronin and Taylor (1994)
Service quality is a form of attitude representing a long-run overall evaluation.
Overall service quality
Rust and Oliver (1994)
Service quality is a comparison to excellence in service
encounters by the customer. Epitome reference
Bitner and Hubbert (1994)
The consumer's overall impression of the relative inferiority/ superiority of the organization and its services.
Overall service quality
Clow et al.(1997)
Service quality is viewed as the result of the comparison that customers make between their expectations about a service and their perception of the way the service is received.
Perceptions- Expectations
Roest and Pieters (1997)
Service quality is a relativistic and cognitive discrepancy between experience-based norms and performances concerning service benefits.
Discrepancy based construct
Source: (Duggal & Verma, 2013)
Moreover, there are major differences between the services and consumer goods (Fitzgerald, Johnston, Brignall, & Voss, 1993)due to the particular characteristics of services - intangibility, heterogeneity, inseparability and perishability – which represent a major challenge for providers (Polyakova & Mirza, 2015). Thus, we consider the quality of services as an abstract and illusory concept, resulting, therefore, in so many difficulties in their assessment (Cronin Jr. & Taylor, 1992).
The performance of services can not be counted, measured, tested or verified, i.e, most services are intangible (Bateson, 1977; Berry, 1980; Lovelock, 1981; Shostack, 1977), ending up in hampering service providers in the analysis of how customers perceive and evaluate the quality (Zeithaml, 1981).
Regarding the heterogeneity of services, you can say that they vary their performance from producer to producer, from customer to customer and from day to day. Thus, it is not possible to ensure that the service performance of providers is consistent for all customers (Booms & Bitner, 1981), to the extent that the service that one tries to provide may not match the service received by customers.
In services it’s impossible to have a separation between production and consumption (Carmen e Langeard, 1980; Gronroos, 1978; Regan, 1963; Upah, 1980). As a result, the quality of service is not performed in factories and subsequently delivered to the customer, according to what is done with consumer goods. In the service sector the quality is measurable during the provision thereof, i.e during the two-way interaction between the customer and the service provider
(Lehtinen & Lehtinen, 1982). In services there is less management control over quality, however customers have greater participation, because they affect the process. In these situations, the result of the customers is central to the quality of service.
Finally, the fourth feature of the service is the perishability, which is the inability of a service to be stored for later use, resold or returned, entailing greater responsibility to service providers, as they will always have to provide a quality service on the first try, there is no possibility of repeating the same (Ghobadian, Speller, & Jones, 1994).
Thus, according to Parasuraman et al.(1985) three issues are referred as being underlying to the various studies on the quality of services: (i) assessing the quality of services is a more complex task than assessing the quality of goods; (ii) comparing customer’s expectations with the performance of services rendered; (iii) the quality assessment is made not only on the outcome of a service, it also involves evaluations of the process of service provision.
Several scholars agree with the idea that the quality of services consists of comparing customer expectations (“E”) and perceived performance (“P”). Lewis and Booms (1983) state that “service quality is a measure of how well the service level delivered matches customer expectations. Delivering quality service means conforming to customer expectations on a consistent basis”.
Therefore, service quality can be measured according to the following formula:
𝑆𝑄𝑖 = ∑(𝑃𝑖𝑗 − 𝐸𝑖𝑗 𝑘
𝑗=1
)
It is noted that in the above formula:
► 𝑆𝑄𝑖, corresponds to the perceived quality of the service by person i; ► k, corresponds to the number of service attributes; and,
► 𝑃𝑖𝑗 and 𝐸𝑖𝑗, correspond to the perception and expectations, respectively, of the person i regarding the service performance of business j.
From the formula presented above we can get three different results:
► E > P: when customer expectations have not achieved the desired result; ► E < P: when customer expectations were exceeded;
The evaluation of quality of services can be measured through various instruments, among which stand out the SERQUAL and SERVPERF instruments, which will be discussed below.
2.2.
SERVQUAL Instrument
Several scholars, such as Gronroos (1983, 1990, 2001) and Parasuraman et al. (1985, 1988), have been dedicated to the research quality of services in order to realize their dimensions and their background.
This way, Parasuraman et al.(1988) defines the quality of services as a difference between customer expectations and the perception that they had of the effective performance of the service rendered, being that customer expectations match what the customers think that the services providers will offer, while customer perception reflects what customers felt regarding what they received from the service providers.
Thus, the SERVQUAL instrument appears in an investigation whose aim was to create an instrument to assess the quality of services.
This instrument is considered to be multidimensional and initially consisted of a set of 97 items divided into ten dimensions, called determinants of service quality: Access; Communication; Skills; Courtesy; Credibility, Reliability, Responsiveness, Security; Tangibility; and Understanding / Customer Knowledge (Parasuraman, Zeithaml, & Berry, 1985).
The items related to the aforementioned ten dimensions were separated into two phases, i.e., the first grouped the items that assessed customer expectations regarding the provision of services and the second grouped the items that assessed customer perception about the provision of the services.
In order to perform this evaluation, Parasuraman et al. (1988) suggested using the Likert scale (seven points), which ranges from "Strongly Disagree" (1) and "Totally Agree" (7), and in whichthe points 2 to 6 do not hold any description.
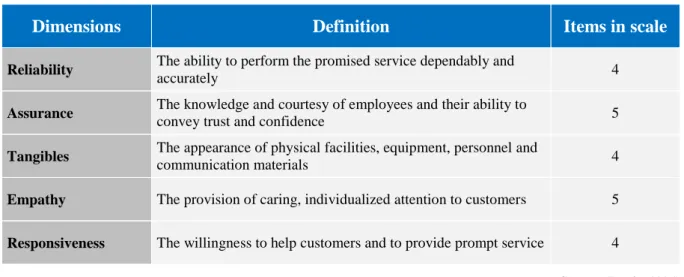
Later, due to various statistical changes in the SERVQUAL instrument, the 97 items became 22, while the ten dimensions mentioned above were regrouped into the following five final dimensions.
Table 2 – SERVQUAL dimensions
Dimensions Definition Items in scale
Reliability The ability to perform the promised service dependably and
accurately 4
Assurance The knowledge and courtesy of employees and their ability to
convey trust and confidence 5
Tangibles The appearance of physical facilities, equipment, personnel and
communication materials 4
Empathy The provision of caring, individualized attention to customers 5
Responsiveness The willingness to help customers and to provide prompt service 4
Source: (Buttle, 1995)
With this reformulation of the SERVQUAL instrument, only two new dimensions appeared, Reliability and Empathy, which grouped the items representing the seven original dimensions – Communication; Credibility; Security; Competence; Courtesy; Understanding / Knowing, Customers; and Access.
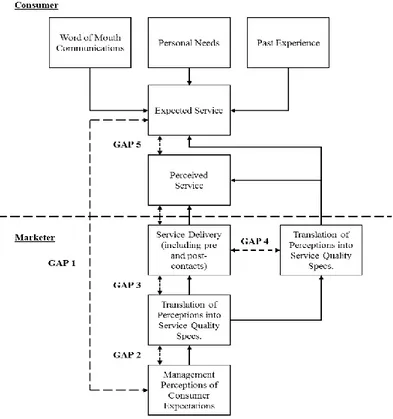
From the analysis conducted by Parasuraman et al. (1985) an important result was obtained: “A set of key discrepancies or gaps exists regarding executive perceptions of service quality and the tasks associated with service delivery to consumers. These gaps can be major hurdles in attempting to deliver a service which consumers would perceive as being of high quality”. Thus, the gaps found were the following:
► Consumer expectation – management perception gap (GAP 1): Sometimes the management team of a company may not understand what are the features that are considered to be of high quality to consumers, i.e. what a service should have as characteristics in order to satisfy consumer needs.
► Management perception – service quality specification gap (GAP 2): Management perception - service quality specification gap (GAP 2): There are a variety of factors, such as constraints on resources, market conditions and/or undifferentiated management, which could trigger a difference between the perception of management on the expectations of consumers and the specifications of quality of service defined by the company.
► Service quality specifications – service delivery gap (GAP 3): Even with guidelines as to how to perform a service, the performance with high quality thereof may not be achieved, in the extent that its capacity will depend substantially on the workers' performance, which can not always be standardized.
► Service delivery –external communications gap (GAP 4): The communication made by a company about its services, such as advertising, can affect not only customer expectations regarding the service provided by the company, but also the perception of customer regarding the service. Because, if the company creates too high expectations in consumers, the service will have to meet them, otherwise customers will not be satisfied.
► Expected service – perceived service gap (GAP 5): The high and low quality judgments made by consumers are dependent on how they perceive the service that was actually rendered in accordance with their expectations.
Figure 1 – Service quality model
Source: (Parasuraman, Zeithaml, & Berry, 1985)
According to Parasuraman et al. (1985), the perception of service quality by consumers depends both on the size and the direction of GAP 5, which in turn depends on the nature of the gaps
associated with the design, marketing and services. Thus, GAP 5 results of the remaining gaps, ending up with these influencing GAP 5 positively and negatively the quality of service perceived by consumers.
Moreover, through figure 1 it is possible to see that consumer expectations given the quality of a service are based on experiences lived by themselves or by others (through word of mouth), but also personal needs at the time of the service provision.
However, several criticisms have been aimed at the SERVQUAL instrument, as seen for example in the article “SERVQUAL: review, critique, research agenda” of Buttle (1995), which are divided between conceptual criticism (1) and operating criticism (2) , as can be seen in the table below.
Table 3 – SERVQUAL criticisms
1. Theoretical criticisms Paradigmatic
objections
SERVQUAL is based on a disconfirmation paradigm rather than an attitudinal paradigm; and SERVQUAL fails to draw on established economic, statistical and psychological theory
Gaps model There is little evidence that customers assess service quality in terms of Perceptions –
Expectations gaps
Process orientation SERVQUAL focuses on the process of service delivery, not the outcomes of the
service encounter
Dimensionality
SERVQUAL’s five dimensions are not universals; the number of dimensions comprising service quality is contextualized; items do not always load on to the factors which one would a priori expect; and the is a high degree of intercorrelation between the five RATER dimensions
2. Operational criticisms Expectations
The term expectation is polysemic; consumers use standards other than expectations to evaluate service quality; and SERVQUAL fails to measure absolute service quality expectations
Item composition Four or five items can not capture the variability within each SQ dimension
Moment of Truth
(“MOT”) Customers’ assessments of service quality may vary from MOT to MOT Polarity The reversed polarity of items in the scale causes respondent error
Scale points The seven-point Likert scale is flawed
Two administrations Two administrations of the instrument causes boredom and confusion
Variance extracted The over SERVQUAL score accounts for a disappointing proportion of item
variances
2.3.
SERVPERF Instrument
The analysis of the quality of service provision can be measured also by the SERVPERF instrument and this was developed by Cronin Jr. and Taylor (1992).
Note that this tool is in every way identical to the SERVQUAL instrument, but it bases its analysis of the quality of services only in the perception of the performance of services by consumers after they have had used them.
Thus, the SERVPERF instrument consists of 22 items, which represent the five dimensions of quality (Reliability; Assurance; Tangibility; Empathy; and Responsiveness) used in the SERVQUAL instrument of Parasuraman et al.(1988), which took into account only the performance perceived by consumers. In addition, the scale used was also the Likert scale (7 points).
Throughout the document “Measuring Service Quality: A Reexamination and Extension” of Cronin Jr. and Taylor (1992) four instruments were compared – SERVQUAL (1), weighted SERVQUAL (2), SERVPERF (3) and weighted SERVPERF (4) – which measure the quality of services, whose equations are the following:
(1) Service quality = (Performance – Expectations)
(2) Service quality = Importance * (Performance – Expectations) (3) Service quality = (Performance)
(4) Service quality = Importance * (Performance)
These instruments were applied to evaluate the quality of services in four industries (banks, fast food, pest control and dry cleaning). While the SERVQUAL instrument was only suited to two of the assessed industries (banks and fast food), the SERVPERF instrument fitted the four industries evaluated, demonstrating the superiority of this instrument against the SERVQUAL instrument (Cronin Jr. & Taylor, 1992).
In the previously mentioned study the following issues were discussed:
► “How should service quality be conceptulized and measured?”
► “What is the causal order of the relationship between service quality and consumer satisfaction?
► “What impacts do service quality and consumer satisfaction have on purchase intentions?”
In response to the first question, the study concluded that “service quality should be conceptualized and measured as an attitude”. Moreover the approach based only on performance is preferred, i.e. the use of the SERVPERF tool is preferred to the instrument SERVQUAL, because better differentiates the variation of quality of services.
Regarding the relationship between service quality, customer satisfaction and purchase intent, the study authors say that the perceived quality of the services precedes the satisfaction of consumers which, in turn, will affect the purchase intentions, ending up having more influence on the decisions than the very quality of services.
2.4.
Attributes of service quality
The quality perception and customer satisfaction are key factors for the competitiveness of services. Thus, it is important to identify the elements that determine the perceived quality and satisfaction from the customers' point of view using any type of service. The existence of a relationship between the determinants of customer satisfaction and the identification of the key attributes that affect the perceived quality of the customers of the various services will be crucial.
However, there is a huge lack of studies that simultaneously relate the set of determinants, due to the large volume of aspects to take into account, because the existing studies, often, address small groups of determinants.
Thus, several studies on the quality of services were made and eventually a comprehensive set of attributes was identified, due to the different authors but also because of the nature of the service, as can be seen in the table below.
Table 4 – Service quality attributes
Researchers Attributes
Sasser (1978) Security, consistency, attitude, completeness, condition, availability and training
Lehtinen and Lehtinen (1982)
Physical quality (products and/or services), corporate quality (company image), interactive quality (interaction between the consumer and the service
Researchers Attributes
Gronroos (1984) Technical quality of the outcome, functional quality of the
encounter, company corporate image
Garvin (1987) Performance, features, reliability, conformance, durability,
serviceability, aesthetics and perceived quality
Cadotte and Turgeon
(1988) Complaints and compliments
Garssing and Hessick (1988)
Accuracy, timeliness, simplicity, consistency, employee attitudes, Cost
Leblanc and Nguyen (1988) Physical environment & instruments, internal organisation,
service encounter, customer satisfaction and corporate image
Hedvall and Paltschik (1989)
Willingness and ability to serve, physical and psychological Access
Johnston and Silvestro
(1990) Hygiene factors, enhancing factors and dual-threshold factors
Carman (1990) - Hospitals
Admission service, tangible accommodations, tangible food, tangible privacy, nursing care, explanation of treatment, access and courtesy afforded to visitors, discharge planning and patient accounting
Brucks and Zeithaml (1991) - Automobiles
Reliability, serviceability, prestige, durability, functionality and ease of use
Saleh and Ryan (1992) – Hotel Industry
Conviviality, tangibles, reassurance, avoidance of sarcasm, and Empathy
Babakus and Boller (1992) Service quality Bouman and van der Weile
(1992) – Car-service Industry
Customer kindness, tangibles and faith
Gagliano and Hathcote
(1994) – Retail Industry Personal attention, reliability, tangibles and convenience McDougall and Levesque
(1994) Service outcome, service process and physical environment Avkiran (1994) – Teller
Services Staff conduct, credibility, communication and access Dabholkar et al. (1996) –
Retail Industry
Physical aspects, reliability, personal interaction, problem solving and policy
Beinstoc et al. (1997) Physical distribution (timeliness, availability, and condition)
Bahia and Nantel (2000) – Retail Banking
Effectiveness and assurance, service portfolio, reliability, tangibles, access and price
Brady etal. (2001) Interaction quality, outcome quality and physical environment
Quality
Cronin (2003) Variability, regret, resistance, equity and disgust
Source: (Duggal & Verma, 2013)
Despite the many studies conducted, none of them could be sufficiently comprehensive in order to be able to evaluate all existing services.
One of the most used instruments for evaluating the quality of a service is SERVQUAL developed by Parasuraman et al. (1988), having as dimensions Reliability, Assurance, Tangibility, Empathy and Responsiveness. However, and as mentioned above, this instrument has also been found insufficient to evaluate the quality of services, including the mobile telecommunications.
Thus, we conclude that there is no agreement on the number of dimensions regarding the quality of services.
Also noteworthy is that there were already some studies made that have focused on telecommunications services, as seen below.
In the study conducted by Muhammad Arslan, Maria Iftikhae and Rashid Zaman (2014), through which one sought to establish a relationship between the dimensions of Service quality and Customer satisfaction in Pakistan's telecommunications sector, customer Satisfaction was defined as the dependent variable, while Trust and Empathy were defined as independent variables responsible for increasing Customer satisfaction. The above-identified variables were chosen because they were considered to be the most important with respect to telecommunication services, to the extent that they cover most of the characteristics of the service.
The independent variable Trust refers to accessibility, continuity and performance of services, having been evaluated using the following criteria:
► “The signals are clear”;
► “The voice quality is clear and there is no distortion”; ► “The service quality is up to my expectations”;
► “The service quality can be made better”; ► “The call packages are appropriately priced”; ► “The sms packages are appropriately priced”; ► “Internet service is appropriately priced”;
► “Other facilities like caller tunes/sms bundles are appropriately priced”; ► “Performs services right the first time”;
► “Provides services at the promised time”;
► “Keeps customers informed about when services will be performed”; and, ► “Keeps its packages and services up to date”.
The independent variable Empathy refers to the attitude of employees towards customers and was evaluated through the following criteria:
► “My call is answered as soon as I call”;
► “The managers / employees always have my best at heart”; ► “Employees show care and concern while talking to me”;
► “The managers / employees give individual attention to my problems and interests”; ► “Service personnel always carefully listen to my complains and requests”;
► “Complain process is convenient to use”;
► “My feedback and suggestions are implemented when possible”; ► “My queries are resolved within time”; and,
► “I get an immediate solution for my complains”.
Finally, the Customer Satisfaction dependent variable was assessed using the following criteria:
► “The sms packages satisfaction”; ► “The call packages satisfaction”; ► “The quality of voice call satisfaction”; ► “Signals satisfaction”;
► “The speed of messaging satisfaction”; ► “The attitude of the employees satisfaction”; ► “The pricing satisfactions”;
► “The Internet bundles satisfaction”;
► “SMS / call international bundles satisfaction”; and, ► “Customer support centre satisfaction”.
Through this study, it was possible to prove the existence of a relationship between Customer satisfaction and the two variables of Service quality, Trust and Empathy.
In another research performed by Rajkumar Paulrajan and Harish Rajkumar (2011), in order to examine and understand the choice made by consumers with regard to providers of mobile telecommunications services, the following items were considered as dimensions and respective attributes of quality of service:
► “Communication (call quality, call drop rate and geographical coverage)”; ► “Call service (call forwarding and, waiting and service quality)”;
► “Facility (short message service, mobile entertainment and new technology use)”; ► “Price (calling rate, promotional offers and product range)”;
► “Customer care (complaint redressal system and complaint resolution)”; and,
► “Service provider (customers’ relations, innovativeness, restoration capabilities, reliability and responsiveness)”.
From the conducted research, it was possible to conclude that the perception of consumers is quite varied depending on the quality of the various dimensions mentioned above (Communication; Call service; Facility; Price; Customer care; and Service provider). Furthermore, the study shows that Communication and Price are the most influential and preferred dimensions with regard to the selection of telecommunications service providers. However, Quality and Product availability have a significant impact on the choice of telecommunications service providers.
The article “Determinants of Customer Satisfaction in Telecom Industry”, writen by Shahzad Khan and Saima Afsheen (2012), showed that customer satisfaction depends on the following factors: ► “Customer service”; ► “Sales promotion”; ► “Signal strength”; ► “Promotion”; ► “Coverage”; and,
► “Price fairness”.
This article concluded that the factors that most influence customer satisfaction are Fair price and Network coverage.
In the article “Customer Satisfaction in the Mobile Telecom Industry in Bahrain: Antecedents and Consequences”, writen by Mohammed M. Almossawi (2012), the attributes that exert greater influence on customer satisfaction were analyzed, in the switching and permanence with a service provider, subsequently identified.
Determinants of customer satisfaction (ranked in terms of their importance in determining
customer satisfaction):
► “Attractive offers”; ► “Signal quality”;
► “Calls & SMS charges”; ► “Voice quality”;
► “Monthly calls rent”;
► “Using advanced technology”; ► “Monthly data rent”;
► “Quality of call center services”;
► “Quality of service at retail /service shops”; ► “Having retail / service shops in many places”; ► “Mobile provider being modern”;
► “Mobile provider being friendly”;
► “Mobile provider keeping in touch”; and, ► “Having user-friendly website”.
Determinants of customer switching (ranked in terms of their importance in determining
customer switching):
► “Dissatisfied with the charges applied by previous provider”; ► “The new provider has a strong signal coverage”;
► “The new provider has a good reputation in the telecom industry”; ► “The new provider was recommended by friends / relatives who I trust”; ► “I was influenced by the advertisements of the new provider”;
► “The possibility of switching without losing my telephone number”;
► “The previous provider was very slow in responding to my enquiries/problems”; ► “I was dissatisfied with the customer service of the previous provide”; and, ► “Curious to try a new provider”.
Determinants of customer retention (ranked in terms of their importance in determining
customer retention):
► “I am satisfied with the provider’s offers / promotions”; ► “I am satisfied with the provider’s charges”;
► “I am satisfied with the provider’s signal coverage”; ► “I am satisfied with the provider’s monthly rent”; ► “I do not have a better option”;
► “I am satisfied with the provider’s customer care”;
► “I feel happy and good in dealing with the provider”; and, ► “I am satisfied with the provider’s website”.
The factors related with payment and savings of services rendered, such as offers, rentals and charges, are considered as the most significant for satisfaction, permanence and ability to switch from one mobile operator to another competitor. Conversely, the communication factors, such as customer service, friendly employees and user-friendly sites, are less significant than the factors mentioned above.
3.
TELECOMMUNICATION SERVICES
In order to get better acquainted with the reality under study, a brief framework of the global telecommunications sector will be presented, and the mobile services in Portugal will also be adressed. Finally, the critical success factors and potential risks of the telecommunications services sector will be highlighted.
3.1.
Framework
The market for telecommunications services consists of the fixed/landline telecommunications networks and wireless telecommunications networks.
The value of the segment of fixed/landline communication networks is measured by the revenues obtained by the voice telephone operators and other data transmission equipment via fixed lines (wirelines). The market value of this segment is calculated based on revenues from end-users for utilizations and subscriptions, excluding revenues related to transactions between operators in the wholesale market. Included are also the revenues from Internet and value-added services.
On the other hand, the segment of the wireless systems is defined by mobile phones, pagers and all other wireless telecommunication services. The revenues are derived from payments to operators of all these services, utilizations and subscriptions.
The market volume is calculated by the total of existing fixed/landline phones and mobile subscribers.
3.2.
Global telecommunication services
According to the study performed by Marketline1, “Global Telecommunication Services”
published in February 2016, the global telecommunications market between 2011 and 2015, contracted slightly. However, it is expected this scenario to be reversed during the period
1Marketline is a database specialized in business information and provides qualitative and quantitative data for
between 2016 and 2020, witnessing a moderate growth whose main responsible will be the Asia-Pacific market2.
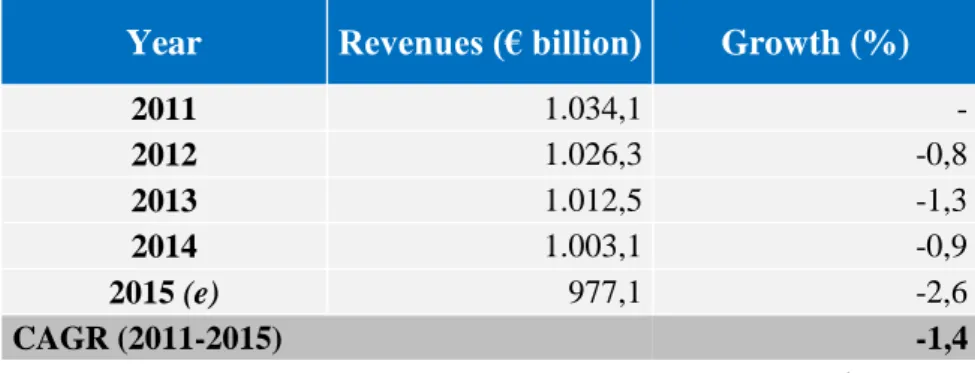
The global market for telecommunications services predicted to generate in the year 2015, a total revenue of 977,1 billion euros, which represents a 2,6% decrease when compared to 2014. In the period between 2011 and 2015, the market recorded a Compound Annual GrowthRate (“CAGR”) of -1,4%, as it can be seen in the table below.
Table 5 – Revenues generated by the global telecommunication services
Year Revenues (€ billion) Growth (%)
2011 1.034,1 - 2012 1.026,3 -0,8 2013 1.012,5 -1,3 2014 1.003,1 -0,9 2015 (e) 977,1 -2,6 CAGR (2011-2015) -1,4 (e) - estimate Source:(MarketLine, 2016)
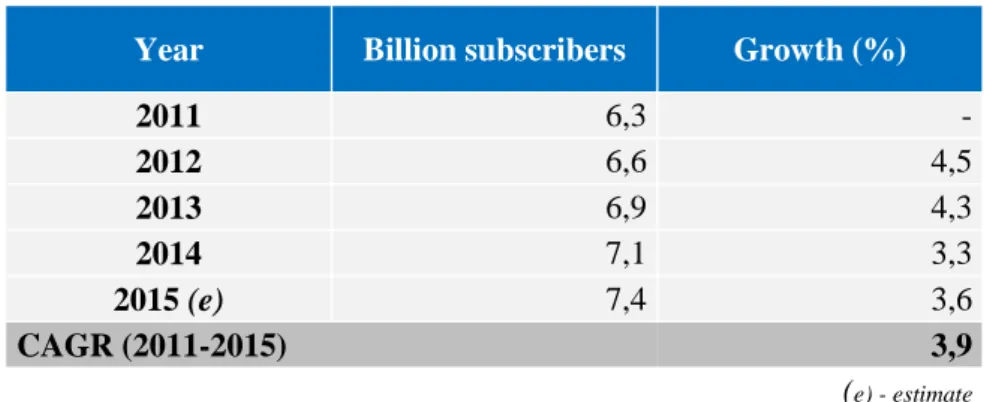
It is expected that by 2015, the market size in relation to consumption, registers a growth of 3.6% compared to 2014, reaching approximately 7,4 billion subscribers. In the period between 2011 and 2015, the market recorded a CAGR of 3,9%, representing an increase in the value of the global market consumption of telecommunications services compared to consumption levels registered in 2011. In addition, it is expected that by the end of 2020, the market volume will increase to 8.645,9 million subscribers, representing a CAGR of 3,1% for the period between 2015 and 2020.
2 For the purposes of the “Global Telecommunication Services” study, the Asia-Pacific region comprises the
following countries: Australia, China, Hong Kong, India, Indonesia, Kasakhstan, Japan, Malaysia, New Zealand, Pakistan, Philippines, Singapore, South Korea, Taiwan, Thailand, and Vietnam.
Table 6 – Volume of the global telecommunication services
Year Billion subscribers Growth (%)
2011 6,3 - 2012 6,6 4,5 2013 6,9 4,3 2014 7,1 3,3 2015 (e) 7,4 3,6 CAGR (2011-2015) 3,9 (e) - estimate Source:(MarketLine, 2016)
3.2.1. Market segmentation by category
In 2015 the largest segment of the market of telecommunications services, with a share of 66,1%, was the wireless systems, also acquiring the title of being the most profitable, with total revenues of 858.8 billion de dollars. In contrast, the segment of fixed communications networks, with a share of 33,9% market share, obtained in 2015 a total revenue of 439.8 billion dollars.
Graph 1 – Global telecommunication services market category segmentation: % share, by
value, 2015 (e)
3.2.2. Market segmentation by geographic area3
The Asia-Pacific market in terms of value, is the market with the greatest relative weight in the world, accounting for 37% of international market share. Then the US market and the European market both represent a share of 25% of the market value in analysis, as it can be seen in Graph 2.
Graph 2 – Global telecommunication services market geography segmentation: % share, by
value, 2015 (e)
Source: (MarketLine, 2016)
3.2.3. Major telecommunications service companies
In the global market of telecommunications services those that stand out as major competitors are China Mobile (11,4%), China Unicom (6%) and China Telecom (5,9%). Following, it’s Vodafone with a representation of 5,7%, among all other existing companies (70,9%), as can be seen in Graph 3.
3For the purposes of the “Global Telecommunication Services” study, the Europe region comprises the following
countries: Austria, Belgium, The Czech Republic, Denmark, Finland, France, Germany, Greece, Ireland, Italy, Netherlands, Norway, Poland, Portugal, Russia, Spain, Sweden, Switzerland, Turkey, and the United Kingdom. The Middle East region comprises the following countries: Egypt, Israel, Saudi Arabia, and United Arab Emirates.
Graph 3 – Global telecommunication services market share: % share, by value, 2015 (e)
Source: (MarketLine, 2016)
3.3.
Mobile services
4in Portugal
3.3.1. Mobile service penetration rate
According to the report done by the Autoridade Nacional de Comunicações (“ANACOM”) “Mobile Services in 2015”, published in February 2016, the penetration rate of mobile services at the end of 2015, amounted to 161,8 per 100 inhabitants. In the event of only being considered mobile stations with actual use5, the national penetration rate would be 123,2 per 100 inhabitants. Nevertheless, in the event of being excluded the exclusive cards to access the Internet and mobile stations connected to the service Machine-to-Machine (“M2M”), the penetration rate was 112,9 per 100 inhabitants.
In the graph below it is possible to check the existing penetration of the Mobile Telephone Service (“STM”) in Portugal.
4 Mobile services are the Mobile Telephone Service ("STM") and Mobile Broadband ("BLM"), including the
Internet Access Service ("SAI").
5 Active mobile stations with actual use are those that are authorized to use the services that were actually used
Graph 4 – STM penetration in Portugal
Unit: subscriberss per 100 inhabitants
Source: (MarketLine, 2016)
Moreover, as noted in the study conducted by Marktest “Telecommunications Barometer - Mobile Networks of Marktest”, in December 2015, 95% of the resident population in Portugal was a client of STM.
3.3.2. Level of use of mobile services
3.3.2.1. Mobile stations / Active user equipments
At the end of 2015 there were 16,8 million of STM subscribers, corresponding this amount to an increase of 0,3% of total subscribers over the same year. However, only 12,8 million subscribers actually used the service in December 2015, equivalent to 76% of the total, less than 1,7% at the end of 2014.
Table 7– Number of mobile stations / active user equipment (subscribers) with effective
utilization 2014 2015 Var. 2014/2015 Annual Average Var. 2011/2015 Accumula ted Var. 2011/2015 Number of mobile stations / active
user equipment connected to active post-paid plans, prepaid plans and combined / hybrid plans
16.732 16.790 0,3% 0,0% 0,0%
of those which with actual
use 13.004 12.779 -1,7% -1,3% -5,1%
those connected to
2014 2015 Var. 2014/2015 Annual Average Var. 2011/2015 Accumula ted Var. 2011/2015 those which with are
prepaid 7.459 6.341 -15,0% -10,8% -36,7%
those which with are
postpaid/hybrid 5.545 6.438 16,1% 16,9% 86,6%
Units: thousands of subscribers, %
Source: (ANACOM, 2016)
More adds that, at the end of 2015, about 50,6% of subscribers used pre-paid plans, representing a decrease of 6,6% than that of the end of last year, a trend that has been observed since the beginning of 2013.
Graph 5– Distribution of subscribers by type of tariff plan
Source: (ANACOM, 2016)
This evolution reflects (i) the development of new offers 3G and 4G, which most often are in a post-paid system, (ii) the introduction of tariffs with traffic included in the monthly fee and last but not least, (iii) increased penetration of multiple play tariff (these incorporate various services, such as the Fixed Telephone Service (“STF”), STM, Fixed Broadband (“BLF”), BLM and subscription television service (“STVS”)) incorporating the STM and whose tariffs are post-paid / hybrids. 72,9% 72,1% 71,8% 71,5% 68,2% 57,2% 50,6% 27,1% 27,9% 28,2% 28,5% 31,8% 42,8% 49,4% 0,0% 10,0% 20,0% 30,0% 40,0% 50,0% 60,0% 70,0% 80,0% 90,0% 100,0% 2009 2010 2011 2012 2013 2014 2015 Prepaid Postpaid/hybrid
3.3.2.2. Typical service users of mobile broadband
At the end of 2015 there were around 13,2 million users able to use the BLM services, accounting for 4,9% when compared to the previous year.
In recent years there has been an increase in the number of active users of BLM services due mainly to the growth of Internet access service users by BLM.
Table 8– Number of broadband service users
2014 2015 Var. 2014/2015 Annual Average Var. 2011/2015 Accumulated Var. 2011/2015 Total number of users of broadband
services 12.580 13.197 4,9% 4,3% 18,1%
of which 3G service users, upgrades and equivalent standards in the reporting period
5.498 5.841 6,3% 8,9% 40,6%
of which users of the Internet access service for broadband
5.102 5.522 8,2% 17,2% 88,8%
of which users with specific tariff for Internet access on BLM
2.088 1.735 -16,9% - -
of which connected to the Internet via tablet/PC
673 572 -15,1% -15,7% -49,6%
of which Internet
on the phone6 4.428 4.950 11,8% 28,9% >100%
Units: thousands of subscribers, %
Source: (ANACOM, 2016)
In addition to the internet access (browsing), there are other activities related to BLM, such as the use of social media, the use of electronic mail, use of instant messaging and the making of calls (VoIP – Voice over Internet Protocol).
6 The estimated number of SAI users through the mobile phone is the result of the difference between the total of
Graph 6– Level of use of other services on the mobile phone
Units:% Base: mobile owners (Total)
Source: (Marktest, 2015)
3.3.2.3. Voice traffic
In 2015 voice traffic in terms of minutes, increased by 5,3%, possibly due to the introduction of deals with so-called "zero cents" phonecalls to all mobile networks. In addition, the number of calls made by the STM subscribers also increased, mais 5,4% que em 2014, more than in 2014, recording a total of 9,7 billion.
3.3.2.4. Short Message Service (“SMS”)
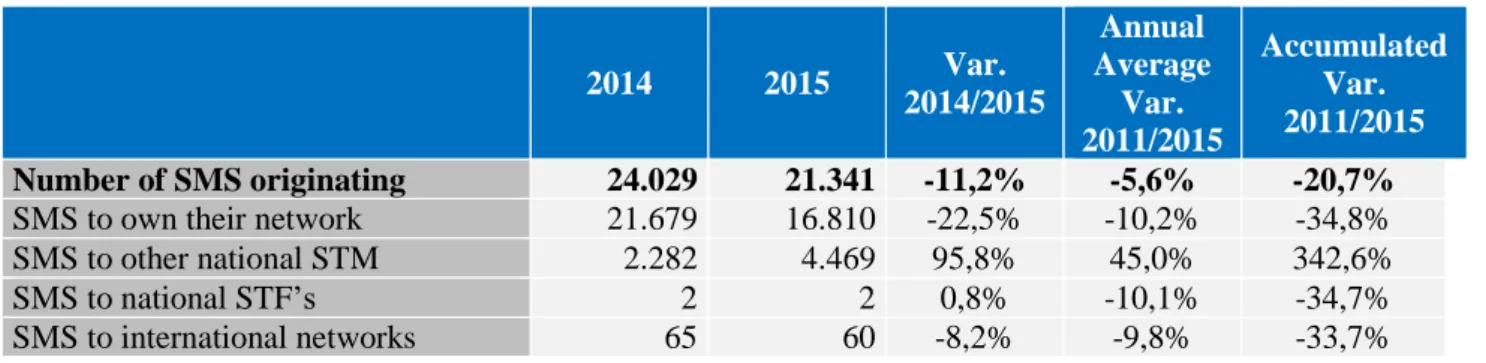
Contrary to what occurred in respect to voice traffic in 2015, the number of text messages sent was reduced by about 11,2%, which is higher than the average decrease in recent years (-5,6%). This is justified mainly by the emergence of alternative forms of communication and the introduction of tariffs with included data traffic, driving users of SMS service to use the Internet access service.
Table 9 – SMS originated on their own network 2014 2015 Var. 2014/2015 Annual Average Var. 2011/2015 Accumulated Var. 2011/2015 Number of SMS originating 24.029 21.341 -11,2% -5,6% -20,7%
SMS to own their network 21.679 16.810 -22,5% -10,2% -34,8% SMS to other national STM 2.282 4.469 95,8% 45,0% 342,6% SMS to national STF’s 2 2 0,8% -10,1% -34,7% SMS to international networks 65 60 -8,2% -9,8% -33,7%
Units: millions of messages
Source: (ANACOM, 2016)
3.3.2.5. Multimedia Messaging Service (“MMS”), video calls e mobile TV, WAP
The number of MMS users is relatively small, as compared with the volume of SMS’s, the volume of MMS is substantially reduced. Although an increase from 2007 was recorded, since 2014 we have come to register annual declines, and in 2015 the MMS number decreased 23,5%. This reality can be justified, as seen in the SMS’s due to alternative multimedia messaging solutions.
Table 10– Data Services: MMS originated on their own network, video calls, mobile TV e WAP Unit 2014 2015 Var. 2014/2015 Annual Average Var. 2011/2015 Accumulated Var. 2011/2015 Number of multimedia messages Millions 140 107 -23,5% -7,2% -25,8%
Number of video calls Thousands 2.048 2.661 30,0% -2,3% -9,0%
Volume of traffic of video calls
Thousands
of minutes 7.972 9.192 15,3% -8,1% -28,6%
Sessions Mobile TV Thousands 1.266 2.651 109,4% 20,2% 108,6%
Traffic Mobile TV TB 24 33 39,4% 47,5% >100%
Sessões Wireless Access Protocol Access Point Name Sessions (“APN WAP”)
Millions 249 227 -8,9% 1,0% 3,9%
Volume of APN WAP
sessions TB 139 91 -34,8% 11,3% 53,4%
Units: million MMS messages, thousands of video calls, thousands of mobile TV sessions, TB, millions of WAP APN sessions, %
Source: (ANACOM, 2016)
The video telephone service, despite having a relatively low level of traffic, compared to the year 2014, greatly increased the number of video calls in 2015, as well as their volume of traffic,
as can be seen in the table above. This growth results from equipment increase with the service (smartphones) and the introduction of free video calls in the tariff offer.
Regarding the Mobile TV service, introduced in 2006, there are two national operators offering the same (MEO Go and Vodafone Mobile TV), with daily, weekly and monthly subscriptions. The volume of mobile TV service traffic increased in 2015, yet the average volume per session in 2015 reached 13 MB, in the 4th quarter of 2015 recorded a 6,5MB reduction from the previous quarter.
Finally, the volume of data services via the WAP protocol decreased in 2015 (34,8%) when compared to the previous year. Moreover, it was also noticed a reduction of the number of sessions in 8,9%.
3.3.2.6. . International Roaming: Voice, SMS and Internet
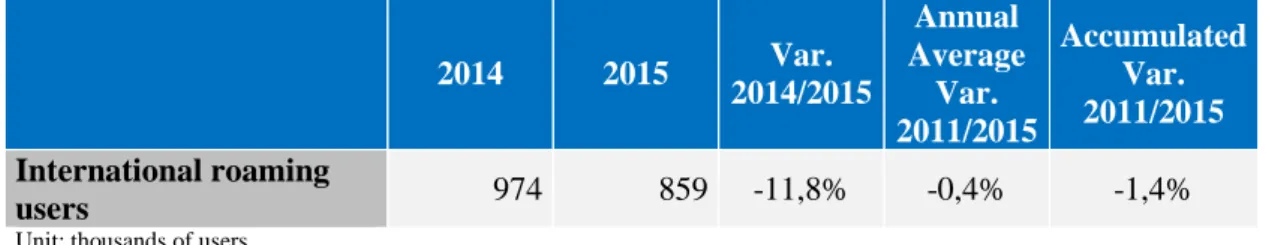
At the end of the year 2015 the international roaming service users reached 859 thousand uses, 11,8% less than the previous year, corresponding to 7,3% of total active mobile stations with actual use, except Internet access cards and equipment M2M.
Table 11 – International roaming users
2014 2015 Var. 2014/2015 Annual Average Var. 2011/2015 Accumulated Var. 2011/2015 International roaming users 974 859 -11,8% -0,4% -1,4%
Unit: thousands of users
Source: (ANACOM, 2016)
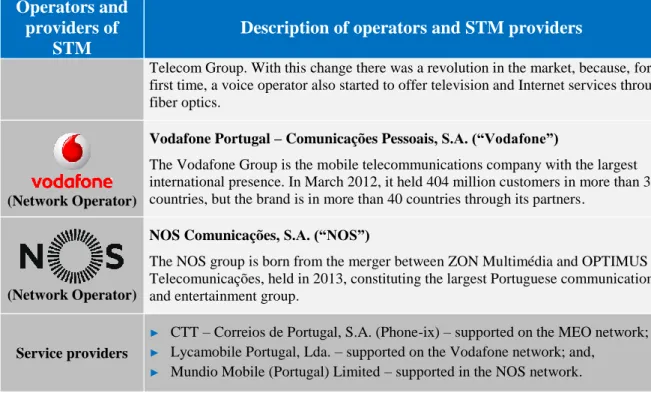
3.3.3. STMproviders
According to ANACOM, a company whose mission is to regulate the sector of electronic communications and postal, the STM providers in activity in the national territory in the fourth quarter of 2015 were as follows.
Operators and providers of
STM
Description of operators and STM providers
(Network Operator)
MEO – Serviços de Comunicações e Multimédia, S.A. (“MEO”)
This entity has replaced the first mobile telecommunications operator in the country, TMN – Telecomunicações Móveis Nacionais, S.A., which is owned by Portugal