Recebido para publicação em 19/3/2007 Aceito para publicação em 17/7/2008 (002403)
1 Núcleo de Biotecnologia, Embrapa Soja, Rodovia Carlos João Strass, CP 231, Distrito de Warta, CEP 86001-970, Londrina - PR, Brasil, E-mail: francm@cnpso.embrapa.br 2 Núcleo de Melhoramento Genético Animal, Embrapa Gado de Leite, Rua Eugênio do Nascimento, 610, Dom Bosco, CEP 36038-330, Juiz de Fora - MG, Brasil
3 Departamento de Biologia Geral, Instituto de Biotecnologia Aplicada à Agropecuária – Bioagro, Universidade Federal de Viçosa – UFV, Av. Peter Henry Rolfs, s/n, Campus Universitário, CEP 36570-000, Viçosa - MG, Brasil
*A quem a correspondência deve ser enviada
Detection and quantification of Roundup Ready® soybean residues
in sausage samples by conventional and real-time PCR
Detecção e quantificação de resíduos de soja Roundup Ready® em
amostras de salsicha por PCR convencional e PCR em tempo real
Francismar Corrêa MARCELINO1*, Marta Fonseca Martins GUIMARÃES2, Everaldo Gonçalves De-BARROS3
1 Introduction
The growth of genetically modified (GM) plant species has dramatically increased over the last 11 years. The GM crop area increased from 1.7 million ha in 1996 to 114.3 million ha in 2007 (JAMES, 2007). In Brazil, growers were first authorized to sell RR® soybean in 2003. In 2004 and 2005, both cultivation and commercialization of RR® soybean were authorized by the Brazilian government. As GM soybean growth increased in the
country, the presence of GM residues in human and animal food proportionally rose. According to the Brazilian legislation, the presence of GM residues exceeding the threshold limit value (1%) in the final product should be disclosed on food labels.
A screening for the presence of transgenic residues, during the period from 2003 to 2005, in different processed products Resumo
A presença crescente de produtos derivados de plantas geneticamente modificadas (GM) na dieta humana e de animais tem levado ao desenvolvimento de métodos de detecção capazes de distinguir entre alimentos derivados da biotecnologia e alimentos convencionais. As técnicas de PCR convencional e em tempo real têm sido as mais utilizadas para detectar e quantificar resíduos GM em alimentos altamente processados, respectivamente. A extração de DNA é um passo crítico durante o processo de análise. Alguns fatores, tais como, degradação de DNA, efeito de matriz e a presença de inibidores da PCR, implicam que um limite de detecção ou quantificação estabelecido para um determinado método é restrito à matriz usada durante validação e não pode ser estendido a qualquer outra matriz fora do escopo do método. No Brasil, amostras de salsicha constituíram a principal classe de produtos, nas quais resíduos de soja Roundup Ready® (RR) foram detectados. Então a validação de metodologias para detecção e quantificação destes resíduos é urgente. Amostras de salsicha foram submetidas a dois diferentes métodos de extração de DNA: Wizard modificado e CTAB. O rendimento e a qualidade foram comparados em ambos os métodos. As amostras foram analisadas por PCR convencional e em tempo real para detecção e quantificação de resíduos de soja RR. Pelo menos 200 ng de DNA total da amostra de salsicha foram necessários para garantir uma quantificação confiável. Reações contendo concentrações de DNA abaixo deste limite apresentaram grande variação nos valores de porcentagem de GM esperados. Na PCR convencional, o limite de detecção variou de 1,0 a 500 ng, dependendo do conteúdo de soja GM na amostra. A precisão, performance e linearidade foram relativamente altas, indicando que o método de análise foi satisfatório. Palavras-chave: PCR quantitativo; OGM; salsicha; resíduos transgênicos.
Abstract
The increasing presence of products derived from genetically modified (GM) plants in human and animal diets has led to the development of detection methods to distinguish biotechnology-derived foods from conventional ones. The conventional and real-time PCR have been used, respectively, to detect and quantify GM residues in highly processed foods. DNA extraction is a critical step during the analysis process. Some factors such as DNA degradation, matrix effects, and the presence of PCR inhibitors imply that a detection or quantification limit, established for a given method, is restricted to a matrix used during validation and cannot be projected to any other matrix outside the scope of the method. In Brazil, sausage samples were the main class of processed products in which Roundup Ready®(RR) soybean residues were detected. Thus, the validation of methodologies for the detection and quantification of those residues is absolutely necessary. Sausage samples were submitted to two different methods of DNA extraction: modified Wizard and the CTAB method. The yield and quality were compared for both methods. DNA samples were analyzed by conventional and real-time PCR for the detection and quantification of Roundup Ready® soybean in the samples. At least 200 ng of total sausage DNA was necessary for a reliable quantification. Reactions containing DNA amounts below this value led to large variations on the expected GM percentage value. In conventional PCR, the detection limit varied from 1.0 to 500 ng, depending on the GM soybean content in the sample. The precision, performance, and linearity were relatively high indicating that the method used for analysis was satisfactory.
commercialized in the Brazilian market, revealed that sausages constitute the main product class in which these residues were detected (MARCELINO; GUIMARÃES; BARROS, 2007). From the analyses of about 200 sausage samples of different brands, randomly collected in the national market, over 70% tested positive for the presence of residues of RR® soybean. The RR® soybean residues were quantified by real time PCR reveling GMO presence above of 1% (MARCELINO, 2006).
RR®soybean residues in non-processed foods can be detected and quantified based on the presence of the 5-enol-pyruvylshikimate-3-phosphate synthase protein (EPSPS) by immunological methods (DUIJN et al., 1999; LIPP; ANKLAM; STAVE, 2000). Processed foods are usually analyzed with DNA-based procedures. The DNA-DNA-based methods make use of the polymerase chain reaction (PCR) technique and can be applied both to products in natura and to highly processed foods. Ho-wever, some products cause many inconveniences for extracting DNA with satisfactory amplificability (VAITILINGOM et al., 1999; LIPP et al., 2001; HÜBNER; STUDER; LÜTHY, 1999; VOLLENHOFER et al., 1999; CARDARELLI et al., 2005).
The analysis of processed foods presents some difficulties be-cause of the several treatments that the original ingredients have to undergo during processing; besides, several ingredients may be present in the final product. Some ingredients, such as proteins, polysaccharides, fat, salt, colorings, and others, may inhibit the PCR reaction (TERRY; HARRIS; PARKES, 2002). Chemical and physical treatments may lead to extensive DNA fragmentation preventing its use as template in the PCR reaction (MEYER, 1999). These effects imply that a detection or quantification limit, established for a given method, is restricted to a matrix used during validation and cannot be projected to any other matrix outside the scope of the method (LIPP et al., 2005).
Sausage samples undergo physical and chemical treat-ments during their production as well as addition of different ingredients.
Sausages are industrial meat products obtained by emulsi-fication of meat sources that can include one or several animal species. Artificial coloring may be added to the sausages that may also undergo smoking and/or peeling. In Brazil, sausages can contain up to 7.5% (dry basis) or 22.5% (wet basis) of textu-red soybean protein. Moreover, other ingtextu-redients may be added to the sausage, such as animal fat or vegetable oil, salt, water, emulsifiers, artificial colorings, sugars, aromatic substances, and seasonings. During its preparation the product undergoes cooking at 72 °C for at least 0.5 hour.
The aim of the present work was the establishment of a me-thodology for the detection and quantification of RR® soybean residues in samples of sausages commercialized in the national market using the PCR technique.
2 Materials and methods
2.1 Soybean food samples
Samples of the major commercial brands of sausages marketed in Brazil, with similar industrial process but different batches, were collected in the local market in Viçosa city in the Minas Gerais state.
2.2 Soybean reference samples
Certified reference material (CRM), i.e., soybean powder containing 0.1 to 5.0% Roundup Ready® soybean (Fluka), was used for qualitative and quantitative analyses. RR® soybean grains were also used as a control sample.
2.3 Genomic DNA extraction
Duplicate samples of approximately 500 g of sausage were homogenized in an electric blender. The DNA extraction was tested by two different methodologies: modified wizard and the CTAB method.
Modified wizard method
In the modified Wizard method, 1,290 µL extraction buffer [10 mM Tris-HCl (pH 8.0), 150 mM NaCl, 2 mM EDTA, and 1% SDS], 150 µL 5 M guanidine hydrochloride and proteinase K (20 mg.mL–1) were added to 500 mg of each sample and vortexed
until a homogeneous mixture was obtained. The samples were incubated at 55 °C for 12 hours and centrifuged for 15 minutes at 6,000 g. About 500 µL of the supernatant was mixed with 1 mL of Wizard resin (Promega) and then applied to a Wizard mini column. The column was washed with 2 mL 80% ethanol and then centrifuged at 10.000 g for 2 minutes to eliminate residual ethanol. The nucleic acids were eluted with 50 µL of water at 70 °C and stored at –20 °C.
CTAB method
In the CTAB method, approximately 100 mg of homoge-nized sausage samples were mixed with 500 µL CTAB buffer [50 mM CTAB, 1.4 M NaCl, 100 mM Tris-HCl (pH 8), 20 mM EDTA] and incubated at 65 °C for 20 minutes. The samples were deproteinized by 520 µL chloroform/-isoamylic alcohol (24:1), vortexed and centrifuged for 10 minutes at 10.000 g. The supernatant was transferred into a new 1.5 mL eppendorf tube. The nucleic acids were precipitated with 1 volume of isopropanol and 0.5 volume of 7.5 M ammonium acetate and centrifuged for 10 minutes at 10.000 g. The supernatant was discarded and the pellet washed once with 500 µL 70% ethanol. The pellet was then dried at room temperature for approximately 10 minutes, resuspended in 50 µL water, and stored at –20 °C until use.
2.4 Yield and quality of nucleic acid extracts
The nucleic acid concentration in the extracts was esti-mated by spectrophotometry (A260 nm)using the Gene Quant Pro spectrophotometer (Amersham). One absorbance unit (260 nm) was assumed to correspond to 50 ng of nucleic acid per µL of solution. The purity of the sample was estimated from the A260/A280 ratio.
The extracts were further analyzed by electrophoresis in 1.2% agarose gels containing 0.1 µg.mL–1 ethidium bromide.
2.5 Quantitative PCR analysis of transgenic sequences
Real time PCR analyses were carried out in a SDS 7000 equi-pment (Applied Biosystems). Samples were amplified with the aid of the TaqMan GMO Soy 35S Detection Kit (Applied Biosystems). This kit is especially designed for the simultaneousof the 35S promoter and the soybean lectin gene targets. The kit contains AmpliTaq Gold polymerase and a master mix including MgCl2, dNTPs, uracyl N-glycosylase (UNG), the passive reference dye ROX, and primers and probes for both target sequences. The 35S probe was labeled with FAM at the 5’ end while the lectin probe was labeled with VIC. Reactions were carried out in 96-well microtiter plates in a total volume of 25 µL, containing 22 µL master mix, 0.5 µL AmpliTaq Gold, and 2.5 µL DNA extract (500 ng). For each plate, a no-template control, a negative con-trol and the 0.1 to 5.0% CRMs were analyzed together. After the initial steps at 50 °C for 2 minutes (UNG activity) and at 95 °C for 10 minutes (activation of the AmpliTaq Gold polymerase), a two-step program of 95 °C for 15 seconds and 60 °C for 1 minutes was conducted for 40 cycles. Details about the primer and probe sequences, amplicon sizes, and concentrations of the reaction components are not provided by the manufacturer in the kit.
2.6 Qualitative PCR analysis of transgenic sequences
After quantification, the sausage samples were also ampli-fied by conventional PCR with specific primers that flanked portions of the following target regions: 35S promoter (GenBank Accession AJ308514), NOS terminator (GenBank Accession 308515), and coding region of the EPSPS gene (GenBank Accession AB180963). In order to test whether the DNA samples could be amplified, preliminary amplification reactions with the lectin gene primers were conducted. The primer sequences and the sizes of the expected fragments are listed in Table 1.
Amplification reactions were performed in a thermocycler model 7900 (Applied Biosystems), in a final volume of 25 µL containing 10 mM Tris-HCl (pH 8.3), 50 mM KCl, 1.5 or 2.0 mM MgCl2, 2.5 mM of each dNTP, 1 U of Taq DNA polymerase, 0.2 pmoles of each primer, and 0.01 ng to 1,000 ng of template DNA. Amplification conditions for the lectin gene were 95 °C for 4 minutes, followed by 35 cycles of 95 °C for 30 seconds, 58 °C for 30 seconds, and 72 °C for 40 seconds. An additional extension step at 72 °C for 3 minutes was performed after the last cycle. Amplification conditions for the 35S promoter and the EPSPS regions were essentially the same as those used for the lectin gene, except that the number of cycles was increased to 40 and the annealing temperature for the 35S promoter
region was 62 °C. To amplify the NOS terminator region a “ touchdown” program was used: one step at 95 °C for 4 minutes, one cycle at 95 °C for 20 seconds, 68 °C for 40 seconds, and 72 °C for 1 minute followed by nine cycles in which the annealing temperature was decreased by 1 °C at every cycle. When the annealing temperature reached 58 °C, 20 additional cycles were conducted. An additional extension step at 72 °C for 3 minutes was performed after the last cycle.
2.7 Sensitivity of qualitative and quantitative PCR
The DNA extracted by the two methods used (modified Wizard and CTAB) was diluted and tested in the following amounts in the PCR reactions: 1,000, 500, 200, 100, 10, 0.1 and 0.01 ng. Each dilution was tested in duplicate in three indepen-dent amplification reactions. The LOD (limit of detection) was defined as the minimum amount of DNA in the reaction that led to the amplification of the fragment with the expected size in an agarose gel in all repetitions.
Quantitative multiplex reactions with primers for the 35S promoter region and the endogenous lectin gene labeled with different fluorescent dyes were also performed to establish the sensitivity for the quantification of RR® soybean present in the sausage samples. The conversion of mass into genome copy number was based on the haploid genome mass (1C value) for Glycine max, which is 1.25 pg, obtained from the Plant DNA C-values Database (BENNETT; LEITCH, 2003).
In addition to the amount tested for LOD determination, the amounts of 2,000 and 5,000 ng were also used. Based on the average Ct values obtained for each DNA amount, the quantification sensitivity, the linearity, and the coefficient of correlation were estimated.
3 Results and discussion
Both methods yielded a good quality of DNA. However, the samples obtained with the modified Wizard method were less degraded and presented fragments larger than 500 bp (Figure 1). For PCR detection and quantification of GMO in foodstuffs, the recommended amplicon size lies within the range of 70 to 200 bp. The reduced size of DNA molecules extracted from a processed matrix is of concern if a considerable portion of the fragments cannot function as PCR templates because their insufficient size does not span the entire target sequence (LIPP et al., 2005).
Table 1. Sequences of primers used in the qualitative PCR.The respective size of the PCR products is given in base pairs.
Primers Target Sequence Amplicon size
Lec-F Lectin gene 5´GCCCTCTACTCCACCCCCATCC 3´ 118 bp
Lec-R 5´GCCCATCTGCAAGCCTTTTTGTG 3´
Nos-Long F NOS terminator 5´ATTGCGGGACTCTAATCATAAAAA 3´ 180 bp
Nos Long-R 5´ATCGTTCAAACATTTGGCAATAA 3´
RR-F Region of the EPSPS gene 5´TGATGTGATATCTCCACTGACG 3´ 172 bp
RR-R 5´TGTATCCCTTGAGCCATGTTGT 3´
35-S 35S promoter 5´GATAGTGGGATTGTGCGTCA 3´ 195 bp
The ratio A260/A280, a measure of DNA purity, indicated that samples extracted by the Wizard method presented a lower degree of contaminants. The average A260/A280 ratio value for the samples extracted by the Wizard method was 1.70, whereas for the samples extracted by the CTAB method the average ratio was 1.48. The average DNA yields were 31.5 µg (Wizard) and 75 µg (CTAB). This is most probably due to in the latter there were more A260 absorbing contaminants than in the samples obtained by the Wizard method.
The presence of inhibitors during the PCR reactions was tested by the amplification of a specific region of the endogenous soybean lectin gene. The amplification was done with at least 100 ng of sausage DNA samples obtained by both extraction methods. As for the DNA extracted from soybean grains, ampli-fication products were visualized when 0.1 ng (at least) of target DNA was added to the reaction mix (Figure 2). This correspon-ds to approximately 80 copies of the soybean genome.
3.1 Quantitative PCR
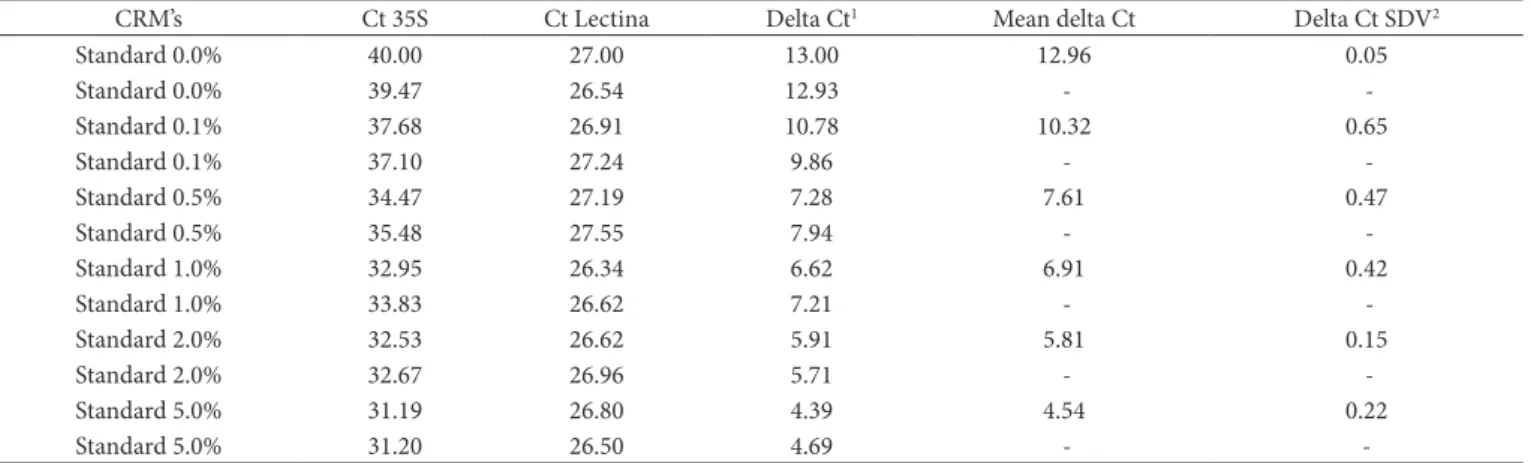
The percentage of GM soybean in the sausage samples was determined by the relative quantification delta Ct method. The calibration curve was established with certified reference materials (Fluka) containing 0.1, 0.5, 1.0, 2.0 and 5.0% RR® soybean. The obtained correlation coefficient (R2) was 0.9957,
which is above the minimum acceptable value of 0.98. The delta Ct values obtained varied from 12.96, for the negative control, to 4.54 for the 5% reference sample. The characteristics of the delta Ct curves are summarized in Table 2 and Figure 3.
Table 3 shows the quantitative data for the sausage samples. For the delta Ct method, unknown percentages of GMO are directly derived from the determined delta Ct values. Mean relative values of GMO % for the three analyzed samples were 39.84, 24.28 and 0.62. The mean values of the RSD % for the samples which presented more than 5% RR® soybean were all below 10% both within and among the runs, except in the third replicate of the second run. However, for the sample with the lowest GMO content, close to 0.5%, the RSD % values were hi-gher. The highest value (42.79%) was obtained for the repetition in the third run. The mean RSD % value was 33.07%. Although the RSD % values for the sample with low GMO content was relatively high, the precision of the experiment is still considered acceptable. For methods of GMO analysis, the precision and trueness of the quantitative estimates are acceptable if values
for RSD % and error are not higher than 20% (TAVERNIERS; BOCKSTALE; LOOSE, 2004; TAVERNIERS et al., 2001). Values varying from 20 to 35% for intra-lab imprecision and bias in quantitative real-time PCR data were also reported in other studies, especially if concentrations at the 0.1% level are considered (DAHINDEN et al., 2002; PARDIGOL; GUILLET; PÖPPING, 2003). In all runs the SDV was very low, indicating high accuracy of the results.
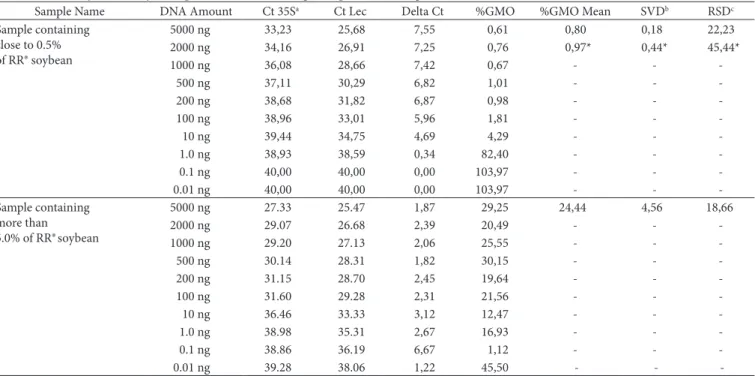
To test the sensitivity of the quantification method, the total DNA of the sausage samples containing 24.28% and 0.62% RR® soybean was diluted and different amounts of DNA (0.01 to 5,000 ng) were used in multiplex reactions in which the targets were the 35S promoter region and the lectin gene. At least 100 ng of total sausage DNA was necessary for a reliable quantification of the sample containing more than 5.0% of RR® soybean. When the amount of DNA was decreased to 100 ng or less, the Ct va-lue deviated slightly from the calculated standard curve, which
1 2 3 4 5 6 M 7 8 9 10 11 12
600 bp
Figure 1. Electrophoretic profile of sausage DNA samples extracted
by the modified Wizard (lanes 1 to 6) and the CTAB (lanes 7 to 12) methods. M: 100 bp DNA Ladder (Invitrogen).
1 2 3 4 5 6 7 8 9 10 11 12 13 14 15M
600 bp
100 bp
Calibration curve
7.61 6.91 10.32
5.81 4.54 y = –1.4648Ln(x) + 6.8352 R2 = 0.9957
0.00 2.00 4.00 6.00 8.00 10.00 12.00
0.10 1.00 10.00
GMO (%)
D
el
ta C
t
Figure 2. Electrophoretic analysis of the quality of sausage DNA
sam-ples. Total DNA was amplified with specific primers for the soybean lectin gene (118 bp). Different amounts of sausage DNA were tested in the amplification reactions: 0.01, 0.1, 1.0, 10, 100, 200, 500 and 1,000 ng (lanes 1 through 8, respectively). Lanes 10 through 14 were loaded with soybean grain DNA: 0.01, 0.1, 1.0, 10, and 100 ng, respectively. Lanes 9 and 15: no DNA. Lane M: 100 bp DNA Ladder (Invitrogen).
Figure 3. Delta Ct calibration curve obtained with certified reference
materials (Fluka) containing 0.1, 0.5, 1.0, 2.0 and 5.0% RR® soybean. The difference between the Ct values for the transgenic target and the endogenous reference was plotted as a function of logarithm of the GM percentage. The coefficient of correlation obtained (R2) was 0.9957,
Table 2. Ct and delta Ct values for the transgenic target and the endogenous reference obtained by the amplification of the certified reference materials (CRM) using quantitative PCR.
CRM’s Ct 35S Ct Lectina Delta Ct1 Mean delta Ct Delta Ct SDV2
Standard 0.0% 40.00 27.00 13.00 12.96 0.05
Standard 0.0% 39.47 26.54 12.93 -
-Standard 0.1% 37.68 26.91 10.78 10.32 0.65
Standard 0.1% 37.10 27.24 9.86 -
-Standard 0.5% 34.47 27.19 7.28 7.61 0.47
Standard 0.5% 35.48 27.55 7.94 -
-Standard 1.0% 32.95 26.34 6.62 6.91 0.42
Standard 1.0% 33.83 26.62 7.21 -
-Standard 2.0% 32.53 26.62 5.91 5.81 0.15
Standard 2.0% 32.67 26.96 5.71 -
-Standard 5.0% 31.19 26.80 4.39 4.54 0.22
Standard 5.0% 31.20 26.50 4.69 - -
1Ct = Cycle threshold; and 2SDV = Standard deviation value.
Table 3. Percentage estimate of RR® soybean in sausage samples. Positive samples for the presence of GM soybean were quantified by real-time
PCR using the delta Ct method. Each sample was amplified in duplicate in three independent PCR runs.
Runs Sample name Delta Ct1 %GMO %GMO Mean per run SDV per run2 % RSD per run3 %GMO Mean SDV Mean Mean % RSD
1 Sample 1.1 1.37 41.01 41.56 0.78 1.88 39.8415 6.9963 6.2770
Sample 1.2 1.33 42.11 - - - - - -
2 Sample 1.3 1.83 29.96 31.71 2.48 7.83 - - -
Sample 1.4 1.67 33.47 - - - - - -
3 Sample 1.5 1.10 49.23 46.25 4.22 9.12 - - -
Sample 1.6 1.29 43.27 - - - - - -
1 Sample 2.1 1.93 28.02 27.81 0.29 1.04 24.2801 4.0593 8.8711
Sample 2.2 1.95 27.61 - - - - - -
2 Sample 2.3 2.46 19.53 20.33 1.12 5.53 - - -
Sample 2.4 2.35 21.12 - - - - - -
3 Sample 2.5 1.92 28.20 24.70 4.95 20.05 - - -
Sample 2.6 2.34 21.20 - - - - - -
1 Sample 3.1 6.93 0.94 0.80 0.19 24.29 0.6282 0.2432 33.0750
Sample 3.2 7.44 0.66 - - - - - -
2 Sample 3.3 8.52 0.32 0.41 0.13 32.14 - - -
Sample 3.4 7.84 0.50 - - - - - -
3 Sample 3.5 7.02 0.88 0.68 0.29 42.79 - - -
Sample 3.6 7.94 0.47 - - - - - -
1Ct = Cycle threshold; 2SDV = Standard deviation value; e 3RSD = relative standard deviation.
indicated that the quantification was not accurate. The mean GMO % value of 24.44 was obtained for dilutions containing 100 to 5,000 ng total sausage DNA, with an SDV 4.56 and a CV % of 18.66. This value differs only by 0.16% from the originally determined value (24.28%). However, for the sample containing 0.62% RR® soybean at least 200 ng of the total sausage DNA were necessary for a reliable quantification of the sample. When only 100 ng of the total sausage sample were used, the RSD % and SDV values were higher (0.44 and 45.44%, respectively) in contrast with the values of 0.18 and 22.23% when 200 ng were added (Table 4). This sensitivity is well above the experimentally determined LOQ (30 copies of the target) for a pure (100%) soy product (BERDAL; HOLST-JENSEN, 2001). However, this limit is only applicable if DNA is of sufficient purity and quality. DNA samples extracted from a typical food matrix will usually be of lower purity than the DNA typically used for validating PCR methods, such as plasmid DNA or DNA extracted from raw or
low-processed materials. Thus, the relative detection and quan-tification limits are functions of the DNA template. For real food analysis, it is necessary to define the functional limits to be used. In addition to the low copy number, the harsh conditions during the processing of the samples led to fragmented DNA. It is known that measurement uncertainty generally increases with a decrease in the number of target copies or GMO content (PARDIGOL; GUILLET; PÖPPING, 2003). In conclusion, the quantification of RR® soybean in the sausage samples was highly precise when the starting amount of the total sausage DNA was at least 100 ng for samples containing more than 5.0% and at least 200 ng for samples containing close to 0.5% of RR soybean. The delta Ct values for the different dilutions are presented in Table 4.
Table 4. Sensitivity of RR® soybean quantification in sausage samples containing close to 0.5% and more 5.0% of RR®
Sample Name DNA Amount Ct 35Sa Ct Lec Delta Ct %GMO %GMO Mean SVDb RSDc
Sample containing close to 0.5% of RR® soybean
5000 ng 33,23 25,68 7,55 0,61 0,80 0,18 22,23
2000 ng 34,16 26,91 7,25 0,76 0,97* 0,44* 45,44*
1000 ng 36,08 28,66 7,42 0,67 - -
-500 ng 37,11 30,29 6,82 1,01 - -
-200 ng 38,68 31,82 6,87 0,98 - -
-100 ng 38,96 33,01 5,96 1,81 - -
-10 ng 39,44 34,75 4,69 4,29 - -
-1.0 ng 38,93 38,59 0,34 82,40 - -
-0.1 ng 40,00 40,00 0,00 103,97 - -
-0.01 ng 40,00 40,00 0,00 103,97 - - -
Sample containing more than 5.0% of RR®soybean
5000 ng 27.33 25.47 1,87 29,25 24,44 4,56 18,66
2000 ng 29.07 26.68 2,39 20,49 - -
-1000 ng 29.20 27.13 2,06 25,55 - -
-500 ng 30.14 28.31 1,82 30,15 - -
-200 ng 31.15 28.70 2,45 19,64 - -
-100 ng 31.60 29.28 2,31 21,56 - -
-10 ng 36.46 33.33 3,12 12,47 - -
-1.0 ng 38.98 35.31 2,67 16,93 - -
-0.1 ng 38.86 36.19 6,67 1,12 - - -
0.01 ng 39.28 38.06 1,22 45,50 - -
-aCt = Cycle threshold; bSDV = Standard deviation value; cRSD = relative standard deviation; and *Values obtained when 100 ng of DNA was tested.
Figure 4. Linearity test of the quantification of RR® soy in sausages
samples. Different amounts of DNA (0.01 to 5.000 ng) were used in multiplex reactions in which the targets were the 35S promoter region and the lectin gene. The Ct-values were plotted against the logarithm of DNA concentration. The amplication of the lectin and 35S promoter region was linear within the dynamic working, as indicated by the correlation coefficient value which was greater than 0.98.
LOQ 35S
y = –2.1406 + 35.823 R2 = 0.9858
20 23 25 28 30 33 35 38 40 43
–3 –1 1 3 5
Starting quantify
C
yc
le t
hr
es
ou
ld
LOQ Lectin
y = –2.7066 + 35.377 R2 = 0.9911
20 23 25 28 30 33 35 38 40 43
–3 –1 1 3 5
Starting quantify
C
yc
le t
hr
es
ou
ld
within the dynamic working range defined by the Ct-values for the highest and lowest target concentrations, as indicated by the correlation coefficient value which was greater than 0.98. A linear relationship with a slope of –2.406 and –2.066 for lectin and 35S promoter region, respectively, was obtained between the Ct value and the starting DNA quantity.
3.2 Qualitative PCR
The sausage samples previously quantified were analyzed by conventional PCR. The DNA extracted by both methods was amplified with specific primers for the 35S promoter re-gion, the NOS terminator, and the coding region of the EPSPS gene (Figures 5, 6 and 7, respectively). The target regions were detected in the different samples tested. However, the detection sensitivity varied according to the percentage of GM soybean in the samples. LOD values for the EPSPS gene fragment, the 35S promoter region, and the NOS terminator were 1.0 ng, 100 ng and 100 ng, respectively, for samples with GM soybean content higher than 5%. Nonetheless, for the samples with GM soybean content close to 0.5%, the LOD values increased to 10, 500, and 500 ng, respectively. In all reactions, non-GM soybean samples were used as negative controls. In addition, the intensity of the obtained DNA bands was compared with those of standard references containing 0.5 and 1.0% of RR® soybean and of DNA extracted from soybean grains which were 100% GM.
4 Conclusions
homogenized sausage, both methods yielded enough DNA for analysis. The DNA obtained by both methods presented good quality and the samples with GMO content close to 0.5% could be detected and quantified with precision.
Usually, a large amount of DNA (100-500 ng) is needed for the detection and quantification of GMO in foodstuffs. Ne-vertheless, for sausage samples, low quantities of RR® soybean could be detected and quantified in relatively small amounts of total DNA: 1.0 ng for the EPSPS target in the qualitative analy-sis and 200 ng for the 35S promoter region in the quantitative analysis.
Acknowledgements
The authors are grateful for the support provided by the Federal University of Viçosa and the Genetic Analyses Labora-tory – AgroGenética.
References
BENNETT, M. D.; LEITCH, I. J. Plant DNA C-Values Database. Kew, UK: Royal Botanic Gardens, 2003. Disponível em: http//<http:// www.rbgkew.org.uk/cval/homepage.html>.
BERDAL, K.; HOLST-JENSEN, A. A Roundup Ready soybean event-specific real-time quantitative PCR assay and estimation of the practical detection and quantification limits in GMO analyses.
European Food Research Technology, v. 213, n. 4, p. 432-438,
2001.
CARDARELLI, P. et al. Detection of GMO in food prodcts em Brazil: the INCQS experience. Food Control, v. 16, n. 10, p. 859-866, 2005.
DAHINDEN, I. et al. Microbiology and food analysis. In: REISCHl, U. et al. Rapid cycle real-time PCR – methods and applications. Berlin: Springer, 2002. Cap. 3, p. 251-258.
DUIJN, G. V. et al. Detection methods for genetically modified crops.
Food Control, v. 10, n. 6, p. 375–378, 1999.
HÜBNER, P.; STUDER, E.; LÜTHY, J. Quantification of genetically modified organisms in food. Nature Biotechnology, v. 17, n. 1, p. 1137-1138, 1999.
JAMES, C. Global status of commercialized transgenics crops: 2007. ISAAA Briefs Nº 37. Ithaca, NY: International Services for the Acquisition of Agri-Biotech Applications, 2007.
LIPP, M.; ANKLAM, E.; STAVE, J. Validation of an immunoassay for detection and quantification of genetically modified soybean in food and food fractions using reference materials: Inter-laboratory study.
Journal of AOAC International, v. 83, n. 4, p. 919-927, 2000.
LIPP, M. et al. Validation of method based on polymerase chain reaction for a for detection of genetically modified organisms in various processed foodstuffs.Europeran Food Research Technology, v. 212, n. 4, p. 497-504, 2001.
LIPP, M. et al. Polymerase chain reaction technology as analytical tool in agricultural biotechnology. Journal AOAC International, v. 88, n. 1, p. 136-154, 2001.
MARCELINO, F. C. Avaliação de resíduos de transgênicos em alimentos no Brasil e desenvolvimento de metodologias de
análise. Viçosa, 2006. 132p. Tese – (Doutorado em Genética e
Melhoramento), Universidade Federal de Viçosa – UFV.
MARCELINO, F. C.; GUIMARAES, M. F. M.; BARROS, E. G. Detecção e quantificação de alimentos geneticamente modificados: o panorama brasileiro. Revista Ceres, v. 54, n. 313, p. 240-250, 2007.
1 2 3 4 6 5 7 8 9 10 12 13 14 15 16 17 18 11 19 20 21 22 23 24 25 26 27 28 29 30 M 600 bp 100 bp
Figure 5. Electrophoretic analysis of qualitative PCR products of GM
soybean in sausage samples. The DNA was amplified with specific primers for the EPSPS coding region (172 bp) which is present in RR® soybean. DNA from sausage samples containing more than 5% (lanes 1 to 16) or close to 0.5% (lanes 17 to 25) RR®soybean. Total sausage DNA: 1,000 ng (lanes 1, 9, and 17), 500 ng (lanes 2, 10 and 18), 200 ng (lanes 3, 11 and 19), 100 ng (lanes 4, 12, and 20), 10 ng (lanes 5, 13, and 21), 1 ng (lanes 6, 14 and 22), 0.1 ng (lanes 7, 15, and 23), and 0.01 ng (lanes 8, 16, and 24). Lanes 25 (no DNA), 26 (CRM 0.5%), 27 (CRM 1.0%), 28 (DNA from 100% GM soybean grains), 29 (DNA from non-GM soybean grains), and 30 (no DNA), M: 100 bp size marker (Invitrogen).
600 bp 100 bp 1 2 3 4 6 5 7 8 9 10 12 13 14 15 16 17 18 11 19 20 21 22 23 24 25 26 27 28 29 30 M
Figure 6. Electrophoretic analysis of qualitative PCR products of GM
soybean in sausage samples. The DNA was amplified with specific primers for 35S promoter region (195 bp) which is present in RR® soybean. DNA from sausage samples containing more than 5% (lanes 1 to 16) or close to 0.5% (lanes 17 to 25) RR®soybean. Total sausa-ge DNA: 1,000 ng (lanes 1, 9, and 17), 500 ng (lanes 2, 10 and 18), 200 ng (lanes 3, 11 and 19), 100 ng (lanes 4, 12, and 20), 10 ng (lanes 5, 13, and 21), 1 ng (lanes 6, 14 and 22), 0.1 ng (lanes 7, 15, and 23), and 0.01 ng (lanes 8, 16, and 24). Lanes 25 (no DNA), 26 (CRM 0.5%), 27 (CRM 1.0%), 28 (DNA from 100% GM soybean grains), 29 (DNA from non-GM soybean grains), and 30 (no DNA), M: 100 bp size marker (Invitrogen). 600 bp 100 bp 1 2 3 4 6 5 7 8 9 10 12 13 14 15 16 17 18 11 19 20 21 22 23 24 25 26 27 28 29 M
Figure 7 Electrophoretic analysis of qualitative PCR products of GM
TAVERNIERS, I.; BOCKSTAELE, E.; DE LOOSE, M. Cloned plasmid DNA fragments as calibrators for controlling GMOs: different real-time duplex quantitative PCR methods. European Food Research
and Technology, v.378, n. 5, p. 1198-1207, 2004.
TERRY, C. F.; HARRIS, N.; PARKES, H. Detection of Genetically modified crops and their derivatives: critical steps in sample preparation and extraction. Journalof AOACInternational, v. 85, n. 3, p. 768-774, 2002.
VAITILINGOM, M. et al. Real time of genetically modified Maximizer maize and Roundup Ready soybean in some representative foods. Journal of Agricultural and Food Chemistry, v. 47, n. 12, p. 5261-5266, 1999.
VOLLENHOFER, S. et al. Genetically modified organism in food-screening and specific detection by polymerase chain reaction.
Journal of Agricultural and Food Chemistry, v. 47, n. 12,
p. 5038–5043, 1999. MEYER, R. et al. Polymerase Chain Reaction (PCR) in the quality
and safety assurance of food: detection of soya in processed meat products. ZLebensm Unters ForschA., v. 203, n. 4, p. 339-344, 1996.
MEYER, R. Development and application of DNA analytical methods for the detection of GMOs in food. Food Control, v. 10, n. 6, p. 391-399, 1999.
PARDIGOL, A.; GUILLET, S.; PÖPPING, B. A simple procedure for quantification of genetically modified organisms using hybrid amplicon standards. European Food Research Technology, v. 216, n. 5, p. 412-420, 2003.